. 2020 Nov 17;13(658):eabb7209.
doi: 10.1126/scisignal.abb7209.

NF-κB activation persists into the remodeling phase of tendon healing and promotes myofibroblast survival

Affiliations

NF-κB activation persists into the remodeling phase of tendon healing and promotes myofibroblast survival

Katherine T Best et al. Sci Signal. .

Abstract

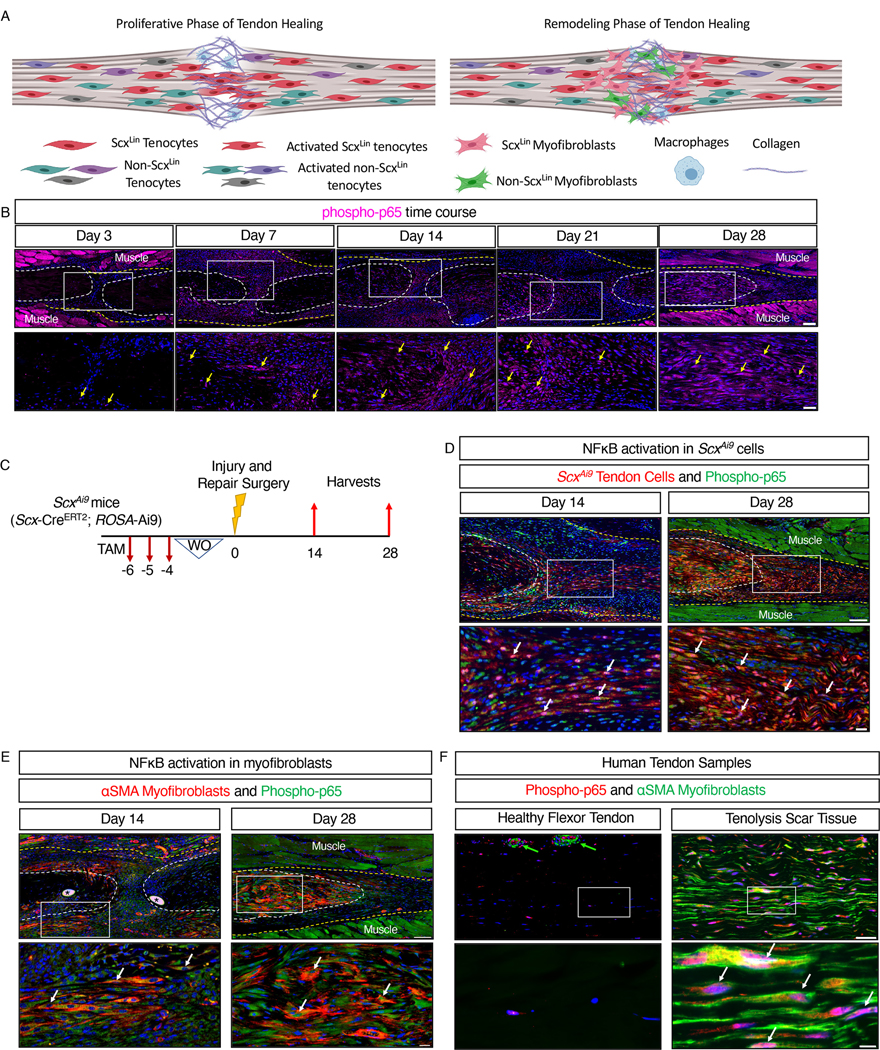
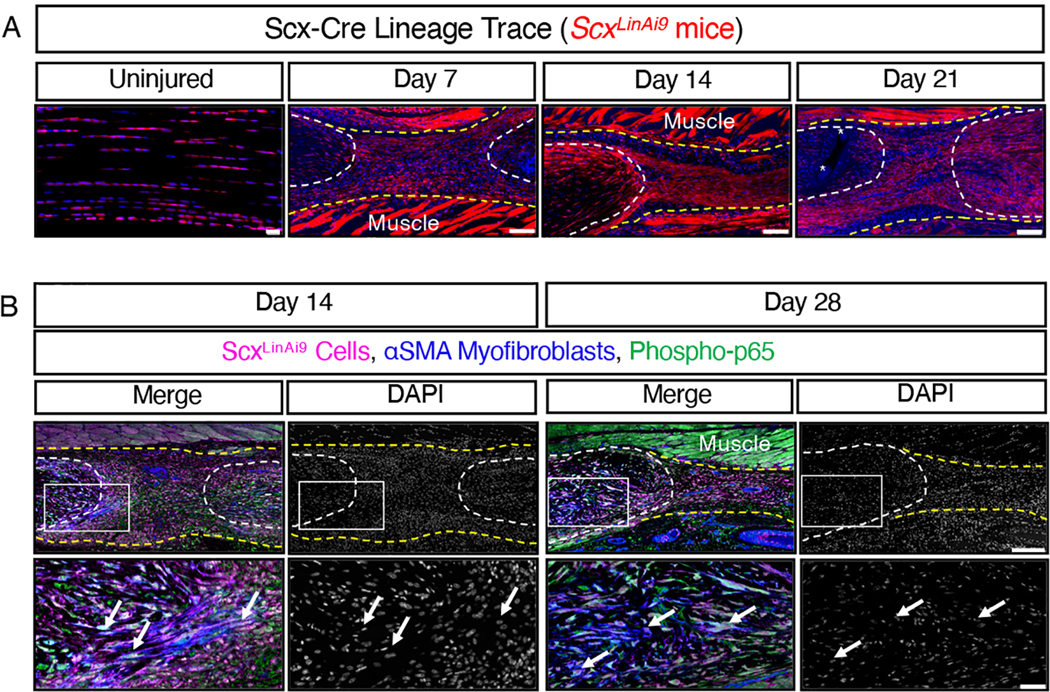
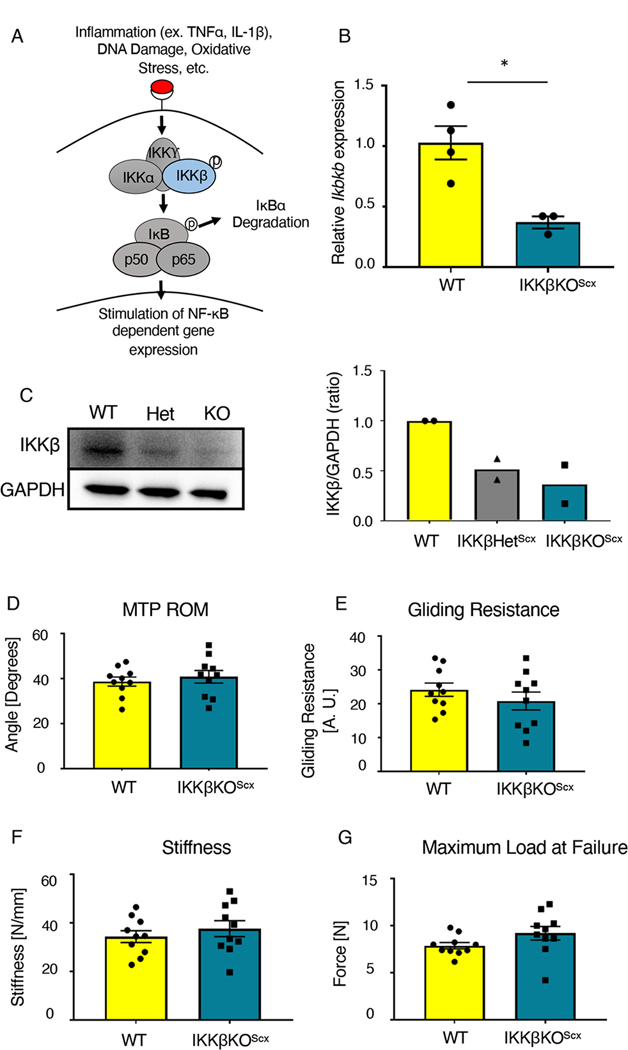
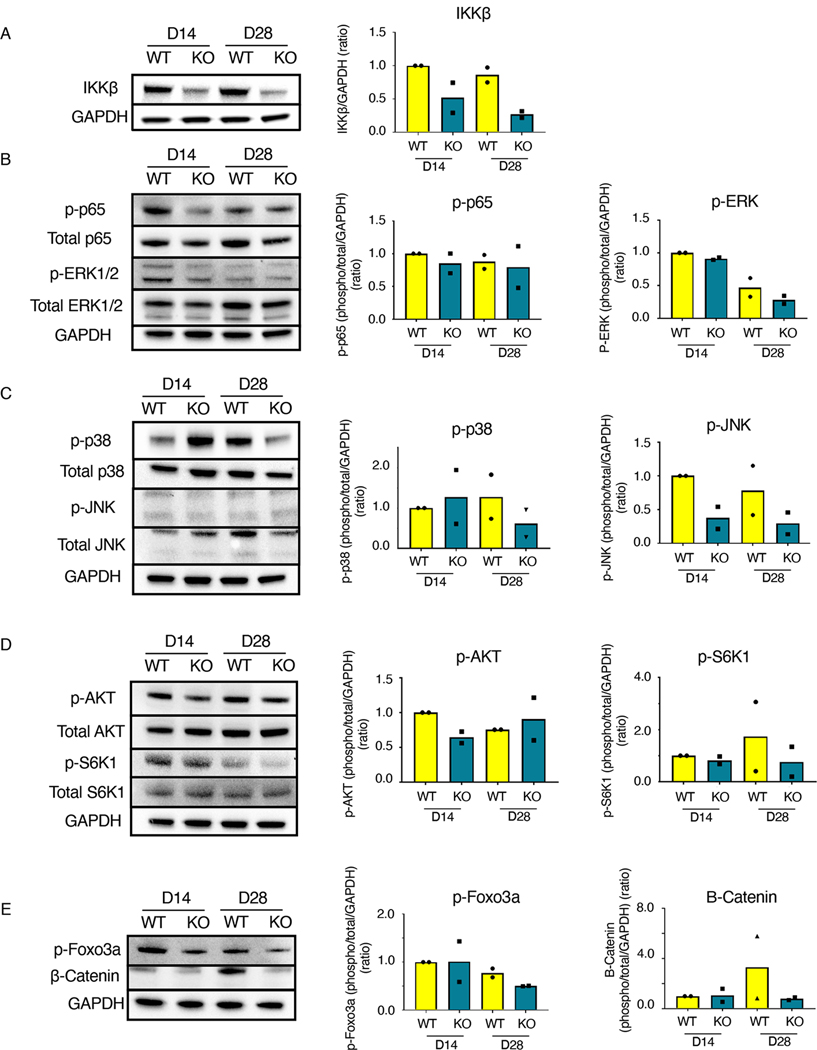
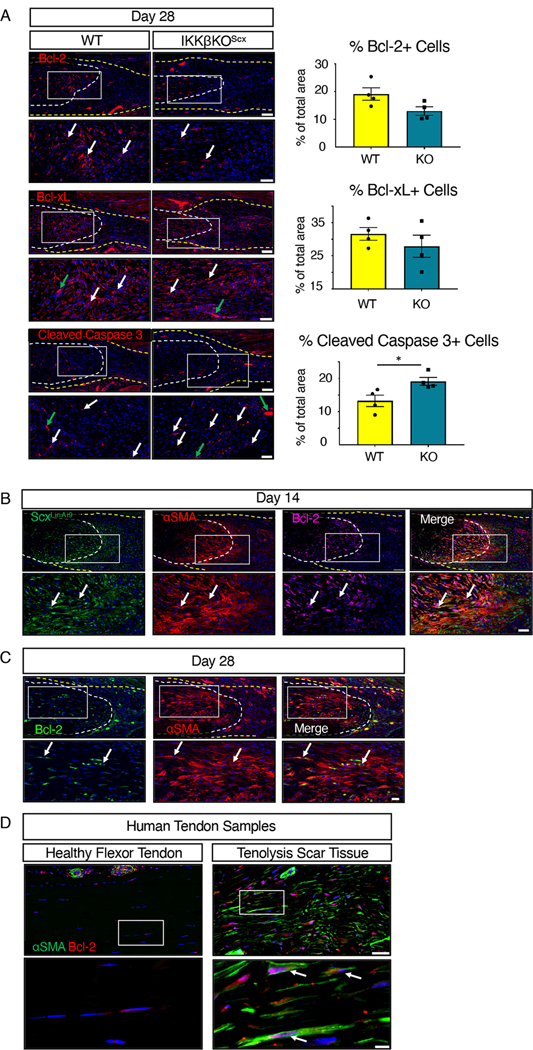
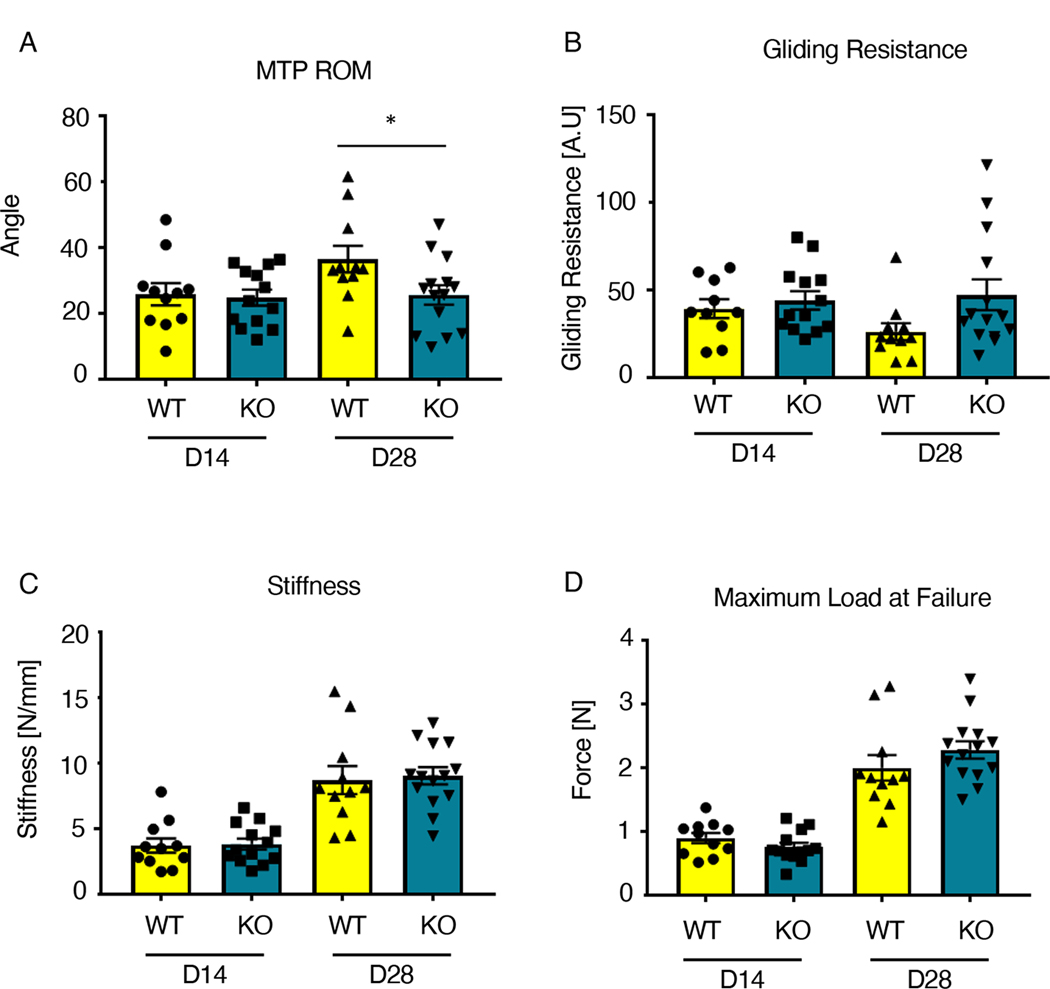
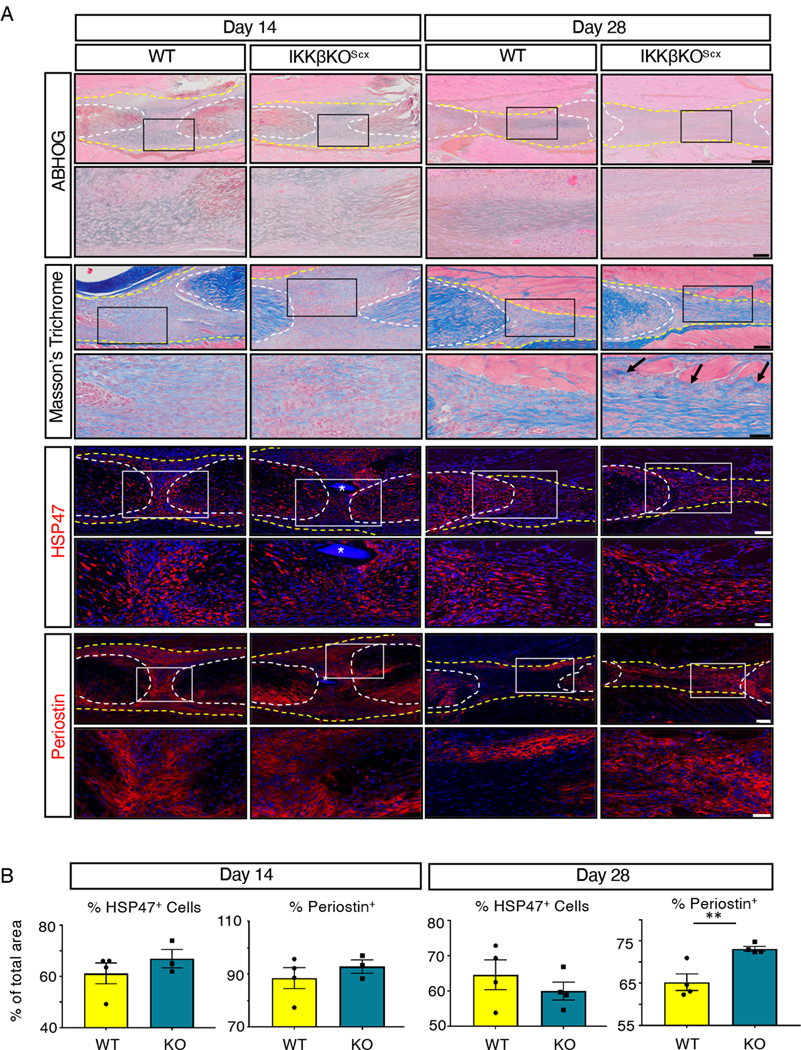
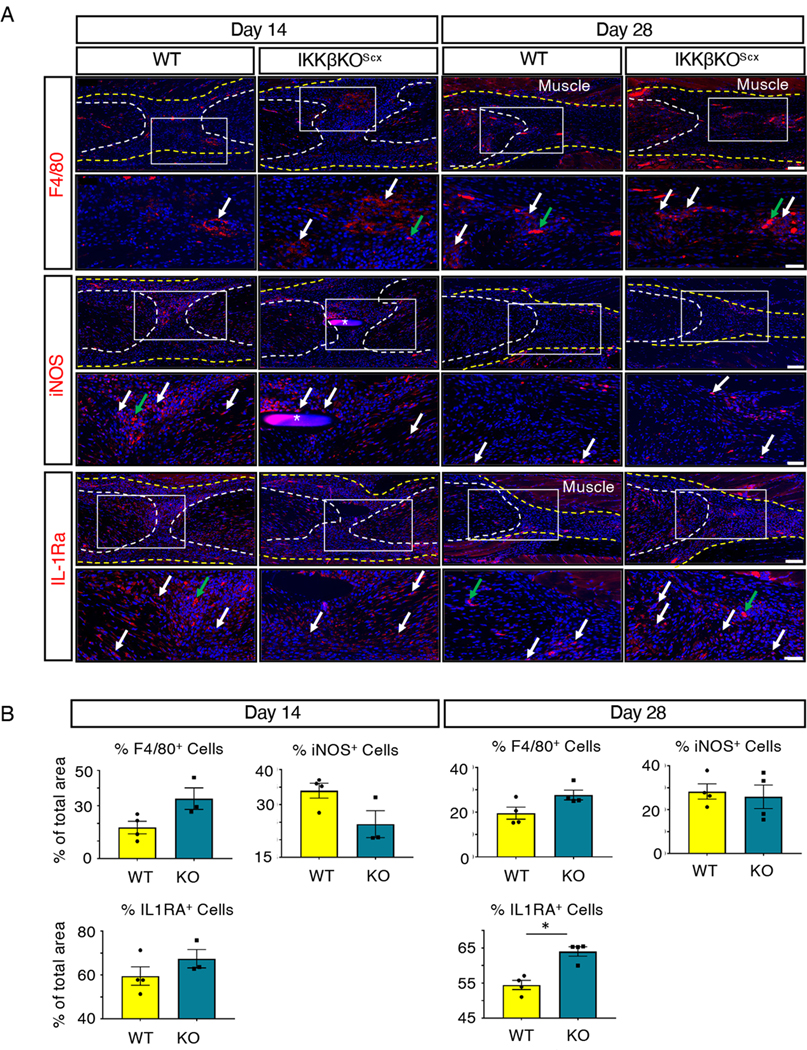
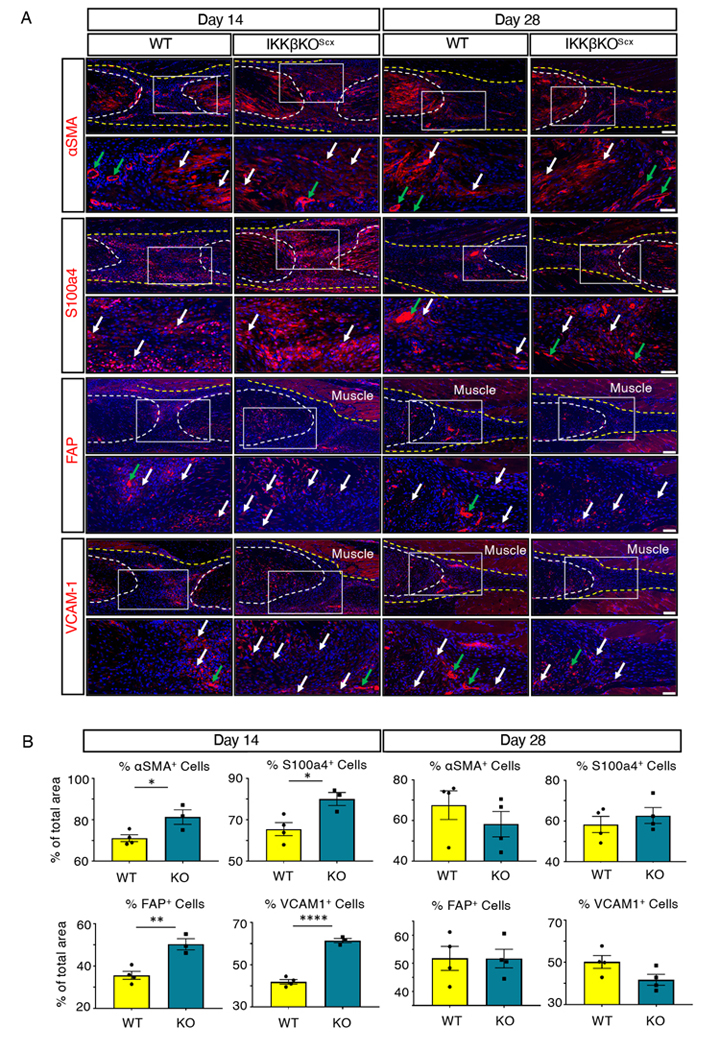
Although inflammation is necessary during the early phases of tissue repair, persistent inflammation contributes to fibrosis. Acute tendon injuries often heal through a fibrotic mechanism, which impedes regeneration and functional recovery. Because inflammation mediated by nuclear factor κB (NF-κB) signaling is implicated in this process, we examined the spatial, temporal, and cell type-specific activation profile of canonical NF-κB signaling during tendon healing. NF-κB signaling was maintained through all phases of tendon healing in mice, including the remodeling phase, and tenocytes and myofibroblasts from the Scleraxis (Scx) lineage were the predominant populations that retained NF-κB activation into the late stages of repair. We confirmed persistent NF-κB activation in myofibroblasts in human tendon scar tissue. Deleting the canonical NF-κB kinase, IKKβ, in Scx-lineage cells in mice increased apoptosis and the deposition of the matrix protein periostin during the late stages of tendon repair, suggesting that persistent NF-κB signaling may facilitate myofibroblast survival and fibrotic progression. Consistent with this, myofibroblasts in human tendon scar samples displayed enhanced prosurvival signaling compared to control tissue. Together, these data suggest that NF-κB may contribute to fibrotic tendon healing through both inflammation-dependent and inflammation-independent functions, such as NF-κB-mediated cell survival.


Figures

Fig. 1.
Fig. 1.. Canonical NF-κB signaling persists throughout tendon healing and is activated in tendon cells and αSMA+ myofibroblasts.
(A) Overview of the proliferative and remodeling phases of tendon healing. The heterogeneous population of tenocytes derived from both the Scx lineage (ScxLin) and other precursors becomes activated after injury, with ScxLin tenocytes migrating into the injury site to form an aligned cellular bridge across the damaged area. Some ScxLin and non- ScxLin cells then transdifferentiate into myofibroblasts, with both tenocytes and myofibroblasts interacting with macrophages throughout healing. Different color cells denote different subpopulations of cells. ScxLin cells are red, and ScxLin-derived myofibroblasts are pink. Image was created with Biorender.com (B) Immunofluorecence showing phosphorylated p65 (phospho-p65, pink) in sections of healing tendons from C57Bl/6J mice at 3, 7, 14, 21, and 28 days after tendon transection surgery. Yellow arrows indicate examples of positive stain. The tendon stubs are outlined by white dotted lines and the surrounding scar tissue by a yellow dotted line. n=3–4 mice per time point. Scale bars, 100 μM (upper) and 50 μM (lower). (C) Generation of ScxAi9 mice by crossing Scx-CreERT2 mice to the ROSA-Ai9 reporter line to enable tamoxifen (TAM)-inducible labeling of cells expressing Scx just prior to the time of tendon injury and repair with tdTomato (Ai9). (D and E) Co-immunofluorescence showing phospho-p65 (green) and tdTomato (red) in healing tendons of ScxAi9 mice (D) and phospho-p65 (green) and αSMA (red) in healing tendons of C57Bl/6J mice (E) at the indicated times after tendon transection. White arrows indicate examples of co-localization. Sutures are indicated by *. N=3–4 mice per timepoint. Scale bars, 100 μM (upper) and 20 μM (lower). (F) Co-immunofluorescence showing αSMA (green) and phospho-p65 (red) in human healthy flexor tendon and tenolysis scar tissue formed at and around flexor tendon repair. Co-localization is indicated by white arrows, and blood vessels by green arrows. N=2 healthy flexor tendons and N=2 tenolysis scar tissue samples. Scale bars, 50 μM (upper) and 20 μM (lower). For all images, nuclei were stained with DAPI (blue), and the white boxes in the upper images indicate the regions shown below in the higher magnification images. Auto-fluorescent muscle is labeled.
Fig. 2.
Fig. 2.. Scx-Cre mice can be used to target both tendon cells and myofibroblasts.
(A) Scx-Cre mice were crossed to ROSA-Ai9 reporter mice to label and trace Scx-lineage (ScxLinAi9) cells (red) during homeostasis (uninjured) and throughout healing at days 7, 14, and 21 post-surgery. N=3–4 mice per timepoint. Sutures labeled by *. Scale bars, 20 μM (uninjured) and 100 μM (post-surgery). (B) Co-immunofluorescence of tdTomato (labels ScxLinAi9 cells, pink), αSMA+ myofibroblasts (blue), and phospho-p65+ (green) cells in ScxLinAi9 mice at days 14 and 28 post-surgery. The white boxes in the upper images indicate the regions shown below in the higher magnification images. N=3–4 mice per timepoint. Scale bars, 200 μM (upper) and 50 μM (lower). For all images, nuclei were stained with DAPI (blue in (A), grey in (B)). Auto-fluorescent muscle is labeled. Examples of positive stain are indicated by white arrows. Tendon stubs are outlined by white dotted lines and scar tissue by yellow dotted line.
Fig. 3.
Fig. 3.. IKKβKOScx does not negatively affect baseline tendon gliding function or biomechanical properties.
(A) IKKβ is a kinase that stimulates canonical NF-κB signaling and downstream gene expression by promoting the degradation of the inhibitor IκBα. (B) Quantitative PCR for Ikbkb in uninjured tendons from wild-type (WT) and IKKβKOScx mice normalized to β-actin expression. N=3–4 pooled samples per genotype, where each pooled sample consists of tendons from 3–4 mice. (C) Western blot for and quantification of IKKβ in protein extracted from uninjured tendons from wild-type, IKKβHetScx, and IKKβKOScx mice. N=2 independent experiments, with 3 mice per genotype pooled per independent experiment. Complete blots for one biological replicate are shown in fig. S3. (D to G) Measurement of metatarsophalangeal (MTP) joint flexion angle (D), gliding resistance (E), stiffness (F), and maximum load at failure (G) of uninjured tendons from wild-type and IKKβKOScx mice. N=10 mice per genotype. Students t-test was used to assess statistical significance between genotypes. *, p ≤ 0.05.
Fig. 4.
Fig. 4.. IKKβKOScx affects several signaling cascades in addition to canonical NF-κB signaling.
Western blots and quantification for the indicated components of NF-κB, MAPK, mTOR, AKT, β-Catenin, and apoptosis signaling in tendons from wild-type and IKKβKOScx mice 14 and 28 days after tendon transection. (A) IKKβ. (B) Total p65, phosphorylated p65 (p-p65), total ERK1/2, and phosphorylated ERK1/2 (p-ERK1/2). (C) Total p38, phosphorylated p38 (p-p38), total JNK, and phosphorylated JNK (p-JNK). (D) Total AKT, phosphorylated AKT (p-AKT), total S6K1, and phosphorylated S6K1 (p-S6K1). (E) β-catenin and phosphorylated Foxo3a (p-Foxo3a). Complete blots for one biological replicate are shown in fig. S4. N=2 independent experiments, with 3 mice pooled per genotype per timepoint for each independent experiment.
Fig. 5.
Fig. 5.. IKKβKOScx increases apoptosis.
(A) Immunofluorescence and quantification of Bcl-2, Bcl-xL, and cleaved caspase 3 in tendons from wild-type and IKKβKOScx mice 28-days after tendon transection. N=4 mice per genotype. Scale bars, 100 μM (upper) and 50 μM (lower). Student’s t-test used to assess statistical significance between genotypes at a given time point. *, p ≤ 0.05. (B) Co-immunofluorescence of tdTomato (ScxLinAi9 cells, green), αSMA (red), and Bcl-2 (pink) in day 14 post-surgery mouse tendon. N=3–4 mice. Scale bars, 100 μM (upper) and 50 μM (lower). (C) Co-immunofluorescence of αSMA (red) and Bcl-2 (green) at day 28 post-surgery in C57Bl/6J mouse tendon. N=3–4 mice. Scale bars, 50 μM (upper) and 20 μM (lower). (D) Co-immunofluorescence of αSMA (green) and Bcl-2 (red) in healthy human flexor tendon and tenolysis scar tissue from flexor tendon. N=2 healthy human tendon samples and N=2 tenolysis scar tissue samples. Scale bars, 50 μM (upper) and 20 μM (lower). For all images, tendon is outlined by white dotted lines, scar tissue is outlined by a yellow dotted line, white arrows indicate examples of positive staining, and green arrows indicate auto-fluorescent blood cells. Boxes in the upper images indicate the regions shown below in higher magnification. Nuclei were stained with DAPI (blue).
Fig. 6.
Fig. 6.. IKKβKOScx tendons heal with impaired gliding ability.
(A to D) Measurement of metatarsophalangeal (MTP) joint flexion angle (A), gliding resistance (B), stiffness (C), and maximum load at failure (D) of wild-type and IKKβKOScx tendons at 14 and 28 days post-surgery. N=10–14 mice per genotype per timepoint. Two-way ANOVA with Sidak’s multiple comparisons test was used to assess statistical significance between genotypes at a given time point. *, p ≤ 0.05.
Fig. 7.
Fig. 7.. IKKβKOScx tendons heal with increased periostin deposition.
(A) Histology of wild -type and IKKβKOScx tendons 14 and 28 days post-surgery. Alcian blue/hematoxylin and Orange G stain (ABHOG) was used to assess overall morphology. Masson’s trichrome stain was used to visualize collagen content and organization. Example of collagen disorganization are indicated by black arrows. The collagen chaperone HSP47 and periostin matrix were assessed by immunofluorescence. For all images, tendon stubs are outlined by white dotted lines and scar tissue by yellow dotted lines, and boxes in the upper images indicate the regions shown below in the higher magnification images. Nuclei were stained with DAPI (blue). Sutures are labeled by *. N=3–4 mice per genotype per time point. Scale bars, 200 μM (upper) and 50 μM (lower) for ABHOG stains; 100 μM (upper) and 50 μM (lower) for Masson’s Trichrome stain, HSP47, and periostin. (B) Quantification of HSP47 and periostin at days 14 and 28 post-surgery. N=3–4 mice per genotype per timepoint. Student’s t-test used to assess statistical significance between genotypes at a given timepoint, except for day 14 HSP47 which required a Mann-Whitney test. ** indicates p ≤ 0.01.
Fig. 8.
Fig. 8.. IKKβKOScx enhances M2 macrophage polarization.
(A) Immunofluorescence of wild-type and IKKβKOScx tendons at 14 and 28 days post-surgery to assess F4/80+ macrophages, iNOS (M1 macrophages), and IL-1RA (M2 macrophages). Tendon stubs are outlined by white dotted lines and scar tissue by a yellow dotted line. White boxes in the upper images indicate the regions shown below in the higher magnification images. Examples of positive stain are indicated by white arrows, and examples of auto-fluorescent blood cells are indicated by green arrows. Auto-fluorescent muscle is labeled, and nuclei are stained with DAPI (blue). Sutures are labeled with *. N=3–4 mice per genotype per timepoint. Scale bars, 100 μM (upper) and 50 μM (lower). (B) Quantification of F4/80, iNOS, and IL-1RA fluorescence at days 14 and 28 post-surgery. N=3–4 mice per genotype per timepoint. Student’s t-test used to assess statistical significance between genotypes at a given time point, except for day 28 F4/80, day 14 iNOS, and day 28 IL-1RA, which required a Mann-Whitney test. *, p ≤ 0.05.
Fig. 9.
Fig. 9.. IKKβKOScx drives increased fibroblast activation and myofibroblast presence at day 14 post-surgery relative to wild type.
(A) Immunofluorescence of wild-type and IKKβKOScx tendons at 14 and 28 days post-surgery to assess markers of myofibroblasts and activated fibroblasts: αSMA, S100a4, FAP, and VCAM-1. Tendon stubs are outlined by white dotted lines and scar tissue by a yellow dotted line. White boxes in the upper images indicate the regions shown below in the higher magnification images. Examples of positive stain are indicated by white arrows, and examples of auto-fluorescent blood cells and α-SMA+ blood vessels are indicated by green arrows. Auto-fluorescent muscle is labeled, and nuclei are stained with DAPI (blue). N=3–4 mice per genotype per timepoint. Scale bars, 100 μM (upper) and 50 μM (lower). (B) Quantification of αSMA, S100a4, FAP, and VCAM-1 fluorescence at days 14 and 28 post-surgery. N=3–4 mice per genotype per timepoint. Student’s t-test used to assess statistical significance between genotypes at a given time point, except for day 28 αSMA, which required a Mann-Whitney test. * indicates p ≤ 0.05, ** indicates p ≤ 0.01, **** indicates p ≤ 0.0001.

Similar articles

Cited by

References

    1. Thorpe CT, Screen HR, Tendon Structure and Composition. Advances in experimental medicine and biology 920, 3–10 (2016). - PubMed
    1. Kendal AR, Layton T, Al-Mossawi H, Appleton L, Dakin S, Brown R, Loizou C, Rogers M, Sharp R, Carr A, Multi-omic single cell analysis resolves novel stromal cell populations in healthy and diseased human tendon. Sci Rep 10, 13939 (2020). - PMC - PubMed
    1. Best KT, Loiselle AE, Scleraxis lineage cells contribute to organized bridging tissue during tendon healing and identify a subpopulation of resident tendon cells. FASEB J 33, 8578–8587 (2019). - PMC - PubMed
    1. Howell K, Chien C, Bell R, Laudier D, Tufa SF, Keene DR, Andarawis-Puri N, Huang AH, Novel Model of Tendon Regeneration Reveals Distinct Cell Mechanisms Underlying Regenerative and Fibrotic Tendon Healing. Sci Rep 7, 45238 (2017). - PMC - PubMed
    1. Yoshimoto Y, Takimoto A, Watanabe H, Hiraki Y, Kondoh G, Shukunami C, Scleraxis is required for maturation of tissue domains for proper integration of the musculoskeletal system. Sci Rep 7, 45010 (2017). - PMC - PubMed

Publication types

MeSH terms

Substances

LinkOut - more resources