. 2021 Mar;11(3):678-695.
doi: 10.1158/2159-8290.CD-19-1500. Epub 2020 Nov 17.

The Lipogenic Regulator SREBP2 Induces Transferrin in Circulating Melanoma Cells and Suppresses Ferroptosis

Affiliations

The Lipogenic Regulator SREBP2 Induces Transferrin in Circulating Melanoma Cells and Suppresses Ferroptosis

Xin Hong et al. Cancer Discov. 2021 Mar.

Abstract

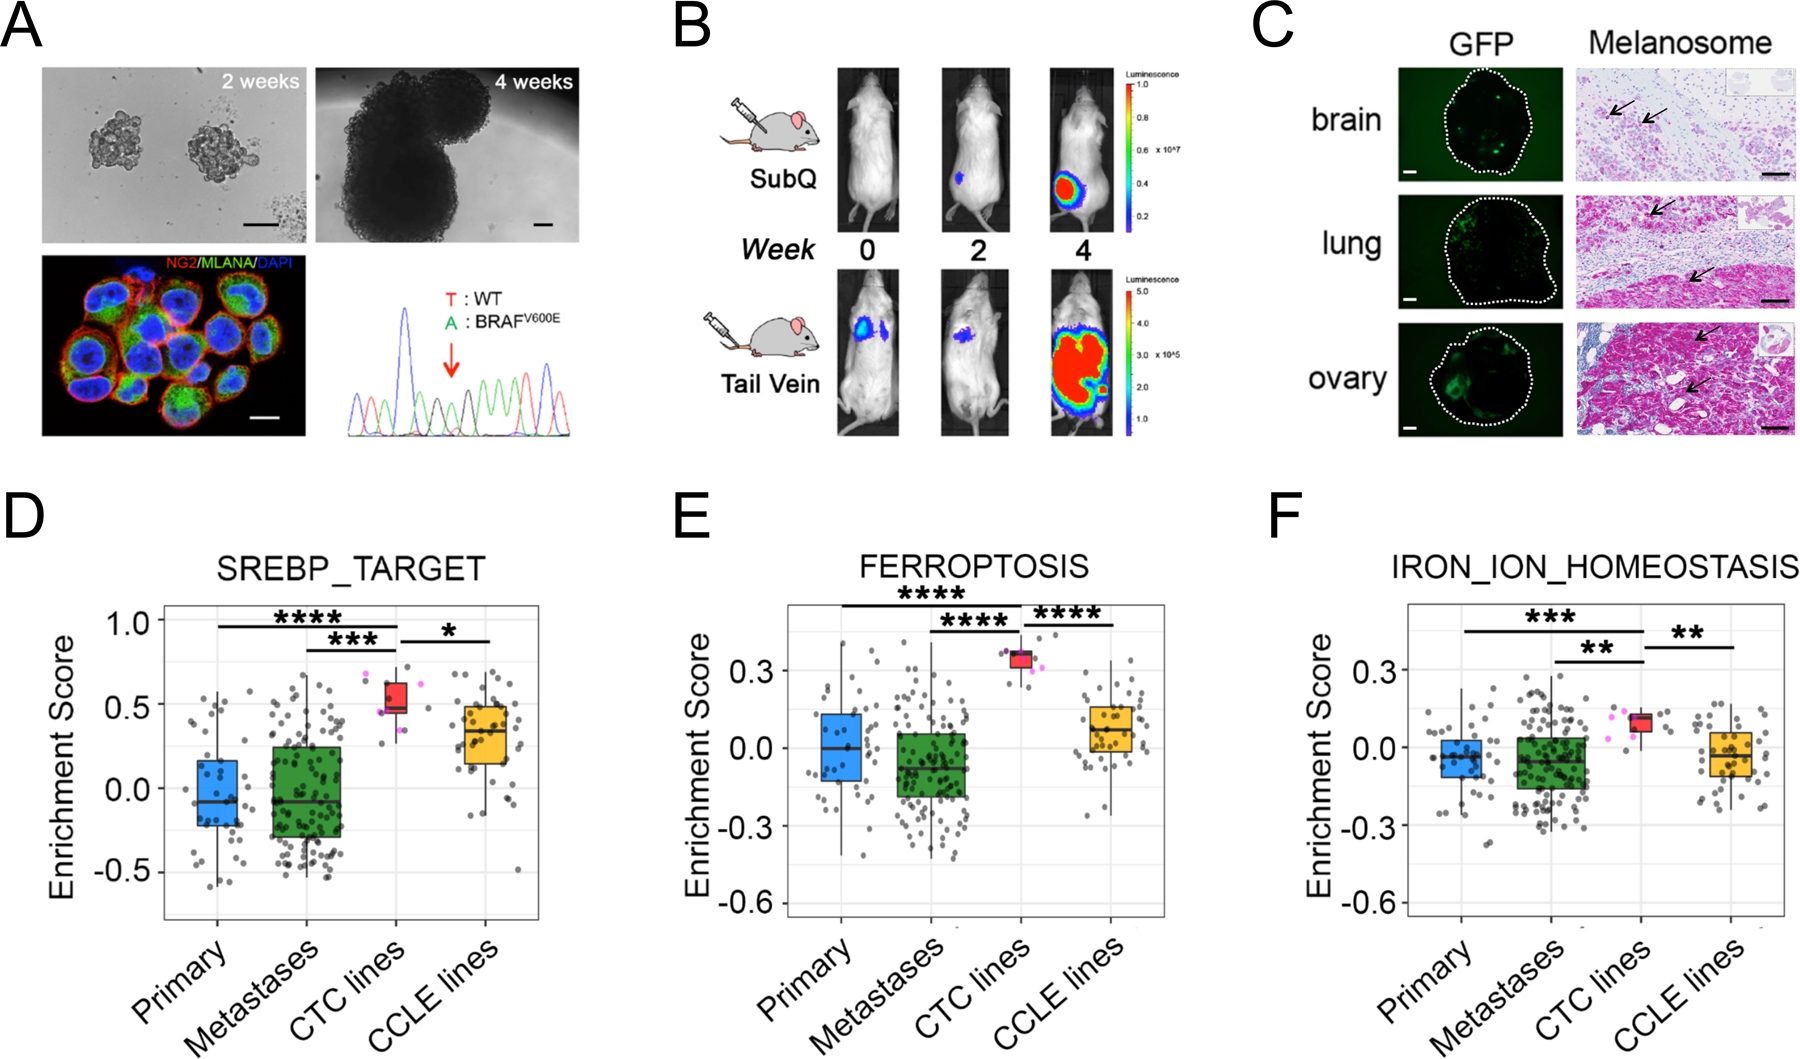
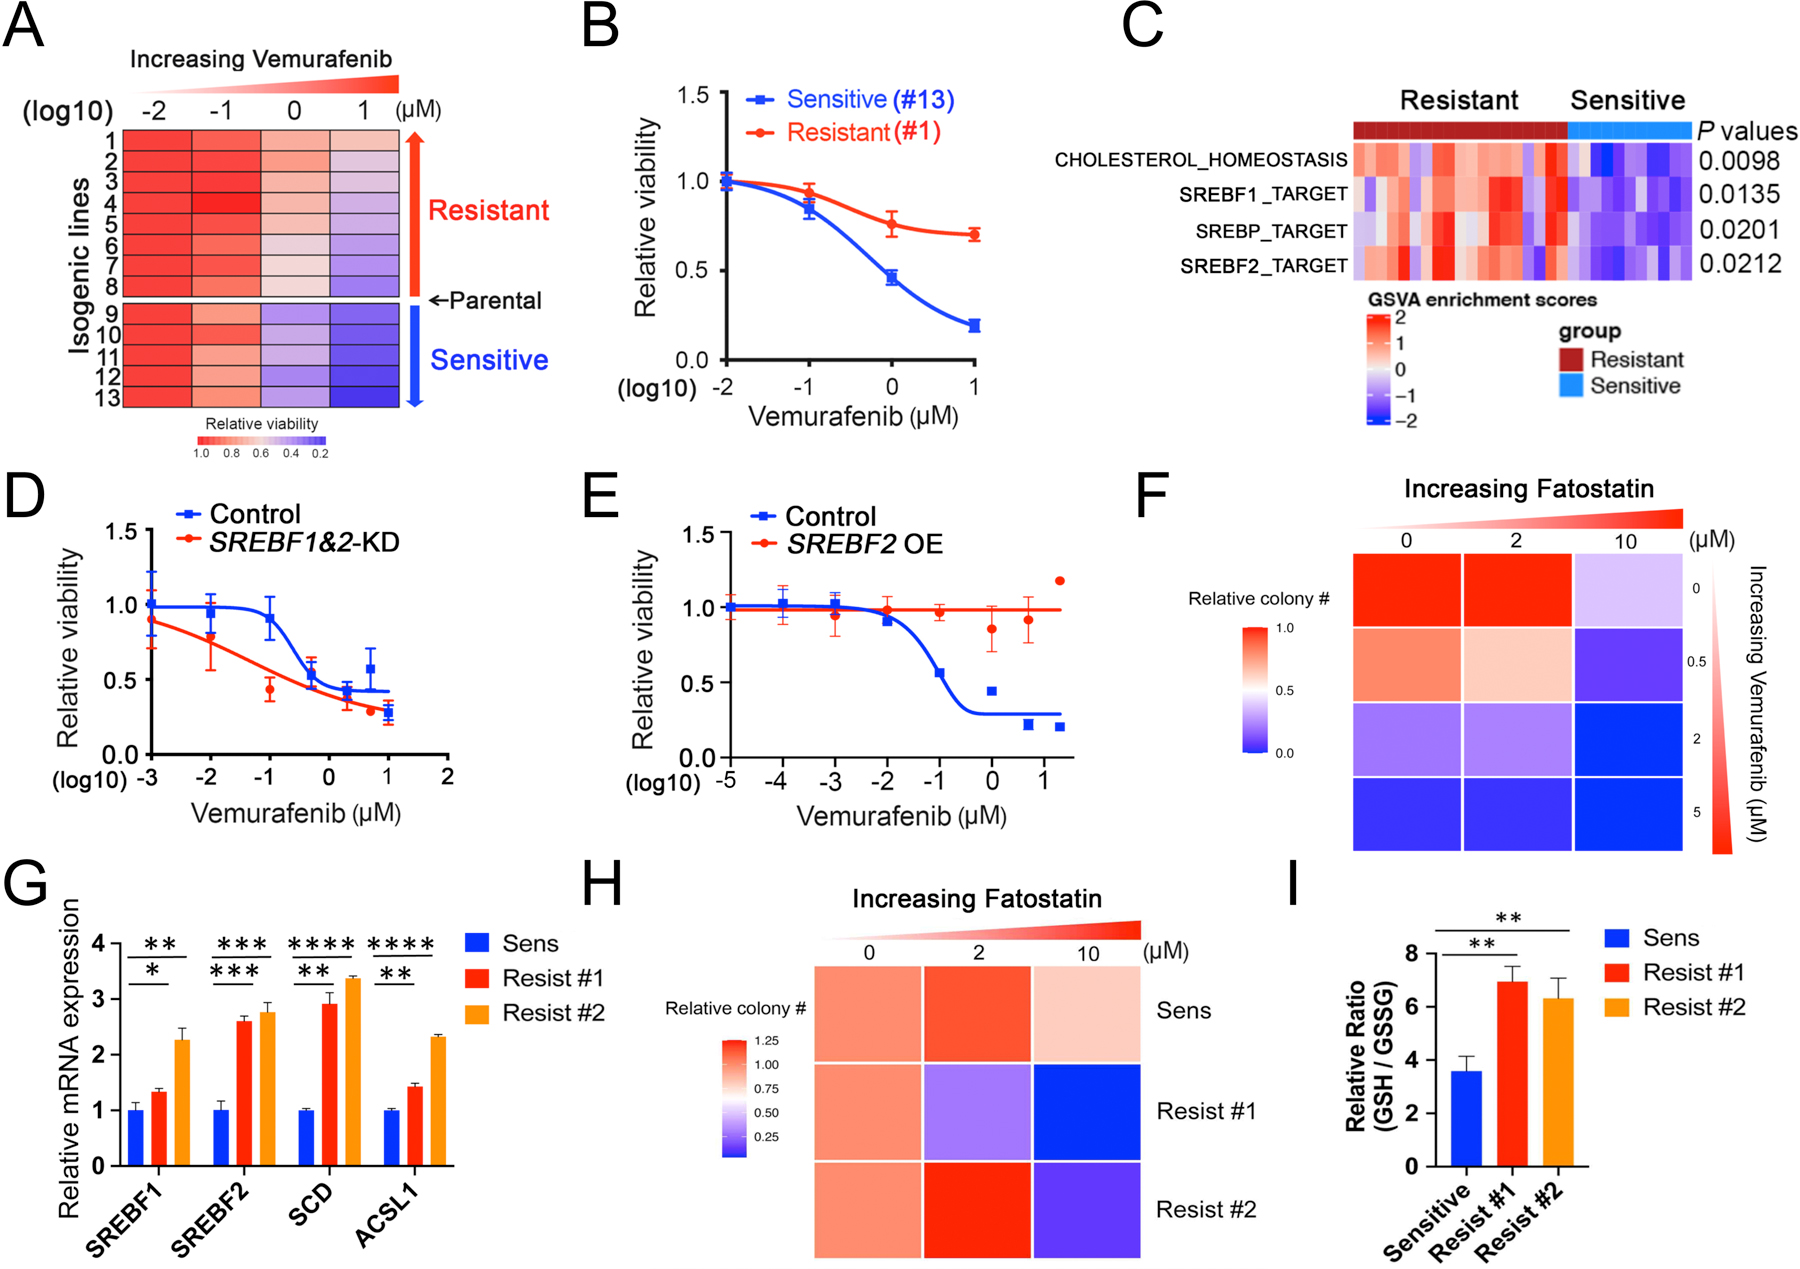
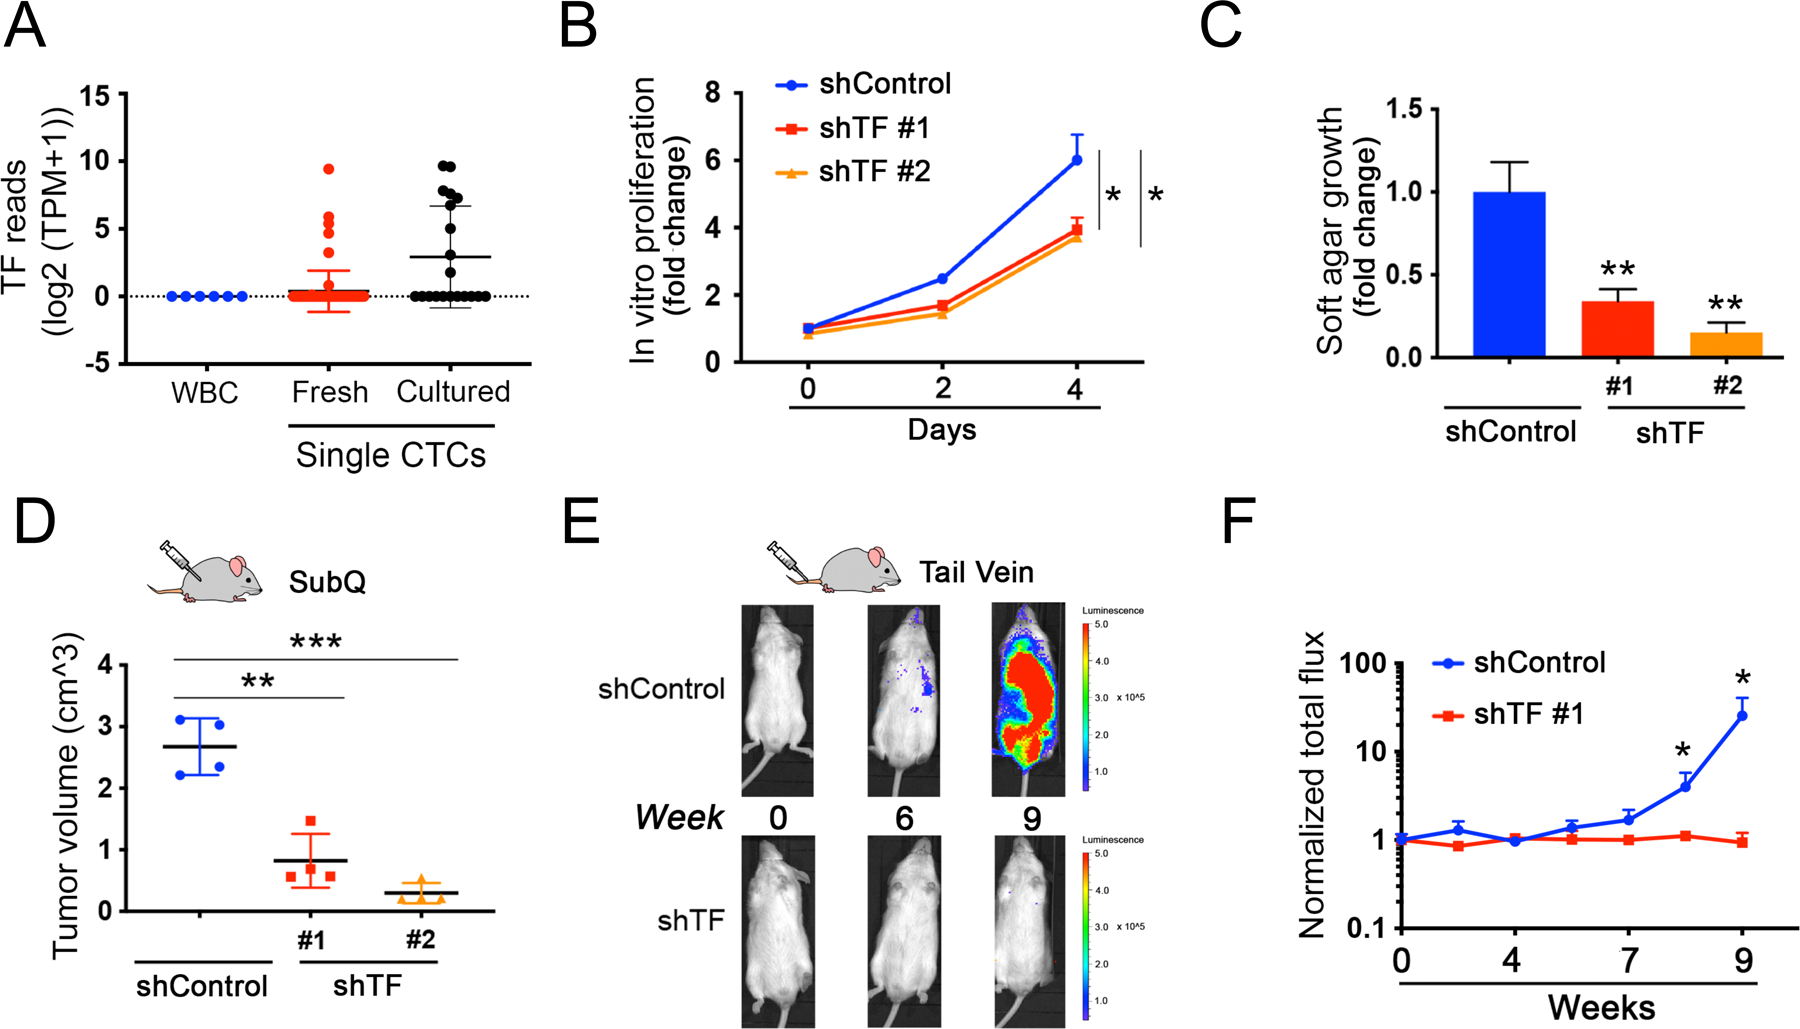
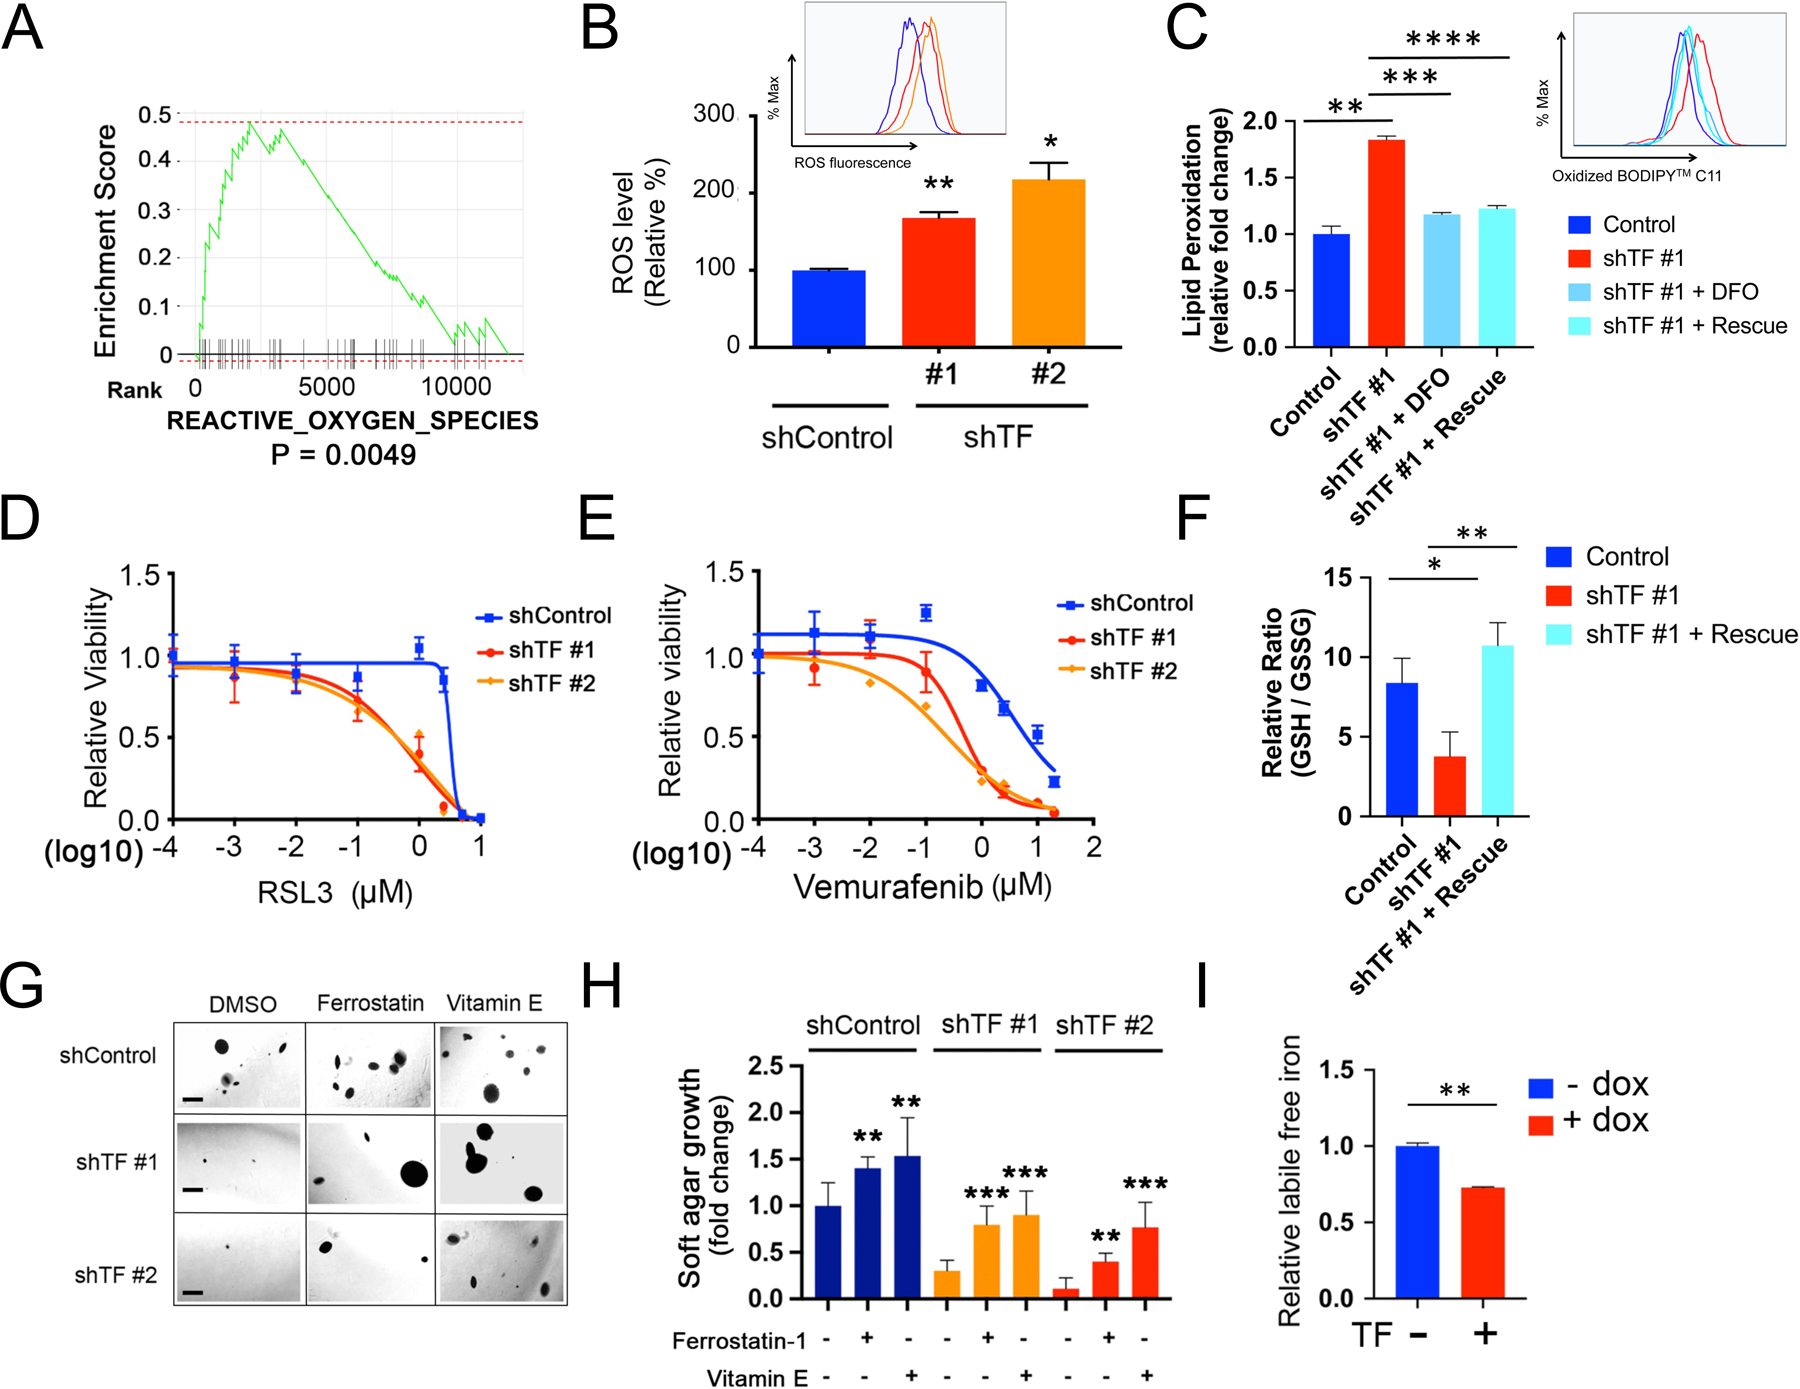
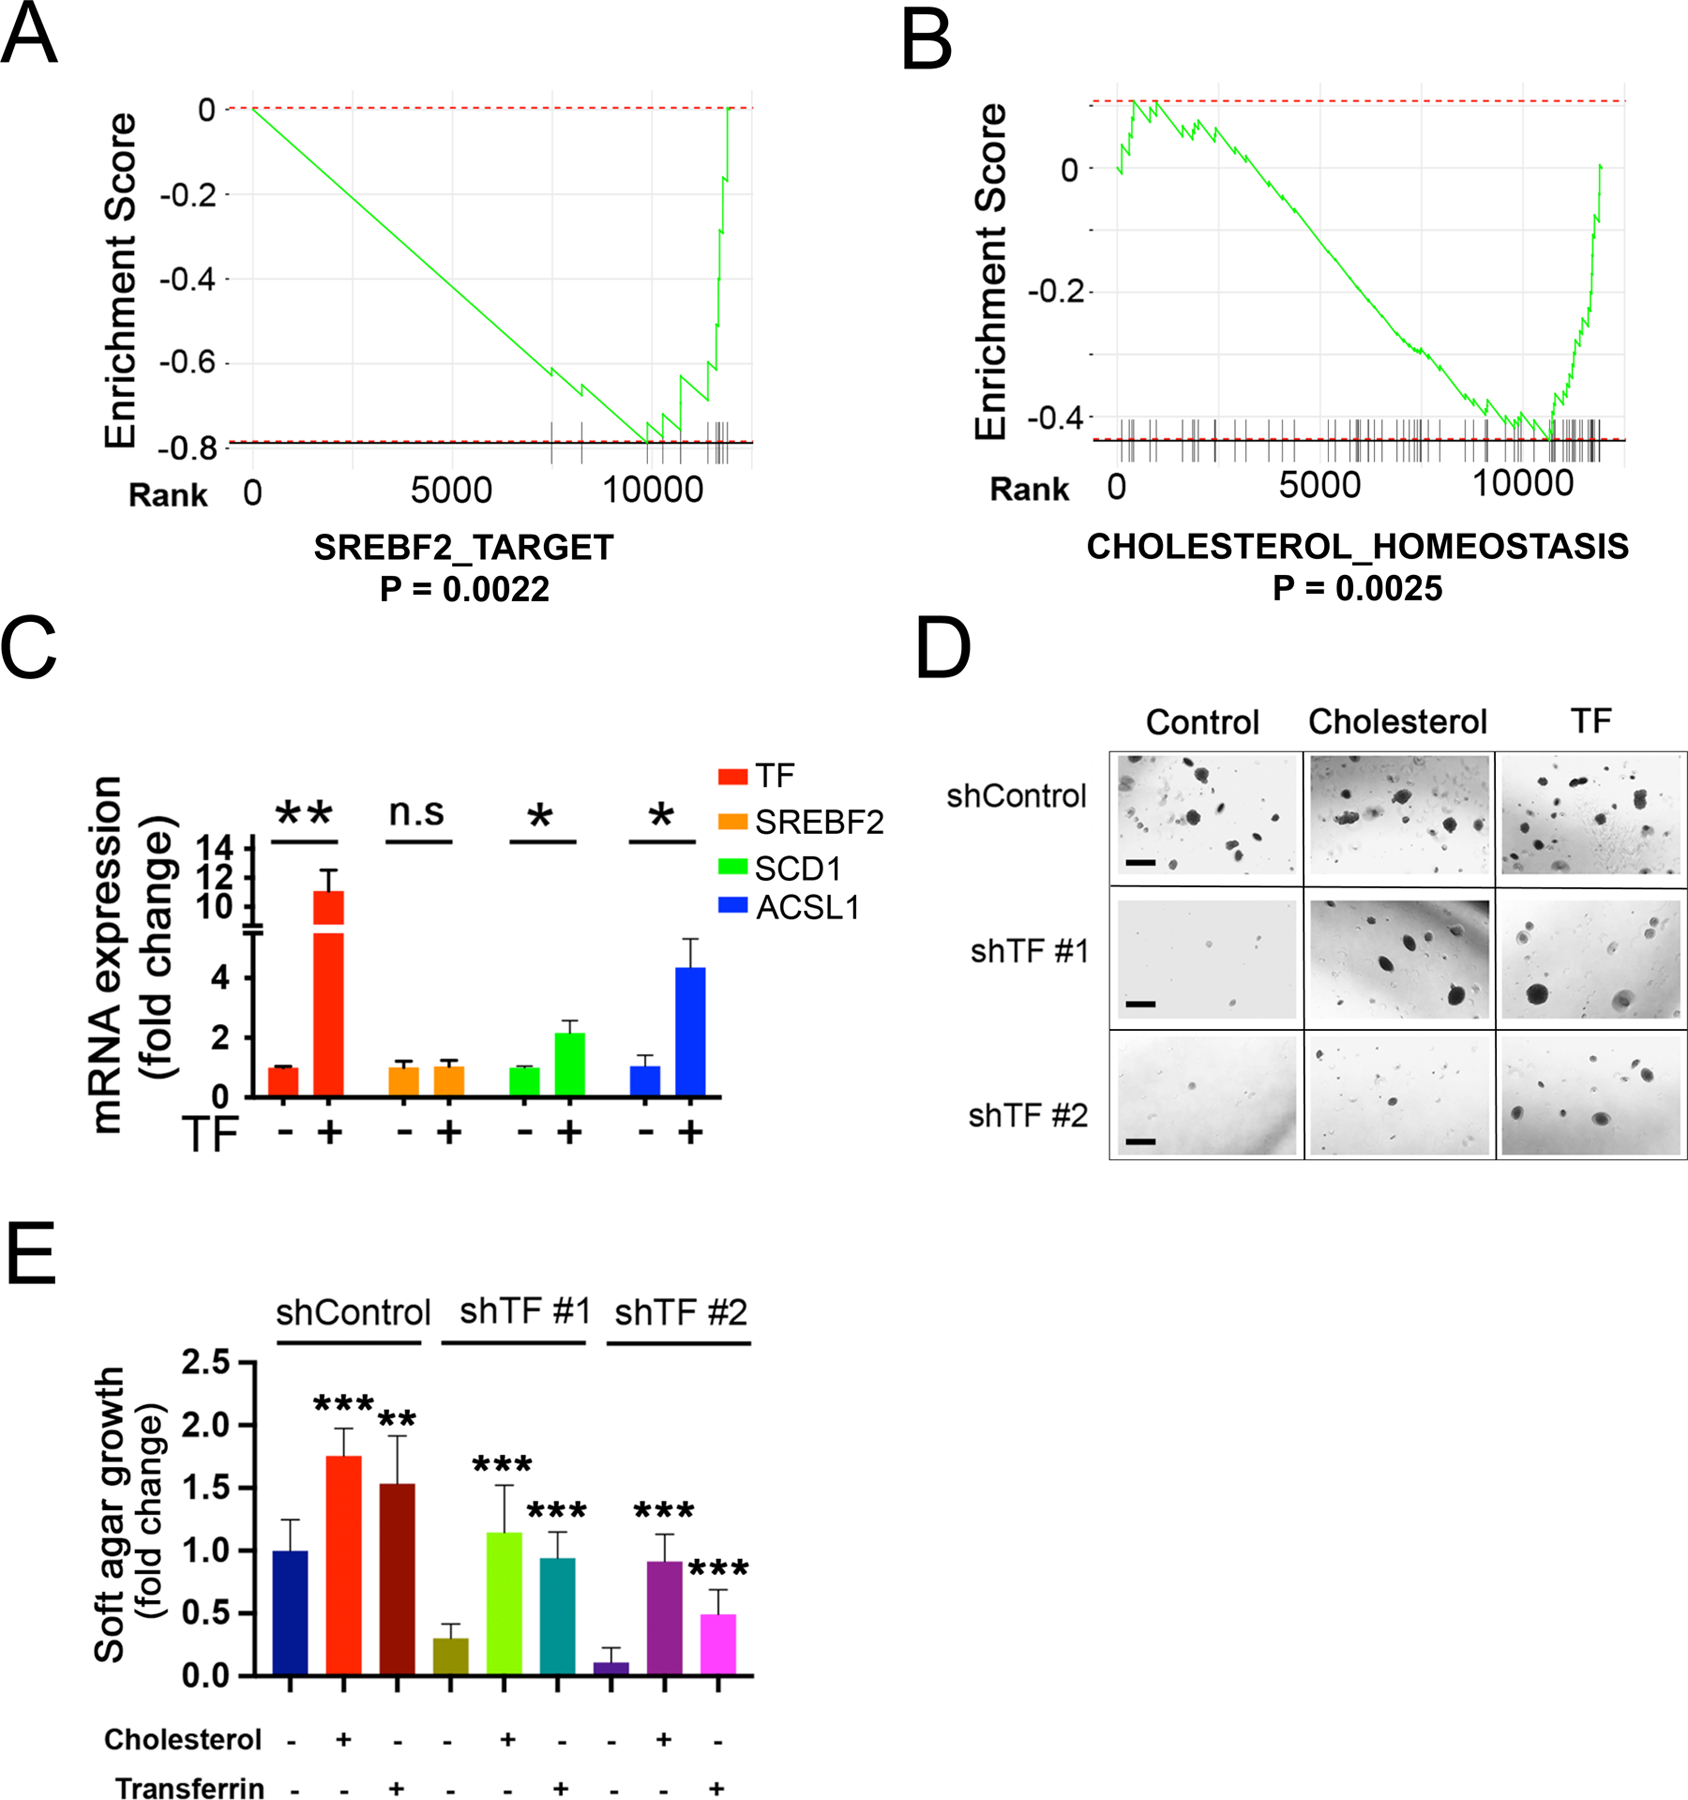
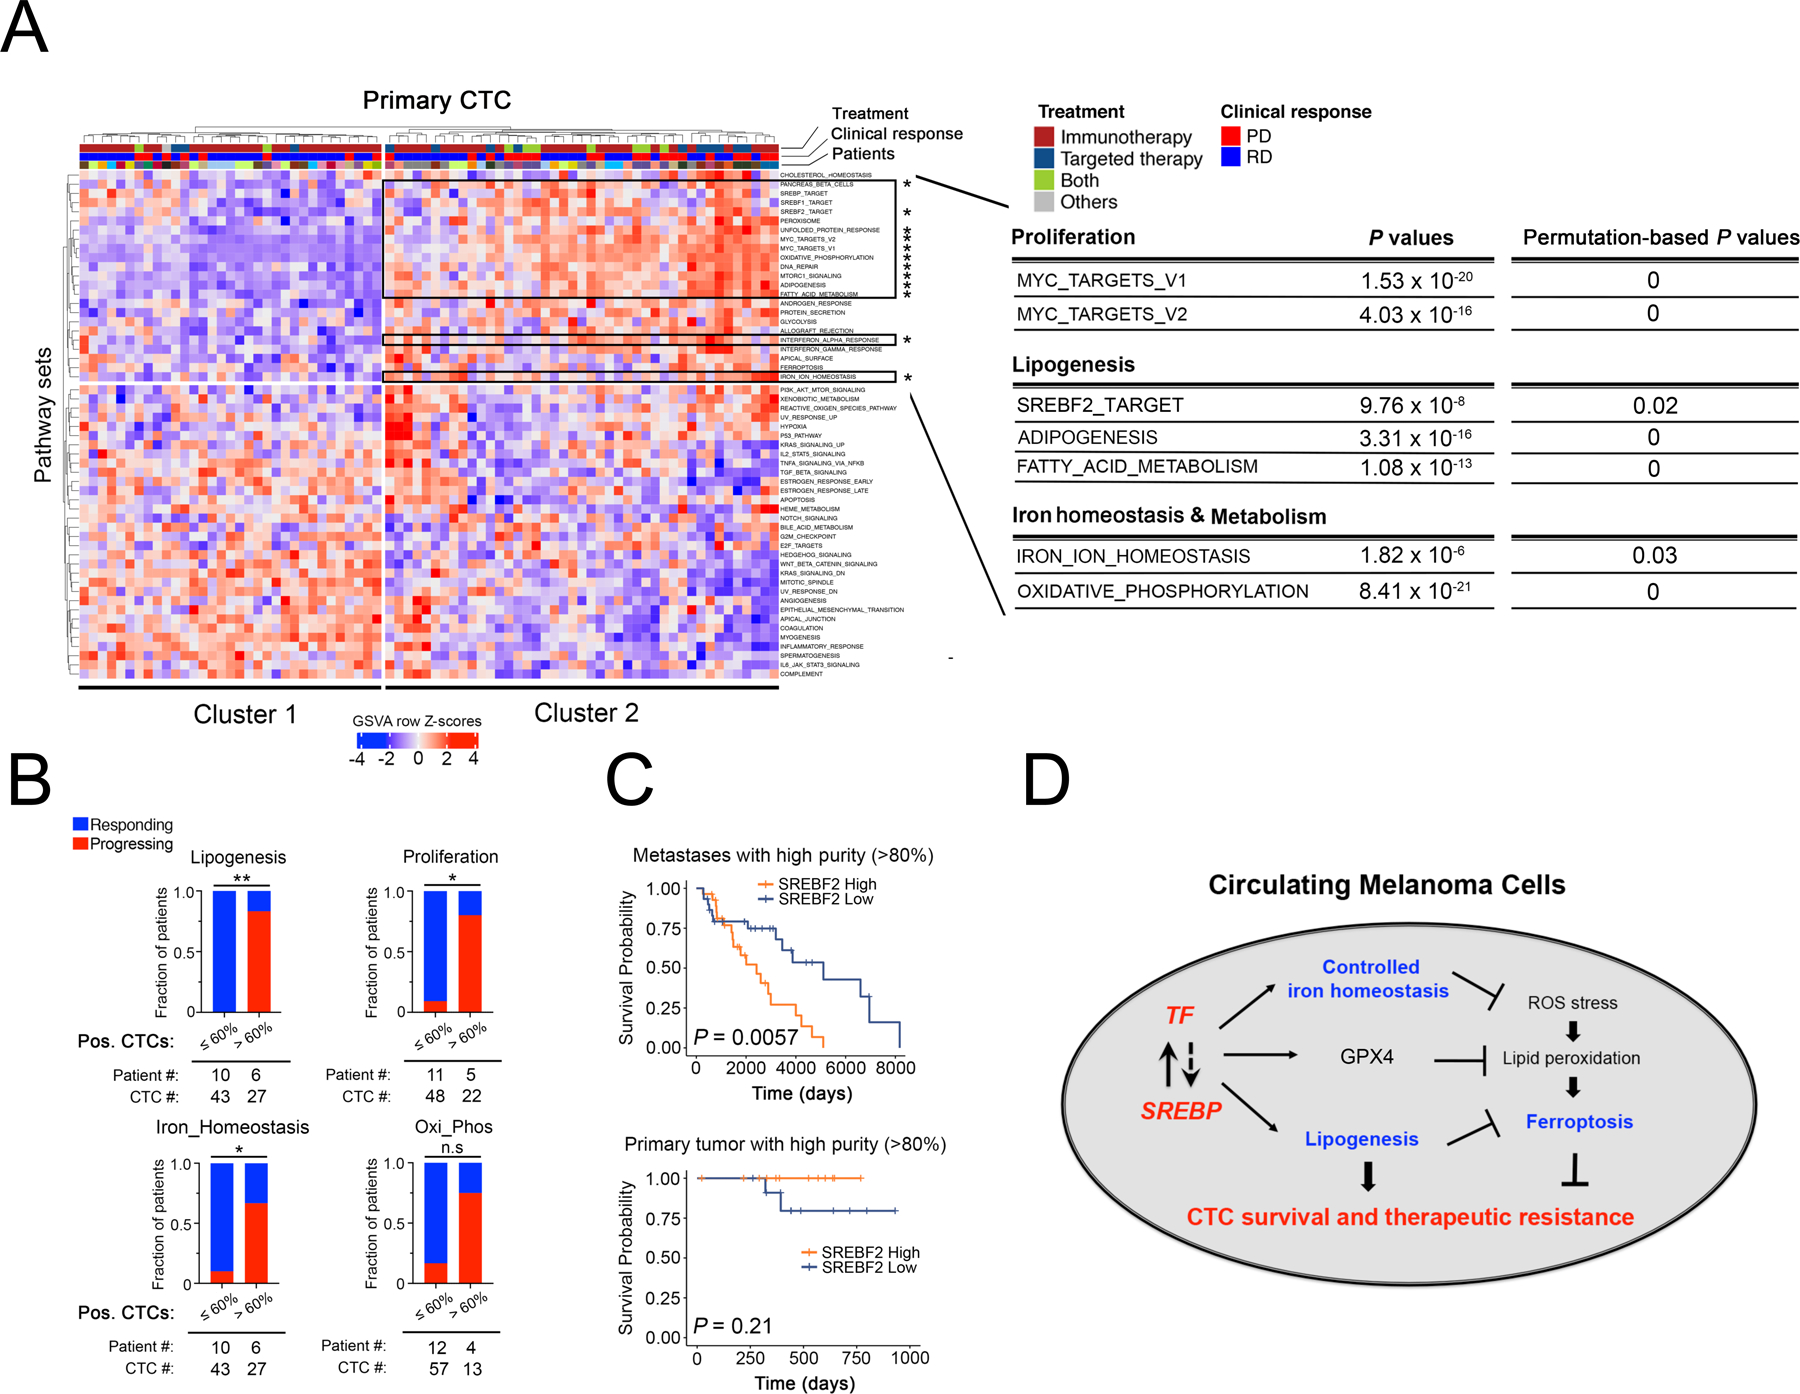
Circulating tumor cells (CTC) are shed by cancer into the bloodstream, where a viable subset overcomes oxidative stress to initiate metastasis. We show that single CTCs from patients with melanoma coordinately upregulate lipogenesis and iron homeostasis pathways. These are correlated with both intrinsic and acquired resistance to BRAF inhibitors across clonal cultures of BRAF-mutant CTCs. The lipogenesis regulator SREBP2 directly induces transcription of the iron carrier Transferrin (TF), reducing intracellular iron pools, reactive oxygen species, and lipid peroxidation, thereby conferring resistance to inducers of ferroptosis. Knockdown of endogenous TF impairs tumor formation by melanoma CTCs, and their tumorigenic defects are partially rescued by the lipophilic antioxidants ferrostatin-1 and vitamin E. In a prospective melanoma cohort, presence of CTCs with high lipogenic and iron metabolic RNA signatures is correlated with adverse clinical outcome, irrespective of treatment regimen. Thus, SREBP2-driven iron homeostatic pathways contribute to cancer progression, drug resistance, and metastasis. SIGNIFICANCE: Through single-cell analysis of primary and cultured melanoma CTCs, we have uncovered intrinsic cancer cell heterogeneity within lipogenic and iron homeostatic pathways that modulates resistance to BRAF inhibitors and to ferroptosis inducers. Activation of these pathways within CTCs is correlated with adverse clinical outcome, pointing to therapeutic opportunities.This article is highlighted in the In This Issue feature, p. 521.


Conflict of interest statement

Declaration of Competing Interests

Massachusetts General Hospital (MGH) has applied for patents regarding the CTC-iChip technology and CTC detection signatures. M.T., D.A.H., S.M. and D.T.T. are cofounders and have equity in Tell-Bio, which is not related to this work. D.T.T. has received consulting fees from EMD Millipore-Sigma, Ventana-Roche, Foundation Medicine Inc., and Merrimack pharmaceuticals. D.T.T. receives sponsored research support from ACD-Biotechne. D.T.T. is founder and has equity in PanTher Therapeutics and ROME Therapeutics, which are not related to this work. All authors interests were reviewed and are managed by MGH and Partners HealthCare in accordance with their conflict of interest policies.

Figures

Figure 1.
Figure 1.. Lipogenic and iron homeostasis signatures are elevated in melanoma patient-derived CTC lines.
(A) Characterization of ex vivo-cultures of melanoma Mel-167 CTCs. Upper panels: bright field images of suspension cultures at 2 weeks (left, scale bar: 100 μm) and 4 weeks (right, scale bar: 100 μm); Lower left: Representative immunofluorescence image of cultured CTCs co-stained for melanoma markers CSPG4 (red) and MLANA (green), with nuclear DAPI (blue). Scale bar: 10μm. Lower right: DNA sequencing identifies the heterozygous BRAFV600E mutation (T-> A at nucleotide 1799) in the cultured melanoma Mel-167 CTCs. (B) Melanoma Mel-167 CTCs are tumorigenic in mice. Primary tumors (Upper panel) and metastases (Lower panel) following subcutaneous and tail vein injection in NSG mice, respectively, of GFP-luciferase-tagged Mel-167 CTCs, monitored over 4 weeks using in vivo imaging (IVIS). (C) Intra-cardiac inoculation of GFP-luciferase-tagged Mel-167 CTCs into NSG mice leading to metastases in brain, lung and ovary. Representative images of GFP expressing tumor cells in tissue sections (Left panels, hatched circles, scale bar: 2mm) and immunohistochemical staining for melanosomes (Right panels, purple stain of individual melanoma cells marked by black arrows, with whole tissue section shown on the top right box; scale bar: 100 μm). (D-F) GSVA pathway enrichment box plots of (D) SREBP_TARGET, (E) FERROPTOSIS and (F) IRON_ION_HOMEOSTASIS, comparing melanoma CTC cell line samples (n = 13, including 5 distinct lines colored in pink and 8 sample repeats of these 5 lines in grey) with TCGA high purity primary melanomas (n = 45) (Primary), TCGA high purity metastatic melanomas (n = 129) (Metastases) and CCLE melanoma cell lines (n = 49). The mean GSVA enrichment scores were calculated for replicates of each CTC line. Pairwise comparisons between CTC lines and the other three categories were performed and statistical significance was assessed by two-sided Welch’s t-test. ****P < 0.0001; ***P < 0.001; ** P < 0.01; * P < 0.05. Curated pathway signature gene lists are found in Supplementary Table S2.
Figure 2.
Figure 2.. Clonal heterogeneity in SREBP-dependent lipogenesis as a mediator of intrinsic resistance to BRAF inhibitor among melanoma CTCs.
(A) Heatmap of BRAF inhibitor (BRAFi, vemurafenib) drug sensitivity performed on 13 single CTC-derived isogenic clones derived from one pretreatment blood sample from patient Mel-167 (tumor is BRAFV600E positive). Rows: left to right, relative cell viability with increasing vemurafenib concentrations: 0 (DMSO control), 0.1, 1 and 10 μM. Columns: top to bottom, isogenic CTC lines ranked from lowest to highest sensitivity to BRAFi. The 13 isogenic lines are divided into sensitive (n = 5) versus resistant (n = 8) groups based on their BRAFi sensitivity compared to the uncloned parental CTC culture. The isogenic lines have virtually identical mutational profiles compared to the primary tumor specimen, the parental Mel-167 CTC culture and with each other (refer to Figure S3A). (B) Vemurafenib sensitivity curves of two representative isogenic melanoma CTC lines, #1 (sensitive, blue line) and #13 (resistant, red line). Y-axis, relative cell viability; X-axis, drug concentrations in log(10) scale. Statistical significance is assessed by two-sided T test with unequal variance when comparing differences in cell viabilities between line #1 and line #13 treated with Vemurafenib at different concentrations: P = 0.0009 (1 μM) and P = 7.56 × 10⁻⁷ (10 μM). (C) Heatmap showing GSVA enrichment scores of pathways that were significantly different between BRAF inhibitor-sensitive (blue) and resistant (red) isogenic CTC lines. The statistical significance was defined as the gene sets with FDR-adjusted P values < 0.05 and absolute mean difference in GSVA scores between two groups > 0.25. P values were assessed by two-sided Welch’s t-test. The heatmap for all pathways is shown in Fig S3B. (D) Vemurafenib sensitivity of the BRAFV600E mutant CTCs following depletion SREBF1 and SREBF2 using siRNAs, compared with cells treated with control. Y-axis represents relative viability; X-axis represents drug concentration in μM, log10 scale. The knockdown efficiency against SREBF1 and SREBF2 are shown in Figure S3C. Statistical significance is assessed by two-sided T test with unequal variance. P = 0.0121 when comparing differences in cell viabilities between control and SREBF1&2-KD groups treated with 0.1 μM Vemurafenib. (E) Vemurafenib sensitivity of the BRAFV600E mutant CTCs with ectopic expression of a mature and activated form of SREBF2. Vector transfected cells are shown as controls. Y-axis represents relative viability; X-axis represents drug concentration in μM, log10 scale. The mRNA and protein level of SREBF2 overexpression is shown in Figures 3H and 3I, respectively. Statistical significance is assessed by two-sided T test with unequal variance and P values are generated when comparing cell viabilities between control and SREBF2 OE groups treated with Vemurafenib at different concentrations: P = 0.0022 (0.1 μM); P = 0.0417 (1 μM ); P = 0.0126 (5 μM); P = 2.11 ×10⁻⁶ (20 μM). (F) Heatmap representing soft agar colony numbers following treatment of Mel-167 CTCs with increasing concentrations of the BRAFi Vemurafenib and SREBP inhibitor Fatostatin, which show cooperative cell toxicity. The drug effect on colony size is shown in Figure S3E. (G) Elevated expression of SREBF1, SREBF2 and their downstream targets SCD and ACSL1 in parental Mel-167 CTC cultures (sensitive) and in two clones with acquired resistance to Vemurafenib (clones #1, #2). Y-axis: relative fold change of mRNAs (real time qPCR) shown between sensitive parental and the resistant lines (Actin internal control). Data was obtained from three biological repeats. Statistical significance is assessed by two-sided T test with unequal variance. P = 0.0001 for SREBF1; P = 0.0008 for SREBF2; P = 0.0009 for SCD; P = 0.0005 for ACSL1. **P < 0.001. (H) Heatmap representing soft agar clonogenic ability of the parental (sensitive) Mel-167 CTCs, compared with two Vemurafenib-resistant derivative clones (#1, #2), following treatment with increasing concentrations of the SREBP inhibitor Fatostatin. The Vemurafenib-resistant CTCs show increased sensitivity to Fatostatin. Statistical significance was assessed by two-sided T test with Welch’s correction (P = 0.0168, comparing resistant clone #1 to sensitive line; P = 0.0139 comparing resistant clone #2 to sensitive line). The drug effect on colony size is shown in Figure S3F. (I) Increased ratio of reduced to oxidized glutathione (GSH/GSSG), indicative of enhanced reductive capacity, in two Mel-167-CTC clonal lines with acquired resistance to Vemurafenib compared with the control sensitive cells. Statistical significance was assessed by two-sided T test with Welch’s correction. P = 0.0020, comparing Resist #1 to Sensitive and P = 0.0092 comparing Resist #2 to Sensitive line. ** P < 0.01.
Figure 3.
Figure 3.. Transferrin is a transcriptional target of SREBF2.
(A) Knockdown of SREBF1 (SREBF1-KD), SREBF2 (SREBF2-KD) or both (SREBF1&2-KD) in Mel-167 cultured CTCs, using antisense oligonucleotides (ASO), demonstrating both specificity for each individual gene and effective dual targeting. Y-axis, relative mRNA fold change normalized to Actin. Statistical significance was assessed by two-sided Welch’s t-tests. ** P < 0.01; *** P < 0.001; *** P < 0.0001. (B) Quantification of soft agar colony numbers formed by Mel-167 CTCs transfected with control, SREBF1-KD, SREBF2-KD or SREBF1&2-KD ASO sequences. Y-axis, relative colony number normalized to control. Statistical significance was assessed by two-sided Welch’s t-test. * P < 0.05; n.s, not significant. (C) Heatmap representation of SREBF2 ChIP-seq in Mel-167 CTCs, showing enrichment of SREBF2 binding sites within the transcriptional start sites (TSS) of genes comprising three pathways: SREBP_TARGET, FERROPTOSIS and IRON_ION_HOMEOSTASIS. For each pathway, the first two columns represent replicate experiments, and the third shows the input reads. The GSEA pathway enrichment plots and assessment of statistical significance of SREBF2 ChIP-seq are shown in Table S4. The heatmap color scale (Y-axis) represents the read intensities in bins per million mapped reads (BPM: set the maximum value at 3). (D) Venn diagram showing the top 10 genes at the intersection of SREBF2 bound promoters in CTCs and genes with increased expression in CTCs, compared with primary and metastatic melanoma (TCGA) and standard tumor-derived melanoma lines (CCLE). The mean fold change in individual gene expression is listed below the Venn diagram, with transferrin (TF) as the top hit. (E) Integrative Genomic Viewer (IGV) plot showing SREBF2 ChIP-seq peaks in the TF gene promoter region (framed in red). Two experimental repeats (rep 1, 2) are shown. Input genomic DNA serves as control. The scales in bins per million mapped reads (BPM) of peak window for each sample are shown in brackets, and the genomic structure of the TF gene is shown below the IGV plot. (F) In vivo binding of SREBF2 to the TF gene promoter, as shown by ChIP-qPCR analysis in Mel-167 melanoma CTCs. Top: Schematic representation of expected qPCR products (#1, 2, 3, 4) spanning regions of the TF gene promoter including those containing the two predicted SREBP binding sites (#2, 3), which are shown in blue and red (35). Bottom: ChIP-qPCR performed using anti-FLAG antibody to precipitate FLAG-SREBF2-DNA complexes. Y axis shows relative fold enrichment of TF gene promoter fragments (normalized to control IgG antibody), with strong in vivo binding of SREBF2 to fragments #2 and #3 that contain the SREBP consensus sequences, but not to neighboring fragments (#1 and #4) or to unrelated sequences (a, b). Data are normalized to 2% of total genomic DNA input. (G) Suppression of TF mRNA expression in Mel-167 CTCs, following treatment with ASOs targeting SREBF1 and SREBF2 alone or together, compared with control (see Figure 3A for knockdown efficiency and specificity), demonstrating that SREBF2 is the primary regulator of TF expression, with modest enhancement by combined SREBF1&2 KD. (H) Induction of TF mRNA expression by SREBF2 in Mel-167 CTCs, demonstrated by real-time q-PCR analysis, 48 hours following doxycycline-mediated inducible expression of SREBF2. SREBF2 also mediates a modest increase in SREBF1 mRNA. Data are normalized to actin. Y-axis shows relative fold change in SREBF2-expressing cells compared with uninduced controls. Statistical significance was assessed by two-sided Welch’s t-test. P = 0.003 for TF; P = 0.0002 for SREBF2; P = 0.0009 for SREBF1. **P < 0.01; ***P < 0.001. (I) Induction of TF protein by doxycycline-inducible FLAG-tagged SREBF2, quantified by Western blot analysis in Mel-167 CTCs. Actin is shown as loading control.
Figure 4.
Figure 4.. Depletion of Transferrin impairs tumor formation.
(A) Expression of TF transcripts within single melanoma CTCs freshly isolated from patients with metastatic melanoma by microfluidic negative depletion platform (n=76 single CTCs from 22 patients), or in CTCs that were incubated in culture medium for <8 weeks after microfluidic isolation. Short term culture ensures collection of viable CTCs with intact RNA, and precedes the initiation of in vitro proliferation (n=20 single CTCs). The fresh and cultured single CTCs are compared with contaminating leukocytes (WBC), from healthy donor blood identically processed through the microfluidic chip (WBC; n=6), Y axis, log2(TPM+1). TPM, Transcripts Per Million. (B) Modest suppression of in vitro proliferation by Mel-167 CTCs, following TF-knockdown mediated by either of two independent shRNA constructs (knockdown efficacy shown in Fig S7A). compared with cells transfected with shControl. Two-sided Welch’s t-test was employed to assess the differences in proliferation rates between shTF and shControl at day 4. Y-axis: relative fold change normalized to day 0. *P < 0.05. (C) Reduction in soft agar colony formation by Mel-167 melanoma CTCs, following TF knockdown using two independent shRNA constructs, versus shControl (see Figure S7A). Colonies were quantified by automated imaging at 4 weeks. Statistical significance from four independent experiments was assessed by two-sided Welch’s t-test. ** P < 0.01. Y-axis, relative fold change normalized to shControl. (D) Suppression of subcutaneous melanoma formation by Mel-167 CTCs, following TF-Knockdown. Tumor volume following subcutaneous inoculation of tumor cells was quantified using 4 mice per experimental condition. Statistical significance was assessed by two-sided Welch’s t-test. **P < 0.01; ***P < 0.001. (E-F) Abrogation of intravenous (tail vein) metastasis by Mel-167 melanoma CTCs following TF-Knockdown. (E) Metastatic burden was monitored in GFP-luciferase tagged CTCs using live imaging (IVIS), with representative images shown at time points 0, 6 and 9 weeks post injection. CTCs were infected prior to injection with either shTF or scrambled shRNA controls. (F) Time-course showing the quantification of metastatic tumors by in vivo luciferase imaging. Y-axis: averaged total flux of luciferase signal; shTF (n=4) and shControl (n=4) mice. Statistical significance was assessed by two-sided Welch’s t-test: P = 0.047 for week 8 comparisons and P = 0.046 for week 9 comparisons. * P < 0.05. Tissue-specific histological quantitation of metastases (lungs, liver, kidneys) is shown in Figures S7D–F.
Figure 5.
Figure 5.. Transferrin modulates ferroptotic cell death.
(A) GSEA pathway enrichment plot showing significant downregulation of “REACTIVE_OXYGEN_SPECIES” (ROS) pathway following TF-KD in Mel-167 melanoma CTCs, compared to shControl. (B) Increased intracellular ROS in Mel-167 melanoma CTCs following TF-KD, using two independent shRNA constructs (#1, #2), compared with scrambled construct (shControl). ROS was quantified by flow cytometric analysis with a fluorescent ROS probe and the geometric mean of fluorescence signal was calculated for each group. The differences between the two groups were assessed by two-sided Welch’s t-test. statistical significance: P = 0.0028 for shTF#1 compared to shControl; P = 0.0104 for shTF#2 compared to shControl. ** P < 0.01; *P < 0.05. (C) Quantification of lipid peroxidation levels by flow cytometry in Mel-167 CTCs following knockdown of TF (shTF#1), compared with shControl cells. The increase in lipid peroxidation induced by TF-KD is abolished either by the addition of the iron chelator deferoxamine (DFO; 50 μM with preincubation for 12 hours before flow cytometric assay), or by expression of TF ALT cDNA (rescue), a synthetic construct in which mutation of three 3rd position non-coding nucleotides renders TF resistant to targeting by shTF#1 without affecting expression levels (see Figure S8A, S8B). Lipid peroxidation is measured using BODIPY™ 581/591 C11 molecular sensor, and the fraction of cells positive for lipid peroxidation were calculated and data normalized to shControl. Y axis represents fold change. Statistical significance was assessed by two-sided Welch’s t-test. ** P < 0.01; *** P < 0.001; ****P < 0.0001. (D) TF-KD enhances Mel-167 melanoma CTC cytotoxicity by the ferroptosis inducer RSL3. TF-KD was achieved using two different shRNAs, scrambled shControl. Y axis represents relative cell viability. X axis represents drug concentrations (μM) in log10 scale. Statistical significance was assessed by two-sided Welch’s t-test. When shTF#1 is compared to shControl: 1 μM, P = 0.0001; 2.5 μM, P = 0020. When shTF#2 is compared to shControl: 1 μM, P = 7.69 × 10⁻⁵; 2.5 μM, P = 0021; 5 μM, P = 0179. (E) TF-KD increases sensitivity to vemurafenib in BRAFV600E-mutant melanoma Mel-167 CTCs. TF-KD was achieved using two different shRNAs and compared with scrambled shControl. Y axis represents relative cell viability. X axis represents drug concentrations (μM) in log10 scale. Statistical significance was assessed by two-sided Welch’s t-test. When shTF#1 is compared to shControl at different drug concentrations: 0.1 μM, P = 0.0246; 1 μM, P = 2.07 × 10⁻⁵; 2.5 μM, P = 2.14 × 10⁻⁶; 10 μM, P = 0.0001; 20 μM, P = 0.0007. When shTF#2 is compared to shControl: 0.01 μM, P = 0.0010; 0.1 μM, P = 0.0004; 1 μM, P = 9.38 × 10⁻⁶; 2.5 μM, P = 8.70 × 10⁻⁵; 10 μM, P = 0.0006; 20 μM, P = 0.0011. (F) Reduced ratio of GSH/GSSG in TF-KD Mel-167, compared with vector Control. A synthetic TF ALT cDNA, resistant to shTF#1 knockdown, rescues the phenotype (see Figure S8A, S8B). Y axis, relative ratio between GSH/GSSG levels. Data are calculated based on three independent biological repeats and statistical significance was assessed by two-sided Welch’s t-test. P = 0.0216, comparing shTF#1 to Control and P = 0.0047 comparing shTF#1 + Rescue to shTF #1. * P < 0.05; ** P < 0.01. (G) Suppression of soft agar colony formation by Mel-167 CTCs following TF-KD by two different shRNAs (Scrambled shRNA control). The clonogenic phenotype is rescued by two lipophilic anti-oxidants, Ferrostatin-1 (0.5 μM) and Vitamin E (20 μM). Representative images for each condition are shown. Scale bar: 500 μm. (H) Quantitation of colony formation in soft agar shown in Figure 5F. Differences between the two groups were assessed by two-sided Welch’s t-test. Statistical significance: ** P < 0.01; *** P < 0.001. (I) Quantitation of intracellular labile free iron in Mel-167 CTCs, using flow cytometry measurements of a fluorescent reporter (Goryo chemical). The normalized geometric mean of fluorescence intensity was calculated in CTCs expressing doxycline-inducible TF after 48 hours of dox treatment. Statistical significance was assessed by two-sided Welch’s t-test. ** P < 0.01. Similar results using Mel182–2 CTCs are shown in Figure S8N.
Figure 6.
Figure 6.. Transferrin expression modulates SREBP targets.
(A-B) Suppression of lipogenic pathways following TF-KD in Mel-167 melanoma CTCs. GSEA pathway enrichment plot showing significant downregulation of (A) “SREBP_2_TARGET” and (B) “CHOLESTEROL_HOMEOSTASIS”, in TF-KD CTCs, compared to shControl. (C) Induction of downstream lipogenic effectors, following doxycycline-inducible expression of TF in Mel-167 CTCs (TF was induced within 96 hours post virus infection). Expression of SREBF2 mRNA and its downstream targets genes SCD and ACSL1 are shown (real time qPCR). Cells were grown under reduced nutrient conditions (RMPI with 2% B27) to sensitize SREBF2 activity. Y-axis: relative fold change in TF-overexpressing CTCs compared with control without dox treatment. Actin was used for internal normalization. Data were obtained from three independent biological repeats. Statistical significance was assessed by two-sided Welch’s t-test. P = 0.007 for TF; P = 0.868 for SREBF2; P = 0.039 for SCD; P = 0.017 for ACSL1. *P < 0.05; **P < 0.01. (D-E) Rescue by exogenous cholesterol of soft agar colony formation defect in Me-167 melanoma CTCs following TF-KD. with two different shRNAs Scrambled shRNA was used as control (shControl). Cultures were incubated with either 10μg/ml cholesterol or 10 μg/ml recombinant TF protein (control). Representative images are shown in (D) (Scale bar, 500μm), quantification of colonies is shown in (E). The differences between two groups were assessed by two-sided Welch’s t-test. Statistical significance: ** P < 0.001; *** P < 0.0001.
Figure 7.
Figure 7.. Coordinated upregulation of lipogenesis and iron homeostasis gene expression in patient-derived melanoma CTCs is correlated with poor clinical outcome.
(A) Heatmap showing hierarchical clustering (Euclidean distance with complete linkage) of GSVA enrichment scores of pathways across 76 primary single CTCs obtained from 22 patients with metastatic melanoma (CTC lineage confirmed by expression of at least one melanoma-specific marker (24); see Figure S10 for CTC validation). The first row indicates treatment information of patients, from whom CTCs were isolated, that receive Immunotherapy (colored in dark red), Targeted therapy (dark blue), Both (Immunotherapy + Targeted therapy) or Others (grey). The second row indicates responding (blue) versus progressing (red) patients, and the third row indicates individual patients with color codes. The upper right block framed in black shows the subset of CTC samples (Cluster 2) with significantly enriched pathways marked by asterisks. Selected pathways upregulated in Cluster 2 CTC group vs Cluster 1 CTC group are listed on the right (Mean difference in GSVA enrichment scores between C1 and C2 > 0.20, FDR-adjusted P value < 0.05). Permutation-based P values were calculated as “the number of background P values lower than the observed P values from Figure 7A” divided by “the number of permutations which is 1,000”, as shown on the top right. GSVA scores of each pathway and expression levels of all genes within each selected pathway were listed in Supplementary Table S6. (B) Stacked bar graphs showing the fraction of patients with either responsive disease (RD in blue) or progressing disease (PD in red), whose CTC populations were stratified by low (≤60%) or high (>60%) percentages of CTCs expressing markers of “Lipogenesis (SREBP_2_TARGET)” (upper left), “Proliferation (MYC_TARGETS_V2)” (upper right), “Iron_Homeostasis (Iron_Ion_Homeostasis)” (lower left), “Oxi_Phos (OXIDATIVE_PHOSPHORYLATION)”(lower right), using GSVA row Z score > 0 as a cutoff for each pathway signature. Only samples with 2 or more CTCs were included. Fisher’s exact test was performed to assess the association between CTC pathway signature expression and clinical outcome. * P < 0.05; ** P < 0.01. Clinical assessment of response or progression was ascertained after either immunotherapies or targeted therapies with a median time of 74 days following CTC collection. (C) Kaplan-Meier plots of disease-specific survival in patients with either metastatic (upper panel) or primary melanoma (lower panel), classified according to SREBF2 mRNA expression. TCGA SKCM high purity melanoma samples (>80% tumor composition) were divided into “SREBF2 high” (SREBF2 mRNA expression higher than 75th percentile, orange) and “SREBF2 low” (SREBF2 mRNA expression lower than 25th percentile, blue) groups. Kaplan-Meier curves were plotted for disease specific survival (DSS) and P values were calculated using log-rank test. Y-axis, disease-specific survival probability; X-axis, time in days. (D) Schematic model for coordinated expression of lipogenic and iron homeostatic pathways. The master lipogenic regulator SREBF2 directly induces expression of the iron carrier Transferrin, while TF mediated activation of SREBP signaling appears to be indirect. Increased intracellular TF reduces iron levels, ROS stress and lipid peroxidation, all of which serve to suppress ferroptosis and enhance CTC survival and drug resistance. Increased lipogenesis mediated by SREBP, including expression of the SREBF2 target GPX4 (Figure 3C) similarly reduces ferroptosis. This coordinated cross-talk mechanism between lipogenic and iron homeostatic pathways contributes to CTC-mediated tumorigenesis and therapeutic resistance.

References

    1. Chapman PB, Hauschild A, Robert C, Haanen JB, Ascierto P, Larkin J, et al. Improved survival with vemurafenib in melanoma with BRAF V600E mutation. N Engl J Med 2011;364(26):2507–16 doi 10.1056/NEJMoa1103782. - DOI - PMC - PubMed
    1. Flaherty KT, Robert C, Hersey P, Nathan P, Garbe C, Milhem M, et al. Improved survival with MEK inhibition in BRAF-mutated melanoma. N Engl J Med 2012;367(2):107–14 doi 10.1056/NEJMoa1203421. - DOI - PubMed
    1. Hauschild A, Grob JJ, Demidov LV, Jouary T, Gutzmer R, Millward M, et al. Dabrafenib in BRAF-mutated metastatic melanoma: a multicentre, open-label, phase 3 randomised controlled trial. Lancet 2012;380(9839):358–65 doi 10.1016/S0140-6736(12)60868-X. - DOI - PubMed
    1. Hodi FS, O’Day SJ, McDermott DF, Weber RW, Sosman JA, Haanen JB, et al. Improved survival with ipilimumab in patients with metastatic melanoma. N Engl J Med 2010;363(8):711–23 doi 10.1056/NEJMoa1003466. - DOI - PMC - PubMed
    1. Robert C, Thomas L, Bondarenko I, O’Day S, Weber J, Garbe C, et al. Ipilimumab plus dacarbazine for previously untreated metastatic melanoma. N Engl J Med 2011;364(26):2517–26 doi 10.1056/NEJMoa1104621. - DOI - PubMed

Publication types

MeSH terms