

Distinct Cytokine Profiles Correlate with Disease Severity and Outcome in Longitudinal Studies of Acute Hepatitis B Virus and Hepatitis D Virus Infection in Chimpanzees
- PMID: 33203756
- PMCID: PMC7683399
- DOI: 10.1128/mBio.02580-20
Distinct Cytokine Profiles Correlate with Disease Severity and Outcome in Longitudinal Studies of Acute Hepatitis B Virus and Hepatitis D Virus Infection in Chimpanzees
Abstract
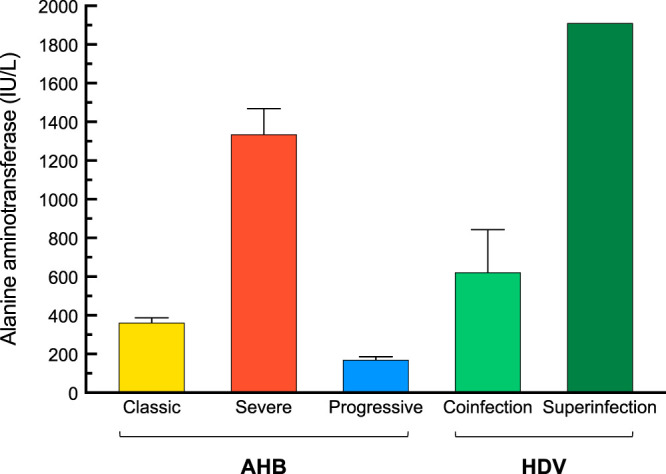
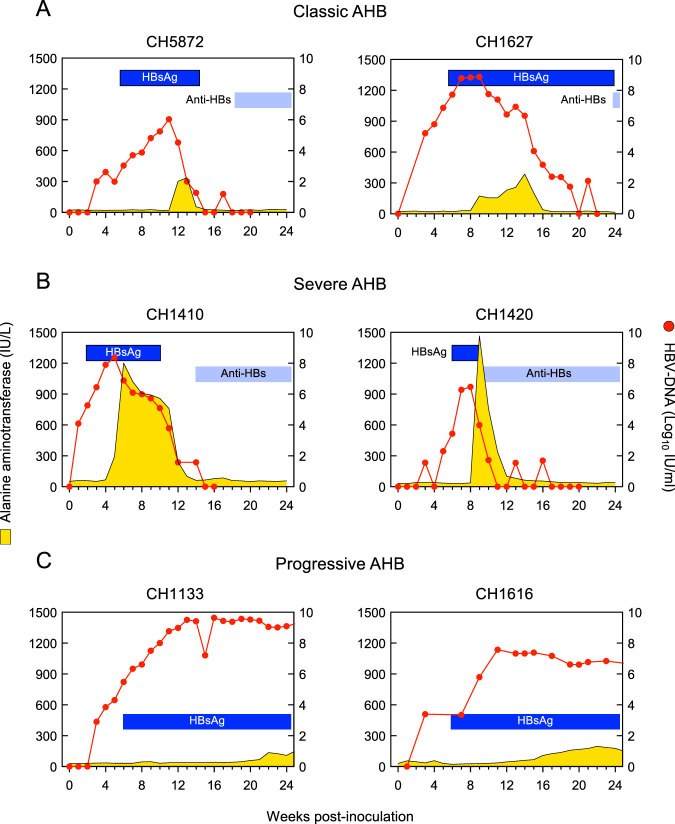
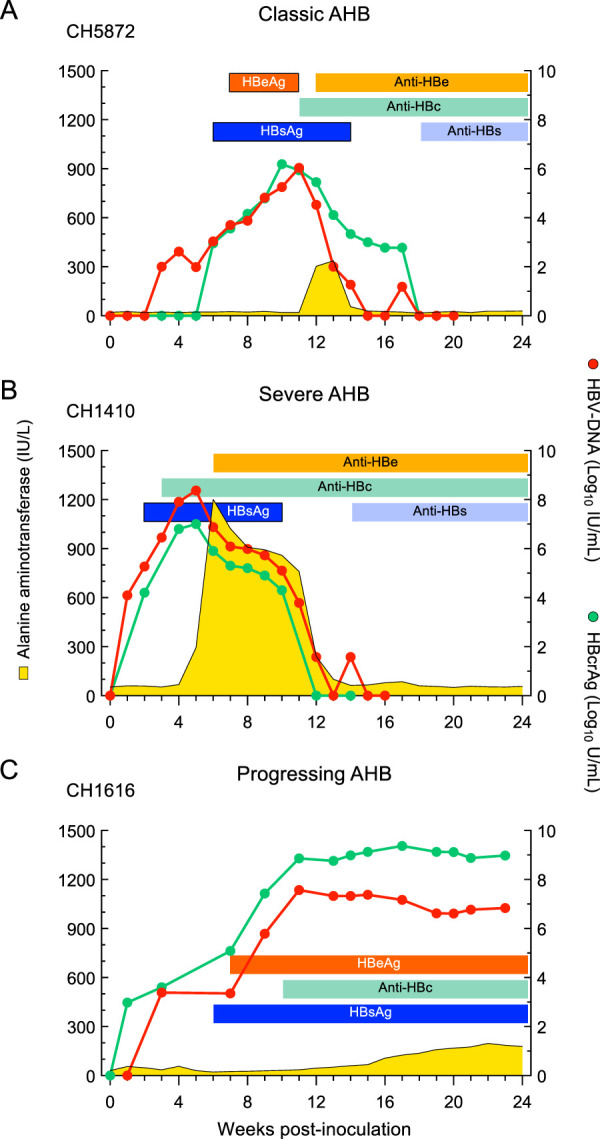
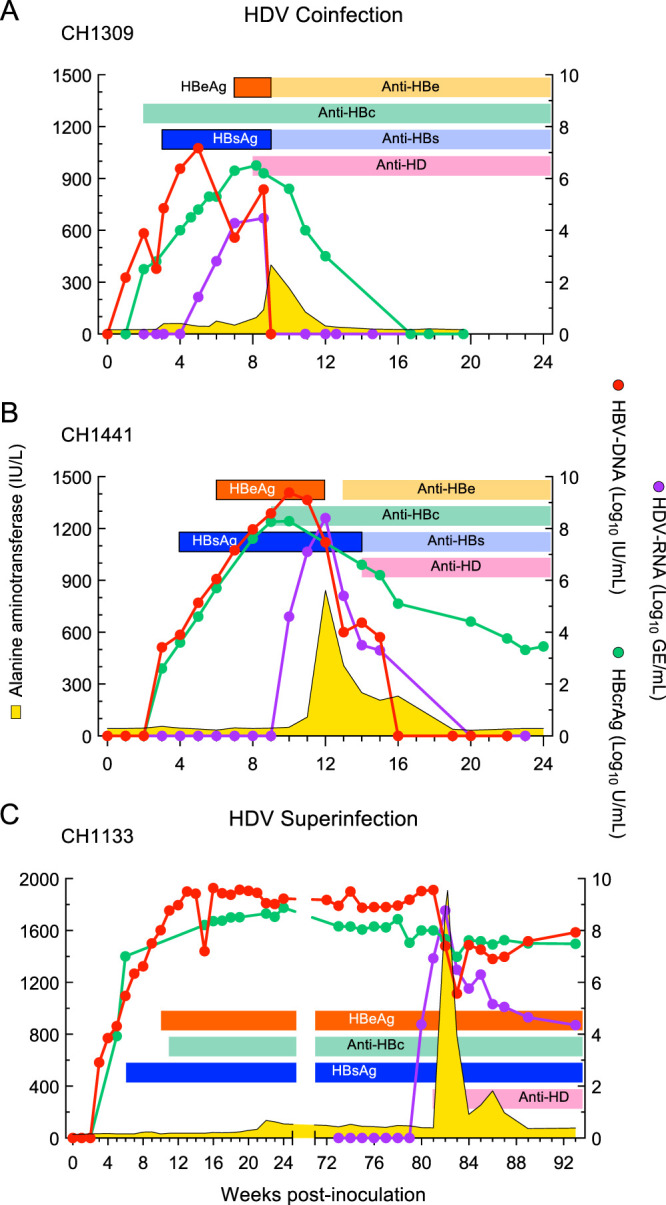
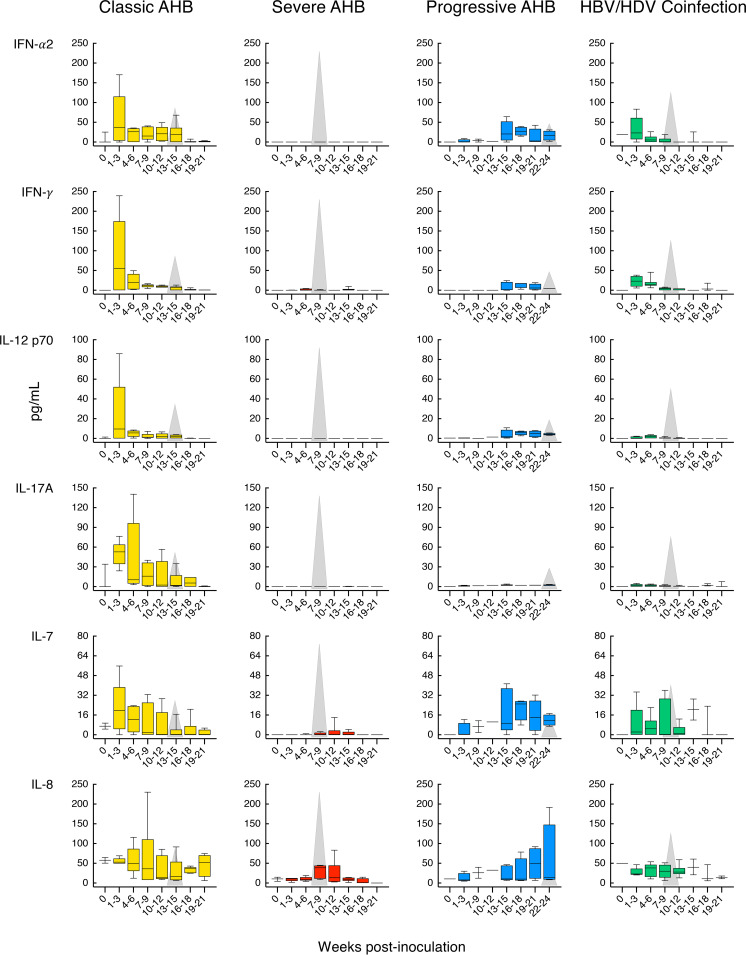
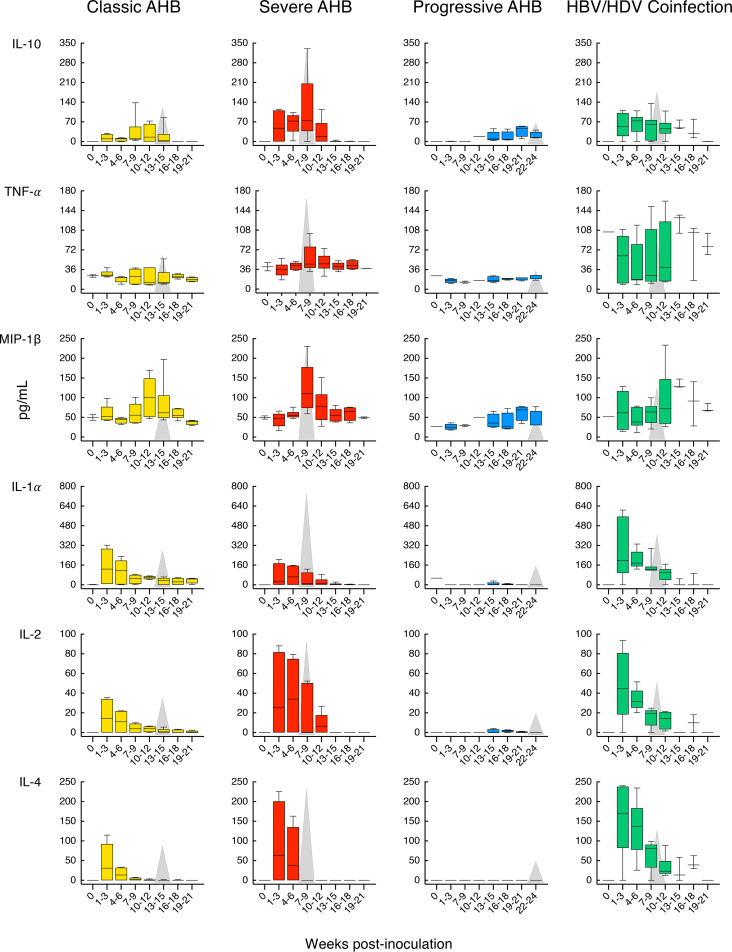
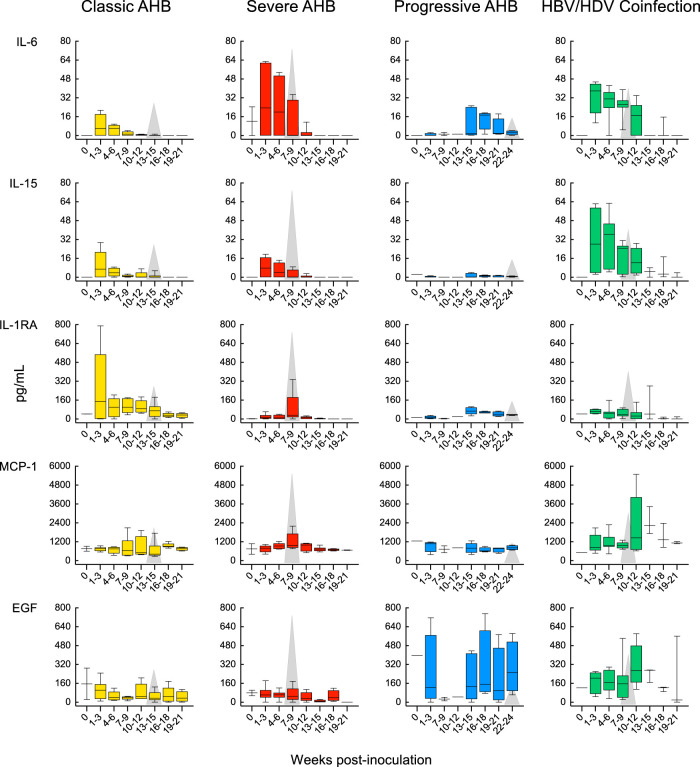
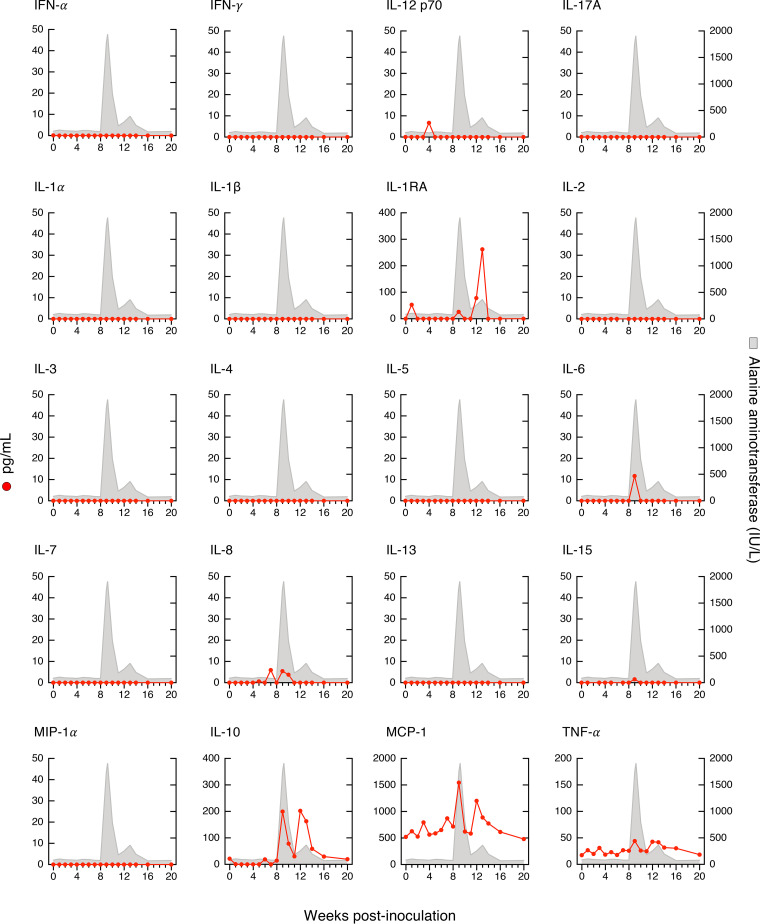
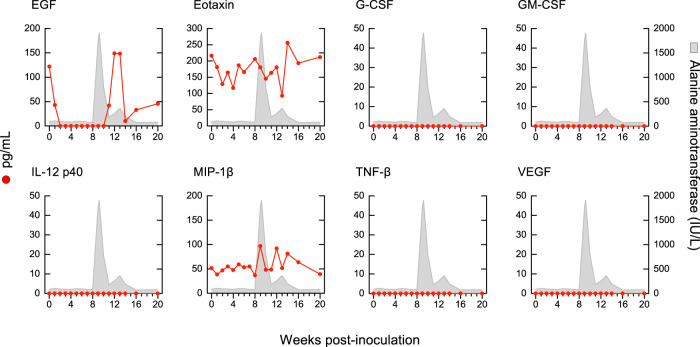
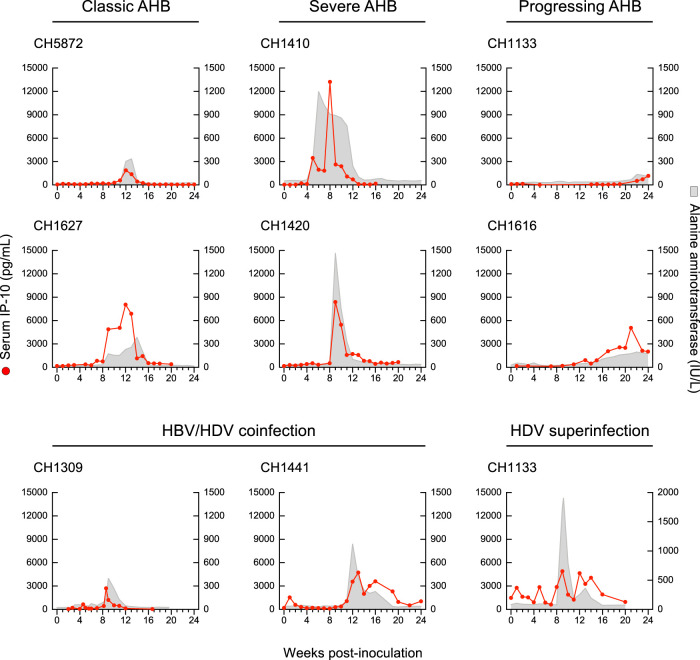
Historical studies conducted in chimpanzees gave us the opportunity to investigate the basis for the different severities of liver damage and disease outcome associated with infection with wild-type hepatitis B virus (HBV) versus a precore HBV mutant, HBV/hepatitis D virus (HDV) coinfection, and HDV superinfection. Weekly samples from 9 chimpanzees were studied for immune responses by measuring plasma levels of 29 cytokines in parallel with alanine aminotransferase (ALT) levels and viral kinetics. Comparison of classic acute hepatitis B (AHB) with severe or progressive AHB and HBV/HDV coinfection or superinfection identified distinct cytokine profiles. Classic AHB (mean ALT peak, 362 IU/liter) correlated with an early and significant induction of interferon alpha-2 (IFN-α2), IFN-γ, interleukin-12 p70 (IL-12 p70), and IL-17A. In contrast, these cytokines were virtually undetectable in severe AHB (mean ALT peak, 1,335 IU/liter), characterized by significant elevations of IL-10, tumor necrosis factor alpha (TNF-α), and MIP-1β. In progressive AHB (mean ALT peak, 166 IU/liter), there was a delayed and lower-magnitude induction of cytokines. The ALT peak was also delayed (mean, 23.5 weeks) compared to those of classic (13.5 weeks) and severe AHB (7.5 weeks). HBV/HDV coinfection correlated with significantly lower levels of IFN-α2, IFN-γ, and IL-17A, associated with the presence of multiple proinflammatory cytokines, including IL-1α, IL-1β, IL-2, IL-4, IL-5, IL-6, IL-10, and IL-15. Conversely, HDV superinfection induced the highest ALT peak (1,910 IU/liter) and was associated with a general suppression of cytokines. Our data demonstrate that the most severe liver damage, caused by an HBV precore mutant and HDV, correlated with restricted cytokine expression and lack of Th1 response, raising the question of whether these viruses are directly cytopathic.IMPORTANCE Studies performed in chimpanzees at the National Institutes of Health (NIH) demonstrated a significant difference in ALT levels during acute hepatitis of different viral etiologies, with a hierarchy in the extent of liver damage according to the infecting virus: the highest level was in HDV superinfection, followed by infection with a precore HBV mutant, HBV/HDV coinfection, and, lastly, wild-type HBV infection. Our study demonstrates that both the virus and host are important in disease pathogenesis and offers new insights into their roles. We found that distinct cytokine profiles were associated with disease severity and clinical outcome. In particular, resolution of classic acute hepatitis B (AHB) correlated with a predominant Th1 response, whereas HBV/HDV coinfection showed a predominant proinflammatory response. Severe AHB and HDV superinfection showed a restricted cytokine profile and no evidence of Th1 response. The lack of cytokines associated with adaptive T-cell responses toward the precore HBV mutant and HDV superinfection argues in favor of a direct cytopathic effect of these viruses.
Keywords: chimpanzees; cytokines; hepatitis; hepatitis B virus; hepatitis D virus; pathogenesis; precore HBV mutant; viral kinetics; wild-type HBV.
Figures
Similar articles
-
Distinct disease features in chimpanzees infected with a precore HBV mutant associated with acute liver failure in humans.PLoS Pathog. 2020 Aug 31;16(8):e1008793. doi: 10.1371/journal.ppat.1008793. eCollection 2020 Aug. PLoS Pathog. 2020. PMID: 32866189 Free PMC article.
-
The balance of type 1 and type 2 immune responses in the contexts of hepatitis B infection and hepatitis D infection.J Gastroenterol Hepatol. 2019 Apr;34(4):764-775. doi: 10.1111/jgh.14617. Epub 2019 Feb 25. J Gastroenterol Hepatol. 2019. PMID: 30695096 Free PMC article.
-
A new HDV mouse model identifies mitochondrial antiviral signaling protein (MAVS) as a key player in IFN-β induction.J Hepatol. 2017 Oct;67(4):669-679. doi: 10.1016/j.jhep.2017.05.010. Epub 2017 May 18. J Hepatol. 2017. PMID: 28527664
-
Hepatitis D virus coinfection and superinfection.Cold Spring Harb Perspect Med. 2014 Nov 3;4(11):a021550. doi: 10.1101/cshperspect.a021550. Cold Spring Harb Perspect Med. 2014. PMID: 25368018 Free PMC article. Review.
-
Clinical features of hepatitis D.Semin Liver Dis. 2012 Aug;32(3):228-36. doi: 10.1055/s-0032-1323628. Epub 2012 Aug 29. Semin Liver Dis. 2012. PMID: 22932971 Review.
Cited by
-
In Vivo Models of HDV Infection: Is Humanizing NTCP Enough?Viruses. 2021 Mar 31;13(4):588. doi: 10.3390/v13040588. Viruses. 2021. PMID: 33807170 Free PMC article. Review.
-
Human hepatitis D virus-specific T cell epitopes.JHEP Rep. 2021 Apr 23;3(4):100294. doi: 10.1016/j.jhepr.2021.100294. eCollection 2021 Aug. JHEP Rep. 2021. PMID: 34308324 Free PMC article. Review.
-
Systemic cytokine and viral antigen-specific responses in hepatitis D virus RNA positive versus HDV RNA negative patients.Front Med (Lausanne). 2023 Oct 9;10:1125139. doi: 10.3389/fmed.2023.1125139. eCollection 2023. Front Med (Lausanne). 2023. PMID: 37877022 Free PMC article.
-
Current Treatment Regimens and Promising Molecular Therapies for Chronic Hepatobiliary Diseases.Biomolecules. 2025 Jan 14;15(1):121. doi: 10.3390/biom15010121. Biomolecules. 2025. PMID: 39858515 Free PMC article. Review.
-
Liver-Resident Bystander CD8+ T Cells Contribute to Liver Disease Pathogenesis in Chronic Hepatitis D Virus Infection.Gastroenterology. 2021 Nov;161(5):1567-1583.e9. doi: 10.1053/j.gastro.2021.07.027. Epub 2021 Jul 21. Gastroenterology. 2021. PMID: 34302839 Free PMC article.
References
Publication types
MeSH terms
Substances
LinkOut - more resources
Full Text Sources
Medical
