. 2020 Dec;30(12):1846-1855.
doi: 10.1101/gr.261503.120. Epub 2020 Nov 17.

Pooled protein tagging, cellular imaging, and in situ sequencing for monitoring drug action in real time

Affiliations

Pooled protein tagging, cellular imaging, and in situ sequencing for monitoring drug action in real time

Andreas Reicher et al. Genome Res. 2020 Dec.

Abstract

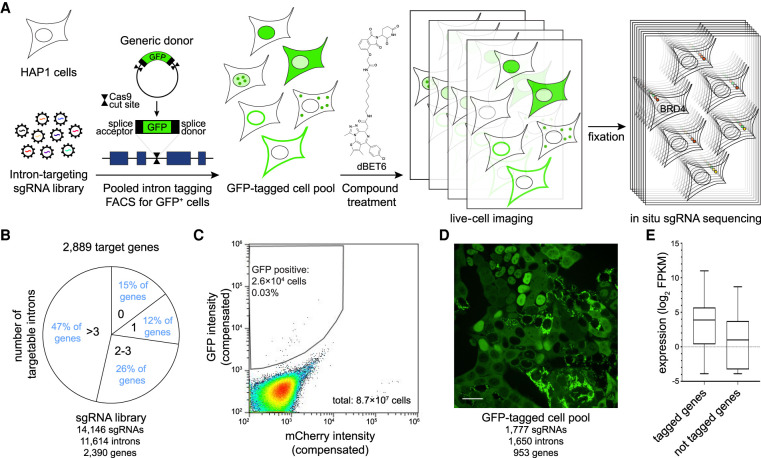
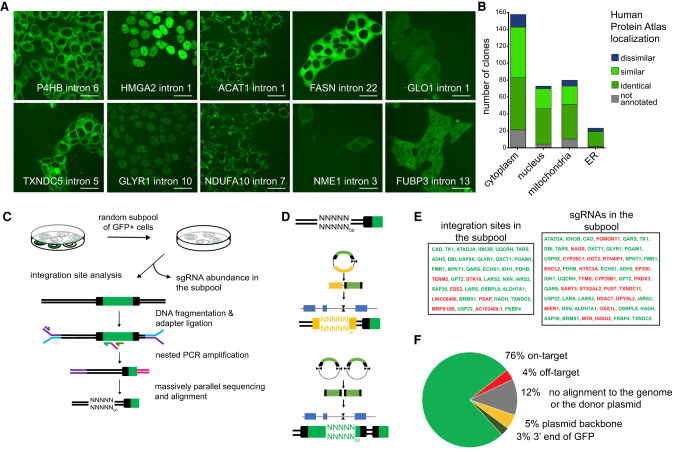
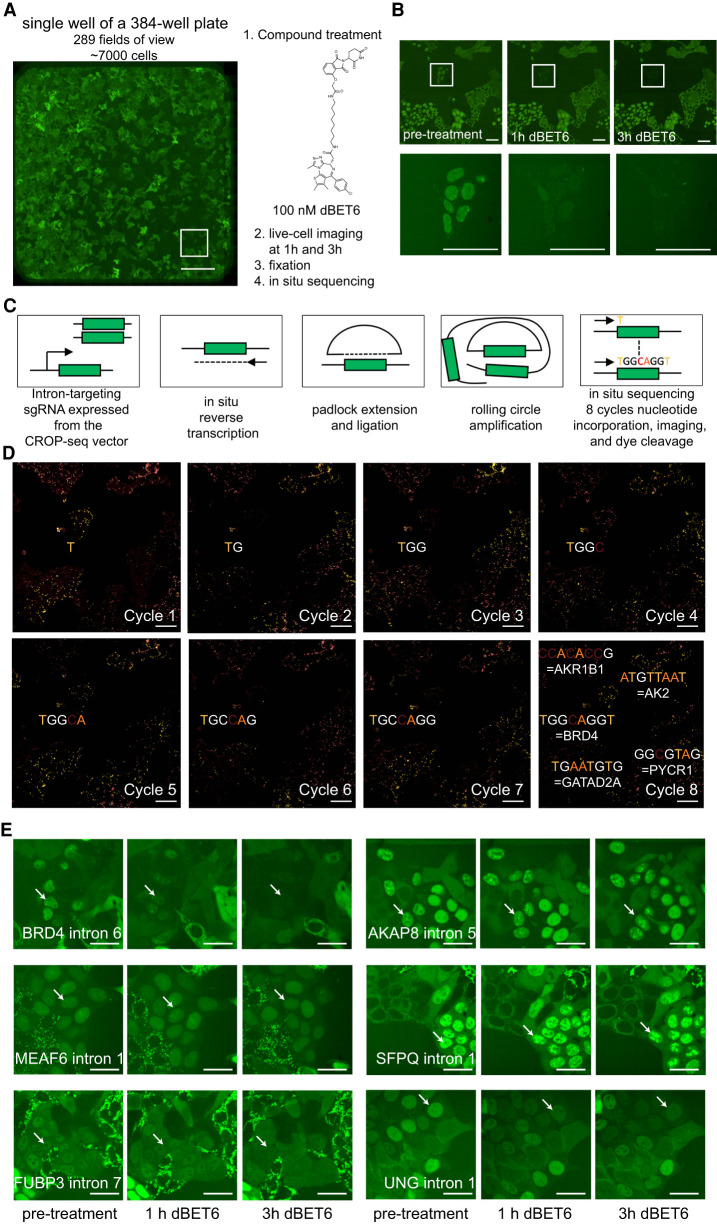
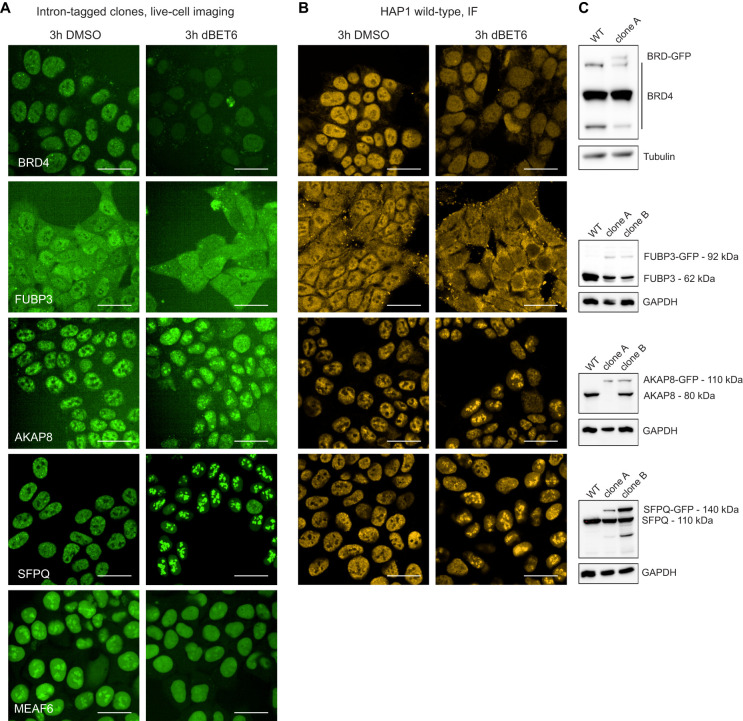
The levels and subcellular localizations of proteins regulate critical aspects of many cellular processes and can become targets of therapeutic intervention. However, high-throughput methods for the discovery of proteins that change localization either by shuttling between compartments, by binding larger complexes, or by localizing to distinct membraneless organelles are not available. Here we describe a scalable strategy to characterize effects on protein localizations and levels in response to different perturbations. We use CRISPR-Cas9-based intron tagging to generate cell pools expressing hundreds of GFP-fusion proteins from their endogenous promoters and monitor localization changes by time-lapse microscopy followed by clone identification using in situ sequencing. We show that this strategy can characterize cellular responses to drug treatment and thus identify nonclassical effects such as modulation of protein-protein interactions, condensate formation, and chemical degradation.


Figures

Figure 1.
Figure 1.
Pooled GFP intron-tagging of metabolic enzymes. (A) Schematic outline of the approach. (B) Identification of targetable introns within metabolic genes. (C) FACS sorting of clones with successful GFP-tagging by signal enrichment over background mCherry intensity used as control for autofluorescence. (D) Representative image of sorted GFP-tagged cell pool. Scale bar, 25 µm. (E) Comparison of RNA-seq expression in HAP1 cells between genes for which GFP-tagged cells could be isolated and genes that were targeted in the sgRNA library but did not result in successful clone isolation.
Figure 2.
Figure 2.
Subcellular protein localizations and GFP integration sites in GFP-tagged clones isolated from the pool of tagged cells. (A) Representative images of individual clones isolated by single-cell dilution and identified by massively parallel sgRNA sequencing. Scale bars, 25 µm. (B) Comparison of localizations of 335 individually isolated clones to localization annotations in The Human Protein Atlas. (C) Outline of integration site analysis in a subpool of approximately 50 different GFP-tagged cells. (D) The 50-bp region upstream of the integration site aligns either to an on- or off-target genomic region or to the plasmid backbone in case the donor was only cut once, leading to integration of the whole donor plasmid, or to the 3′ end of an additional GFP fragment in case of a double integration event. (E) Integration sites and gene names of sgRNAs identified in the subpool by massively parallel sequencing (ranked by abundance). (F) Alignment of the identified integration sites in the subpool.
Figure 3.
Figure 3.
Compound screening on cell pools followed by in situ sequencing enables the detection of protein-specific compound effects. (A) Stitched image of 289 fields of view representing an entire well on a 384-well plate containing approximately 7000 individual cells. Scale bar, 500 µm. (B) Identification of a clone with rapid loss of GFP signal following treatment with 100 nM dBET6, whereas neighboring clones are unaffected. Scale bars, 50 µm. (C) Outline of the in situ sequencing approach. (D) Images from eight cycles in situ sequencing of the area shown in panel B. Scale bar, 25 µm. (E) Selected images for cells within the pool showing localization changes following dBET6 treatment. Scale bars, 25 µm.
Figure 4.
Figure 4.
Validation of the compound effects in GFP-tagged clonal cell lines and wild-type cells. (A) Effects of treatment with 100 nM dBET6 for 3 h in newly generated GFP-tagged clonal cell lines. (B) Effects of treatment with 100 nM dBET6 for 3 h in HAP1 wild-type cells shown by immunofluorescence staining. (C) Western blot of wild-type HAP1 cells and GFP-tagged clonal cell lines.

References

    1. Anzalone AV, Randolph PB, Davis JR, Sousa AA, Koblan LW, Levy JM, Chen PJ, Wilson C, Newby GA, Raguram A, et al. 2019. Search-and-replace genome editing without double-strand breaks or donor DNA. Nature 576: 149–157. 10.1038/s41586-019-1711-4 - DOI - PMC - PubMed
    1. Birsoy K, Wang T, Chen WW, Freinkman E, Abu-Remaileh M, Sabatini DM. 2015. An essential role of the mitochondrial electron transport chain in cell proliferation is to enable aspartate synthesis. Cell 162: 540–551. 10.1016/j.cell.2015.07.016 - DOI - PMC - PubMed
    1. Chong YT, Koh JL, Friesen H, Duffy SK, Cox MJ, Moses A, Moffat J, Boone C, Andrews BJ. 2015. Yeast proteome dynamics from single cell imaging and automated analysis. Cell 161: 1413–1424. 10.1016/j.cell.2015.04.051 - DOI - PubMed
    1. Chu VT, Weber T, Wefers B, Wurst W, Sander S, Rajewsky K, Kühn R. 2015. Increasing the efficiency of homology-directed repair for CRISPR-Cas9-induced precise gene editing in mammalian cells. Nat Biotechnol 33: 543–548. 10.1038/nbt.3198 - DOI - PubMed
    1. Cohen AA, Geva-Zatorsky N, Eden E, Frenkel-Morgenstern M, Issaeva I, Sigal A, Milo R, Cohen-Saidon C, Liron Y, Kam Z, et al. 2008. Dynamic proteomics of individual cancer cells in response to a drug. Science 322: 1511–1516. 10.1126/science.1160165 - DOI - PubMed

Publication types