. 2020 Nov 17;11(1):5843.
doi: 10.1038/s41467-020-19702-z.

Chromatin accessibility landscapes of skin cells in systemic sclerosis nominate dendritic cells in disease pathogenesis

Affiliations

Chromatin accessibility landscapes of skin cells in systemic sclerosis nominate dendritic cells in disease pathogenesis

Qian Liu et al. Nat Commun. .

Erratum in

Abstract

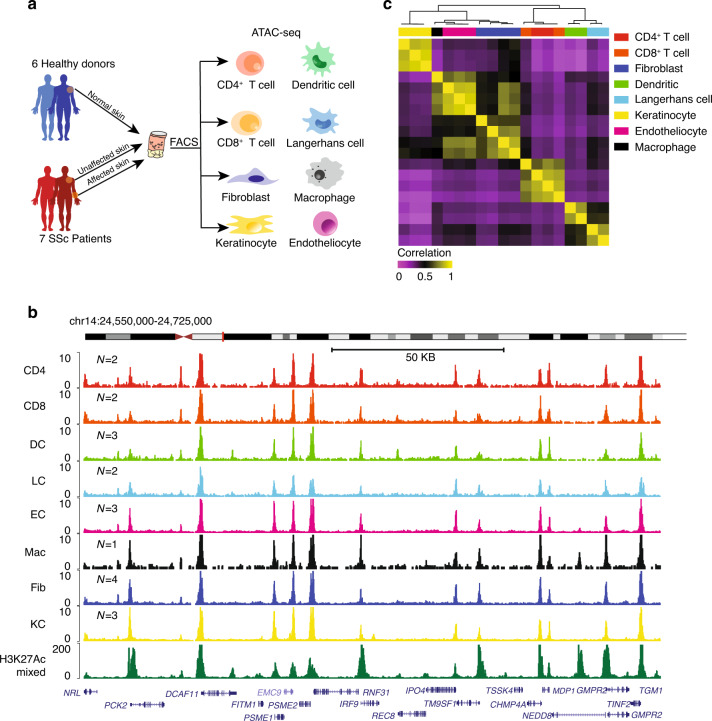
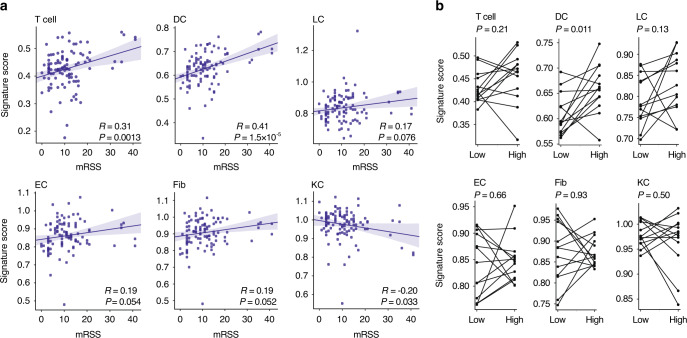
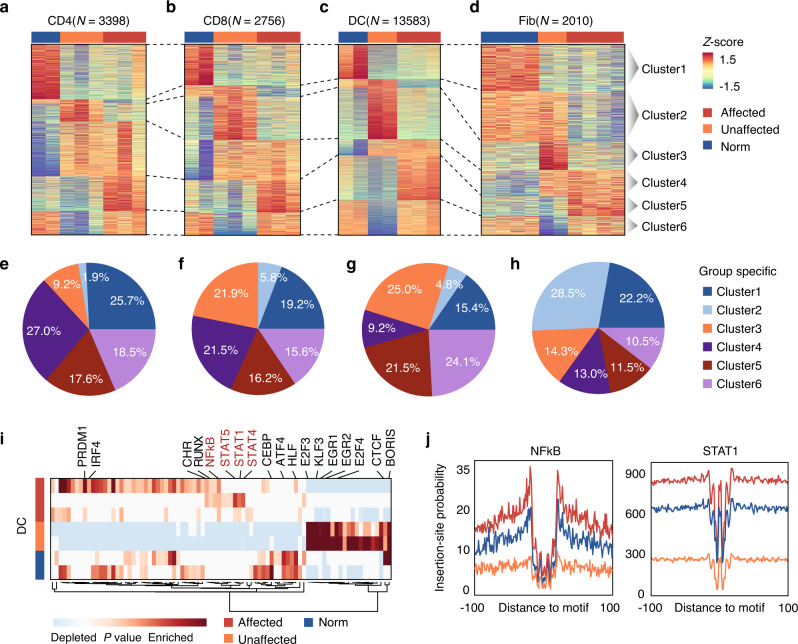
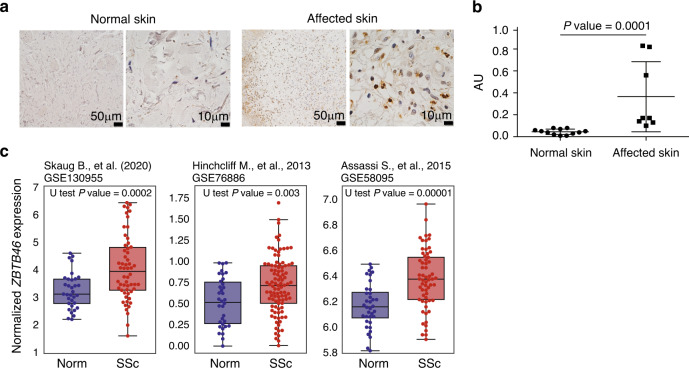
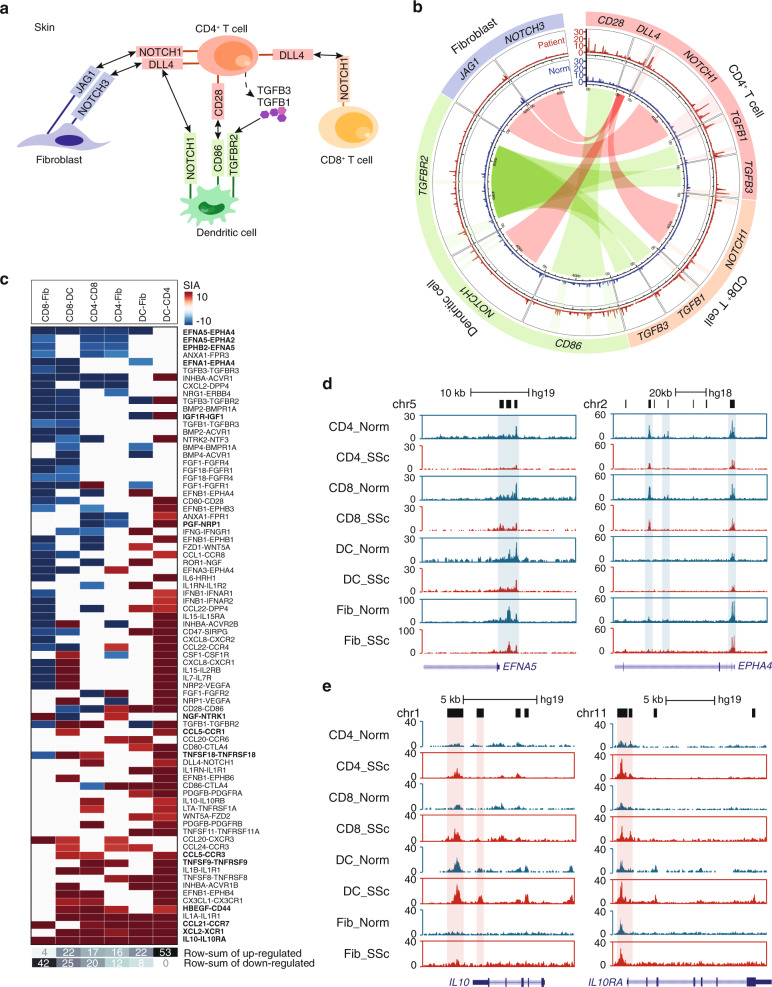
Systemic sclerosis (SSc) is a disease at the intersection of autoimmunity and fibrosis. However, the epigenetic regulation and the contributions of diverse cell types to SSc remain unclear. Here we survey, using ATAC-seq, the active DNA regulatory elements of eight types of primary cells in normal skin from healthy controls, as well as clinically affected and unaffected skin from SSc patients. We find that accessible DNA elements in skin-resident dendritic cells (DCs) exhibit the highest enrichment of SSc-associated single-nucleotide polymorphisms (SNPs) and predict the degrees of skin fibrosis in patients. DCs also have the greatest disease-associated changes in chromatin accessibility and the strongest alteration of cell-cell interactions in SSc lesions. Lastly, data from an independent cohort of patients with SSc confirm a significant increase of DCs in lesioned skin. Thus, the DCs epigenome links inherited susceptibility and clinically apparent fibrosis in SSc skin, and can be an important driver of SSc pathogenesis.


Conflict of interest statement

H.Y.C. is affiliated with Accent Therapeutics (co-founder and advisor), Boundless Bio (co-founder and advisor), 10x Genomics (advisor), Arsenal Biosciences (advisor), and Spring Discovery (advisor).

Figures

Fig. 1
Fig. 1. Landscape of DNA accessibility in 8 cell types from normal skin in vivo.
(a) A schematic outline of the study design depicting the workflow for the isolation and ATAC-seq of 8 cell types (CD4+, CD8+ T cells (CD4, CD8), dendritic cells (DC), Langerhans cells (LC), endotheliocytes (EC), macrophages (Mac), fibroblasts (Fib), and keratinocytes (KC)) from healthy individuals (normal skin) and SSc patients (unaffected skin and affected skin). (b) Normalized ATAC-seq signal profiles at a locus in CD4, CD8, DC, LC, EC, Mac, Fib, and KC from healthy donors, shown together with a normalized H2K27ac chromatin immunoprecipitation sequencing profile. N represents the number of biological replicates. (c) Unsupervised hierarchical clustering of the Pearson correlations between all the samples. ATAC-seq signals were obtained from distal elements. Each row and each column is a sample, and cell types distinguished colors. Source data are provided as a Source Data file.
Fig. 2
Fig. 2. Cell type-specific chromatin accessibility in a skin biopsy from healthy donors.
(a) Heatmap of the normalized ATAC-seq intensities of cell type-specific peaks from healthy donors. Each row is a peak, and each column is a sample, with color-coded cell types (top panel). Clusters shown in the sidebar represent cell-type-specific peaks of CD4 (CD4+ T cells) and CD8 (CD8+ T cells) (C1), DC (dendritic cells) and LC (Langerhans cells) (C2), Fib (fibroblasts) (C3), EC (endotheliocytes) and Mac (macrophages) (C4), and KC (keratinocytes) (C5) respectively. Functional marker genes in each cluster were shown on the right. Source data are provided as a Source Data file. (b) Top enriched GO (Gene Ontology) terms of peaks in each cluster. P values (Binom Raw P value) were calculated using the binomial statistic test in GREAT. Source data are provided as a Source Data file. (c) Enrichment of known transcription factor (TF) motifs in cell type-specific accessible elements for all normal samples. Each row is a TF motif and each column is a sample. The color bar represents the significance of enrichment estimated from Genomica, where red indicates enriched and blue depleted. Source data are provided as a Source Data file.
Fig. 3
Fig. 3. Pathogenic effects of different cell types to SSc.
(a) Scatter plots showing the average expressions of the cell type signature genes (defined in HOMER) for T cells (CD4+ and CD8+ T cells), DC (dendritic cells), LC (Langerhans cells), EC (endotheliocytes), Fib (fibroblasts), KC (keratinocytes), versus the corresponding mRSS (modified Rodnan skin score) of the same patient at the same time point during the treatment. Gene expression profiles were obtained from patients’ affected skin cells via microarray, and genes responding to mycophenolate mofetil (MMF) treatment were discarded. The linear regression curve and 95% confidence interval (grey area) were also illustrated in each panel, two-tailed t-statistic P-value and coefficient (R) of Pearson’s correlation were shown in the bottom right. Source data are provided as a Source Data file. (b) Pair-wise comparison of the average expressions of cell type signature genes at time point with the lowest versus highest mRSS of the same patient for all the six-cell types measured. For each patient during the treatment, we identified the time points when the mRSS score is the lowest (time point Low) and highest (time point High), and then calculated the corresponding signature scores for each cell type from the microarray profiles at time point Low and time point High, respectively. The time points Low and High can be different for different patients. 13 patients whose highest mRSS - lowest mRSS > 5 were shown, P values were estimated by paired and two-tailed Student’s t test. Source data are provided as a Source Data file.
Fig. 4
Fig. 4. Cell types-specific regulome divergence in normal, unaffected, and affected skins.
(ad) Heatmaps of the normalized ATAC-seq intensities (z-scores) of peaks enriched in normal, unaffected and affected CD4 (CD4+ T cells) (a), CD8 (CD8+ T cells) (b), DC (dendritic cells) (c) and Fib (fibroblasts) (d). Cluster 1-6 represents the peak groups enriched in normal only, normal and unaffected, unaffected only, unaffected and affected, affected only, and normal and affected cells respectively. Each row is a peak and each column is a sample. Source data are provided as a Source Data file. (eh) Ratios of peaks in each cluster compare with total number of significant differential peaks in CD4 (e), CD8 (f), DC (g), and Fib (h). (i) Enrichment of known transcription factor (TF) motifs in DCs isolated from healthy donors, and unaffected and affected skins from SSc patients. Source data are provided as a Source Data file. (j) Comparison of aggregate footprints for NFκB and STAT1 in DCs isolated from normal, unaffected or affected skins.
Fig. 5
Fig. 5. Conventional dendritic cells were more infiltrated in affected compare with normal skin.
(a) Immunohistochemistry analysis of ZBTB46 expression in normal and affected skin from SSc patient. 12 normal skin samples and 8 affected skin samples were included in our experiments. (b) Average expression of ZBTB46 protein in normal (= 12) and affected (= 8) skin from SSc patient. P value was estimated by one-sided Mann–Whitney U test. The upper, centre, and lower line indicates 75% quantile +1.5 * interquartile range (IQR), 50% quantile and 25% quantile −1.5 * IQR respectively. Source data are provided as a Source Data file. (c) The expression of cDC (conventional dendritic cells) marker gene ZBTB46 in normal (= 33, 34, 36) and SSc (= 58, 99, 61) skin in three published datasets. P value was estimated by one-sided Mann–Whitney U test. The upper, centre, and lower line of the box indicates 75%, 50%, and 25% quantile, respectively. The upper and lower whisker of the boxplot indicates 75% quantile +1.5 * interquartile range (IQR) and 25% quantile −1.5 * IQR. Source data are provided as a Source Data file.
Fig. 6
Fig. 6. Communications between skin resident cell in SSc compare to normal.
(a) Example diagram of the communications between dendritic cells, CD4+, CD8+ T cells, and fibroblasts through known and predicted SSc pathogenic receptors/ligands which were upregulated in affected skin compare to normal control. (b) Circos plot of the ATAC-seq signals around the receptors/ligands in (a) in normal versus affected skin from SSc patients. The outermost torus displays the names of the receptors and ligands in each cell type. The middle and inner torus display the ATAC-seq signals at these genes’ loci in SSc patients (middle) and healthy controls (inner) respectively. Gene loci that were more accessible in SSc cells were highlighted with shadow. Centre linkers connect the ligands and their receptors between cell types. The width of the linkers represents the length of the corresponding genes. (c) Strength of Interaction Alteration (SIA) for each pair of receptor/ligand up-regulated (red) or down-regulated (blue) in an affected state compared to the normal control. Novel receptor/ligand interactions in SSc were highlighted. The bottom rows display the total number of up-regulated and down-regulated receptor/ligand interactions between cell types. Source data are provided as a Source Data file. (de) Normalized ATAC-seq profiles of the normal vs affected CD4 (CD4+ T cells), CD8 (CD8+ T cells), DC (dendritic cells) and Fib (fibroblasts) at the EFNA5 and EPHA4 (d) and the IL10 and IL10RA (e) gene loci.

References

    1. Denton CP, Khanna D. Systemic sclerosis. Lancet. 2017;390:1685–1699. doi: 10.1016/S0140-6736(17)30933-9. - DOI - PubMed
    1. Kucharz EJ, Kopec-Medrek M. Systemic sclerosis sine scleroderma. Adv. Clin. Exp. Med. 2017;26:875–880. doi: 10.17219/acem/64334. - DOI - PubMed
    1. Ho YY, Lagares D, Tager AM, Kapoor M. Fibrosis-a lethal component of systemic sclerosis. Nat. Rev. Rheumatol. 2014;10:390–402. doi: 10.1038/nrrheum.2014.53. - DOI - PubMed
    1. Katsumoto TR, Whitfield ML, Connolly MK. The pathogenesis of systemic sclerosis. Annu. Rev. Pathol.: Mechanisms Dis. 2011;6:509–537. doi: 10.1146/annurev-pathol-011110-130312. - DOI - PubMed
    1. Mecoli CA, Casciola-Rosen L. An update on autoantibodies in scleroderma. Curr. Opin. Rheumatol. 2018;30:548–553. doi: 10.1097/BOR.0000000000000550. - DOI - PMC - PubMed

Publication types