. 2020 Nov 17;11(1):5838.
doi: 10.1038/s41467-020-19684-y.

STAT2 signaling restricts viral dissemination but drives severe pneumonia in SARS-CoV-2 infected hamsters

Affiliations

STAT2 signaling restricts viral dissemination but drives severe pneumonia in SARS-CoV-2 infected hamsters

Robbert Boudewijns et al. Nat Commun. .

Abstract

Emergence of SARS-CoV-2 causing COVID-19 has resulted in hundreds of thousands of deaths. In search for key targets of effective therapeutics, robust animal models mimicking COVID-19 in humans are urgently needed. Here, we show that Syrian hamsters, in contrast to mice, are highly permissive to SARS-CoV-2 and develop bronchopneumonia and strong inflammatory responses in the lungs with neutrophil infiltration and edema, further confirmed as consolidations visualized by micro-CT alike in clinical practice. Moreover, we identify an exuberant innate immune response as key player in pathogenesis, in which STAT2 signaling plays a dual role, driving severe lung injury on the one hand, yet restricting systemic virus dissemination on the other. Our results reveal the importance of STAT2-dependent interferon responses in the pathogenesis and virus control during SARS-CoV-2 infection and may help rationalizing new strategies for the treatment of COVID-19 patients.


Conflict of interest statement

D.D.V., B.S., and X.S. are named as inventors on US patent application no. 62/988,610, entitled “Coronavirus Binders.” D.D.V., B.S., X.S., and N.C. are named as inventors on US patent application no. 62/991,408, entitled “SARS-CoV-2 Virus Binders.”

Figures

Fig. 1
Fig. 1. Type I interferon signaling restricts SARS-CoV-2 infection of the lungs of mice.
a Schematic representation of SARS-CoV-2 inoculation schedule. Several wild-type (WT) and knockout mouse strains were inoculated intranasally with 2 × 105 TCID50 of passage 4 (P4) SARS-CoV-2. On the indicated days post inoculation (p.i.), lungs were collected for determination of viral RNA levels and scored for lung damage. b, c Normalized viral RNA levels in the lungs of BALB/c WT (blue circles, n = 3) and SCID (red circles, n = 3) mice and C57BL/6 WT (blue circles, n = 5), Ifnar1−/− (day 2 p.i. (red circles, n = 3), day 3 p.i. (red circles, n = 8), day 3 p.i. inactivated SARS-CoV-2 (red triangles, n = 4), day 4 p.i. (red circles, n = 3)), and Il28r−/− (purple circles, n = 5) mice. At the indicated time intervals p.i., viral RNA levels were determined by RT-qPCR, normalized against β-actin mRNA levels and transformed to estimate viral genome equivalents (vge) content per weight of the lungs (Supplementary Fig. 2). For heat inactivation, SARS-CoV-2 was incubated for 30 min at 56 °C. Dotted line indicates lower limit of quantification (LLOQ). The data shown are means ± SEM. d Histopathological scoring of the lungs for all different mouse strains. Mice were sacrificed on day 3 p.i., and the lungs were stained with H&E and scored for signs of lung damage (inflammation and hemorrhage). Scores are calculated as percentage of the total maximal score. “No score” means not contributing to theoretical full cumulative score of 100%. Numbers (n) of animals analyzed per condition are given in the inner circle. e Heatmap showing gene expression profiles of 30 selected marker genes in the lungs of uninfected and infected Ifnar1−/− mice (n = 3 per group). Analysis performed on day 3 p.i. The scale represents fold change compared to non-infected animals. Statistical significance between groups was calculated by two-tailed Mann–Whitney U test (b) or by Kruskal–Wallis with two-sided Dunn’s post hoc test (c). P values: **P = 0.0013, *P = 0.035 (c); ns not significant.
Fig. 2
Fig. 2. Type I and III interferon signaling restricts SARS-CoV-2 replication in hamsters.
a Schematic representation of SARS-CoV-2 inoculation schedule. WT (blue), STAT2−/− (red), and IL28R-a−/− (purple) hamster strains were inoculated intranasally with 2 × 105 TCID50 of passage 4 or 2 × 106 of passage 6 SARS-CoV-2. Outcomes derived from inoculation with passage 4 or passage 6 SARS-CoV-2 is designated by circles (P4, n = 3) or squares (P6, n = 4). On the indicated days post inoculation (p.i.), organs and blood were collected to determine viral RNA levels and infectious viral load. Viral loads in the indicated organs were quantified by RT-qPCR (b, df) or virus titration (c). b, e Viral RNA levels in the lungs (day 2 and day 3 p.i. of each genotype (n = 3); day 4 p.i. of each genotype (n = 7)) (b) or the indicated organs on day 4 p.i. (n = 4 for each genotype) (e) were normalized against β-actin mRNA levels and transformed to estimate viral genome equivalents (vge) content per weight of the tissue (Fig. S5). c Infectious viral loads in the lung on day 4 p.i. are expressed as the number of infectious virus particles per 100 mg of lung tissue (n = 7 for each genotype). d Viral RNA levels in the blood (day 2 and day 3 p.i. of each genotype (n = 3); day 4 p.i. of each genotype (n = 7)) were calculated from a standard of infectious virus and expressed as TCID50 equivalents per ml blood. Dotted lines indicate lower limit of quantification (LLOQ) or lower limit of detection (LLOD). f Viral RNA levels in hamsters after treatment with a previously described single-domain antibody. Hamsters were either left untreated (blue, n = 5) or treated with VHH-72-Fc (green, n = 4) and sacrificed on day 4 p.i. Viral RNA levels were determined in the lungs, normalized against β-actin, and fold changes were calculated using the 2(−ΔΔCq) method compared to the mean of untreated control. g Inhibition of JAK/STAT signaling by Ruxolitinib can rescue SARS-CoV-2 virus replication in human airway epithelial cells from the antiviral effect of type I IFN. Calu-3 (human airway epithelial) cells were left untreated or treated with Ruxolitinib (4 µM), IFN-α (10 IU/ml), or a combination of both (n = 8 for each condition). Treatment was initiated 4 h before infection and was continued through the whole experiment. Cultures were infected with P6 SARS-CoV-2 (MOI of 0.1), and 48 h p.i., cell culture supernatant was collected, RNA was extracted, and the amount of vRNA was quantified using RT-qPCR. A serial dilution of the same virus stock was used to generate a standard curve for absolute quantification. The data shown are mean ± SEM. Statistical significance between groups was calculated by Kruskal–Wallis with two-sided Dunn’s post hoc test (bd, g) or by an unpaired two-sided t test (f). P values: *P = 0.010 (c), ***P = 0.0009 and *P = 0.02 (d), ****P < 0.0001 (f), *P = 0.022 and *P = 0.013 (left to right in g); ns not significant.
Fig. 3
Fig. 3. Exuberant innate response by STAT2 drives SARS-CoV-2-induced lung pathology in hamsters.
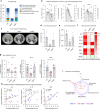
WT (blue), STAT2−/− (red), and IL28R-a−/− (purple) hamster strains were inoculated intranasally with 2 × 105 TCID50 of passage 4 (circles, n = 3) or 2 × 106 of passage 6 (squares, n = 4) SARS-CoV-2. On day 4 p.i., lungs and blood were collected to score for lung damage and determine gene expression levels. a Cumulative lung pathology scores for signs of damage. Lungs were stained with H&E and scored for signs of inflammation, bronchopneumonia, edema, apoptotic bodies, and necrotizing bronchiolitis (n = 7 for each genotype). b Matched comparison between infectious viral load in the lung (left Y-axis) (values from Fig. 2c) and histopathological scores (right Y-axis) (values used in a). Lines indicate matched samples (n = 7 for each genotype). ce Micro-CT to score for signs of damage in infected (P6 SARS-CoV-2) WT (n = 4), STAT2−/− (n = 4), and IL28R-a−/− (n = 3) hamster lungs. c Representative transversal micro-CT images. Yellow arrows indicate examples of pulmonary infiltrates seen as consolidation of lung parenchyma. d Five transverse cross-sections at different positions in the lung were selected for each animal and scored to quantify lung consolidations. e Quantification of the micro-CT-derived non-aerated lung volume biomarker, reflecting the volume of consolidations in the lungs. The data shown are mean ± SEM and lines indicate healthy animals (n = 3) (d, e). f, g Heat map or individual expression profiles showing differential expression of selected antiviral, pro-inflammatory, and cytokine genes in the lungs after SARS-CoV-2 infection (n = 7 per group) relative to non-infected genotype matched controls (WT (n = 7), STAT2−/− (n = 3), and IL28R-a−/− (n = 3)). RNA levels were determined by RT-qPCR on lung extracts, normalized for β-actin mRNA levels, and fold changes over the median of uninfected controls were calculated using the 2(−ΔΔCq) method. Only for IFN-λ, where all uninfected control animals had undetectable RNA levels, fold changes were calculated over the lowest detectable value. Data presented as fold change (f) or log2 fold change over non-infected control (g) Bars represent median ± IQR. h Correlation between histopathological scores (derived from Fig. 3a) and natural log-normalized gene expression levels (derived from Fig. 3f, g and Supplementary Fig. 9) in uninfected and infected animals. Non-infected animals are indicated by triangles. i A spider-web plot showing lung pathology scores (CT lung score, non-aerated lung volume, bronchopneumonia, and inflammation), cumulative gene expression level scores, and infectious virus levels normalized to SARS-CoV-2-infected WT hamsters. Statistical significance between genotypes was calculated by Kruskal–Wallis with two-sided Dunn’s post hoc test (d, e, g) and Spearman correlation (h). P values: **P = 0.0082 and **P = 0.0025 (left to right in g).

References

    1. Cui J, Li F, Shi ZL. Origin and evolution of pathogenic coronaviruses. Nat. Rev. Microbiol. 2019;17:181–192. doi: 10.1038/s41579-018-0118-9. - DOI - PMC - PubMed
    1. Zhu N, et al. A novel coronavirus from patients with pneumonia in China, 2019. N. Engl. J. Med. 2020;382:727–733. doi: 10.1056/NEJMoa2001017. - DOI - PMC - PubMed
    1. Chen J, et al. Clinical progression of patients with COVID-19 in Shanghai, China. J. Infect. 2020;80:e1. doi: 10.1016/j.jinf.2020.03.004. - DOI - PMC - PubMed
    1. Channappanavar R, et al. Dysregulated type I interferon and inflammatory monocyte-macrophage responses cause lethal pneumonia in SARS-CoV-infected mice. Cell Host Microbe. 2016;19:181–193. doi: 10.1016/j.chom.2016.01.007. - DOI - PMC - PubMed
    1. Channappanavar R, Perlman S. Pathogenic human coronavirus infections: causes and consequences of cytokine storm and immunopathology. Semin. Immunopathol. 2017;39:529–539. doi: 10.1007/s00281-017-0629-x. - DOI - PMC - PubMed

Publication types

MeSH terms

Substances