. 2020 Nov 17;11(1):5860.
doi: 10.1038/s41467-020-19453-x.

Distinct oligodendrocyte populations have spatial preference and different responses to spinal cord injury

Affiliations

Distinct oligodendrocyte populations have spatial preference and different responses to spinal cord injury

Elisa M Floriddia et al. Nat Commun. .

Abstract

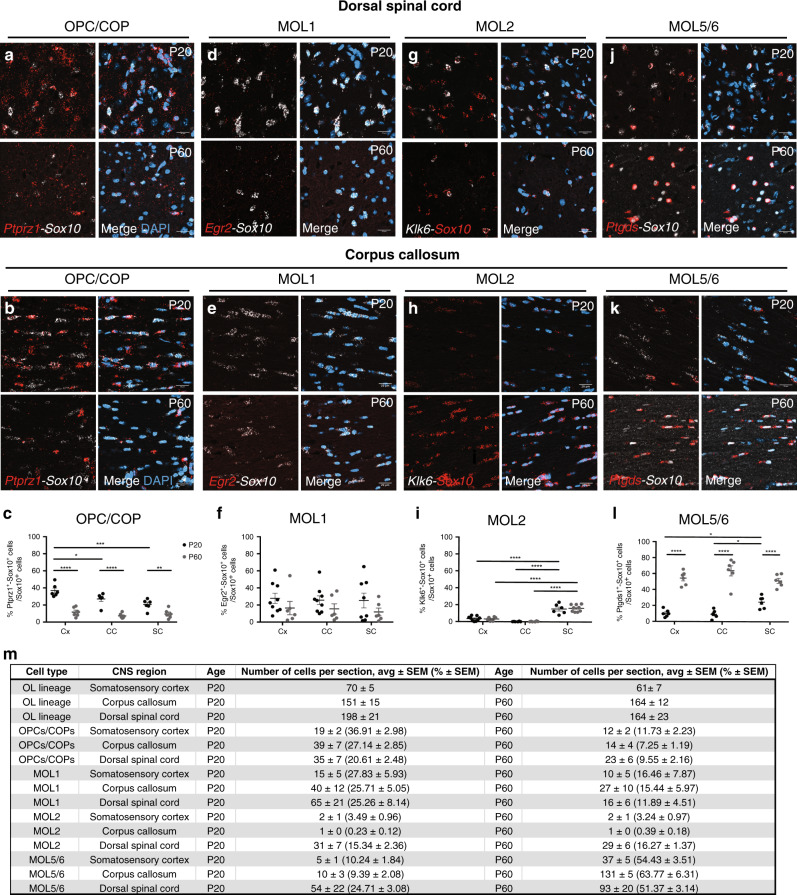
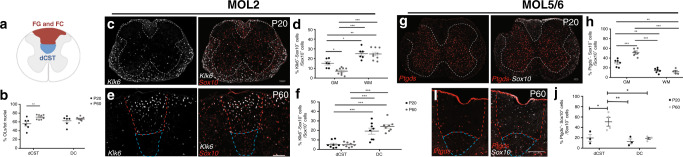
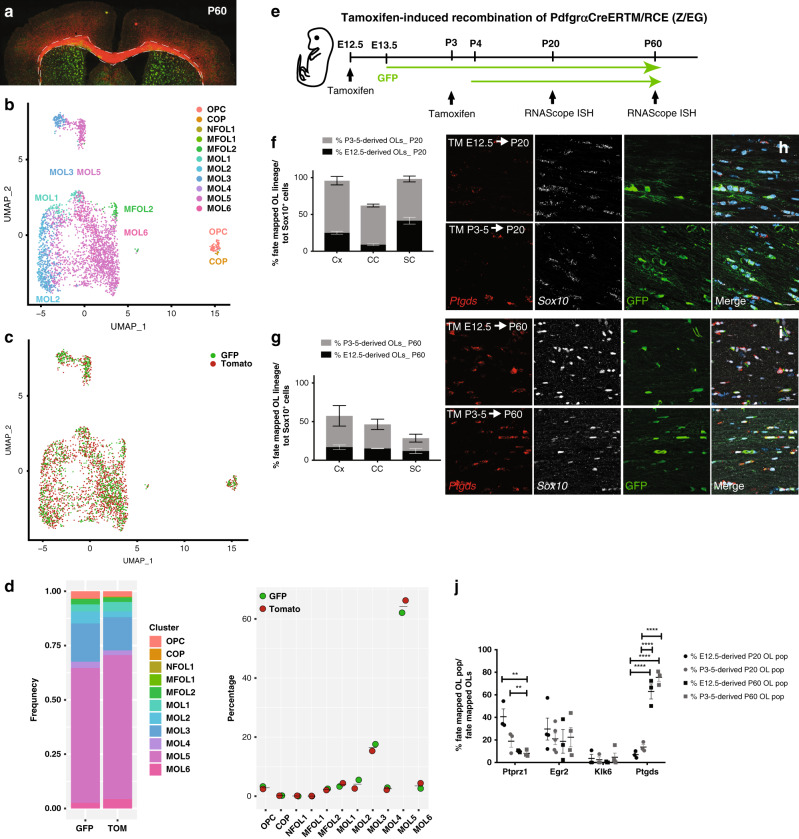
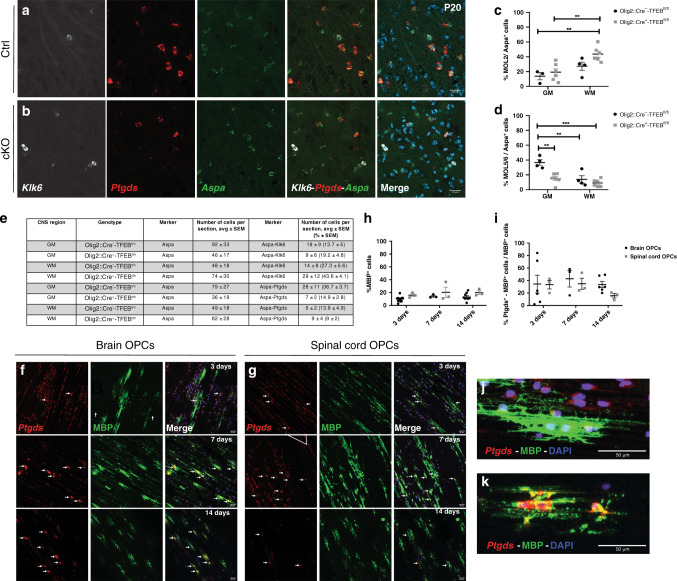
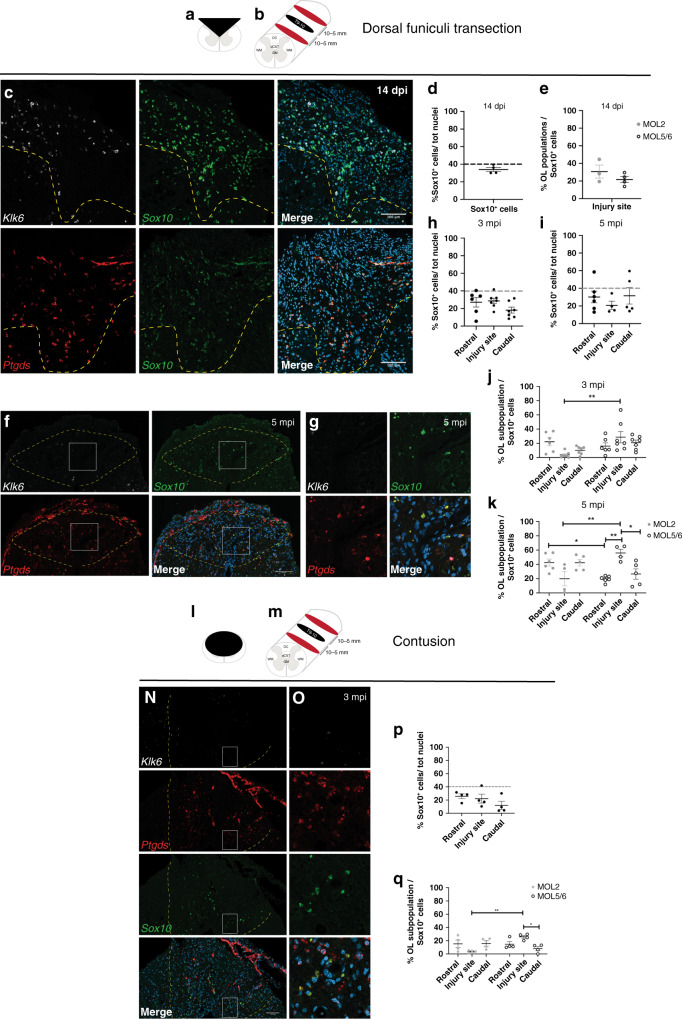
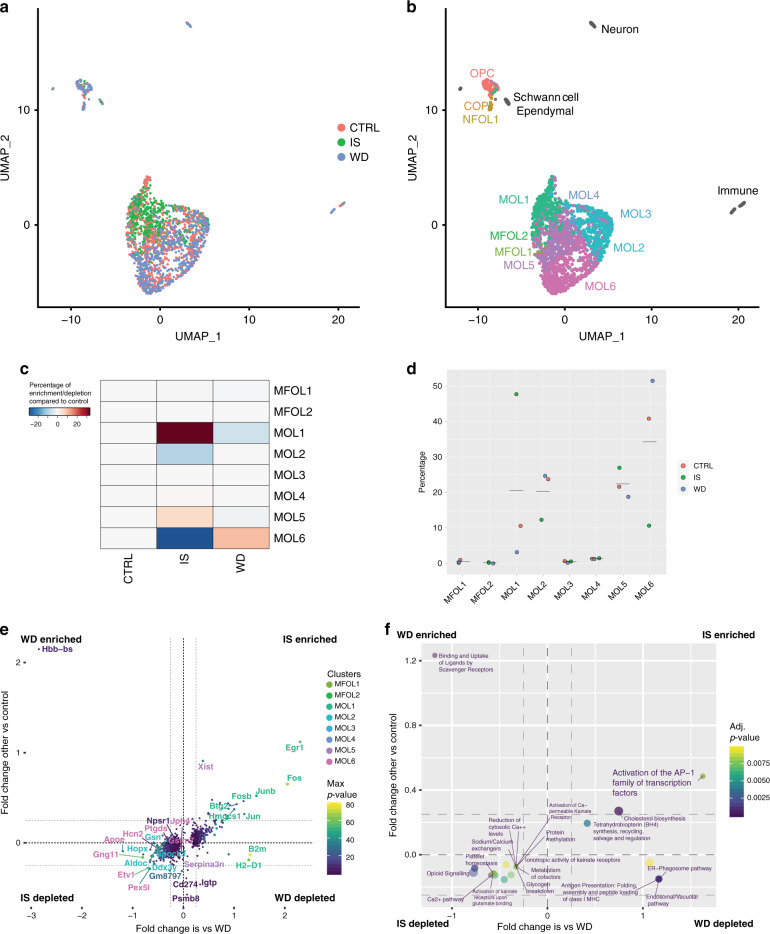
Mature oligodendrocytes (MOLs) show transcriptional heterogeneity, the functional consequences of which are unclear. MOL heterogeneity might correlate with the local environment or their interactions with different neuron types. Here, we show that distinct MOL populations have spatial preference in the mammalian central nervous system (CNS). We found that MOL type 2 (MOL2) is enriched in the spinal cord when compared to the brain, while MOL types 5 and 6 (MOL5/6) increase their contribution to the OL lineage with age in all analyzed regions. MOL2 and MOL5/6 also have distinct spatial preference in the spinal cord regions where motor and sensory tracts run. OL progenitor cells (OPCs) are not specified into distinct MOL populations during development, excluding a major contribution of OPC intrinsic mechanisms determining MOL heterogeneity. In disease, MOL2 and MOL5/6 present different susceptibility during the chronic phase following traumatic spinal cord injury. Our results demonstrate that the distinct MOL populations have different spatial preference and different responses to disease.


Conflict of interest statement

M.N. and M.M.H. held shares in Cartana AB, a company commercializing in situ sequencing reagents. E.M.F. is currently employed as an Associate Editor of Nature Communications. She was not involved in the decision-making process for this manuscript and did not have access to confidential information pertaining to peer review and editorial process. The remaining authors declare no competing interests.

Figures

Fig. 1
Fig. 1. Specific mature OL populations have spatial preference in the juvenile and adult central nervous system.
ak Confocal representative images of the distribution of OPC/COP (Ptprz1+ OL lineage cells, a and b), MOL1 (Egr2+ OL lineage cells, d and e), MOL2 (Klk6+ OL lineage cells, g and h), and MOL5/6 (Ptgds+ OL lineage cells, j and k) in the juvenile (P20) and adult (P60) dorsal spinal cord (dorsal horn gray matter, a, d, g, j) and corpus callosum (b, e, h, k). Scale bar = 20 μm. c, f, i, l Quantification of the OPC/COP (c), MOL1 (f), MOL2 (i), MOL5/6 (l) distribution in the cortex, corpus callosum, and dorsal spinal cord (dorsal horn and dorsal white matter) in juvenile (P20) and adulthood (P60). Percentage of the population is calculated on the total number of OL lineage cells (Sox10+ cells) in the analyzed region. Data are presented as mean ± SEM. n = 6 animals per condition, and can be assessed in the Source Data file. Black circles—P20; Gray circles—P60; Asterisks indicate a significant difference between conditions (*p ≤ 0.05, **p ≤ 0.01, ***p ≤ 0.001, ****p ≤ 0.0001, two-way ANOVA with Sidak’s correction). Exact p values are reported in the Source Data file. m Quantification of the OL subpopulations contribution to the OL lineage. Average number and percentage of the OL lineage cells (Sox10+), OPC-COPs (Ptprz1+ OL lineage cells), MOL1 (Egr2+ OL lineage cells), MOL2 (Klk6+ OL lineage cells), and MOL5/6 (Ptgds+ OL lineage cells) contribution to the OL lineage (Sox10+ cells) in the regions of interest in juvenile (postnatal day (P) 20) and adulthood (P60). We imaged 0.3, 0.13, and 0.4 mm2 of the sensorimotor cortex, corpus callosum, and dorsal spinal cord per tissue section, respectively. Minimum three sections per animal were analyzed. Data are presented as mean ± SEM. n = 4−9 animals per condition, and can be assessed in the Supplementary Source Data file. Blue staining in merged images correspond to 4′,6-diamidino-2-phenylindole (DAPI) staining. Cx cortex, CC corpus callosum, SC spinal cord. OPC oligodendrocyte progenitor cell, COP committed OPC, MOL mature oligodendrocyte. Source data are provided as a Source Data file.
Fig. 2
Fig. 2. MOL2 and MOL5/6 are specifically enriched in adjacent regions of the juvenile and adult spinal cord.
a Schematics of a coronal section of the spinal cord. Highlighted in blue and red the dorsal funiculi (white matter region) where ascending (FG and FC) and descending (dCST) tracts run, respectively. b Percentage of the OL lineage cells (Sox10+ cells) calculated on the total number of nuclei shows an enrichment of the OL lineage in the dCST with age. Data are presented as mean ± SEM. n = 6−8 animals per condition, and can be assessed in the Source Data file. c, e Confocal representative images show the enrichment of MOL2 (Klk6+ OL lineage cells) in the white matter of the spinal cord (c) at postnatal day (P) 20 and at the level of the dorsal columns at P60 (e). g, i Confocal representative images show the enrichment of MOL5/6 (Ptgds+ OL lineage cells) in the gray matter of the spinal cord at P20 (g) and in the dorsal corticospinal tract at P60 (i). Scale bar = 100 μm. d, f, h, j Quantification of the MOL2 and MOL5/6 distribution in the white and gray matter of the spinal cord (d, h) and dorsal funiculi (f, j) in juvenile (P20) and adulthood (P60). Percentage of the population is calculated on the total number of OL lineage cells (Sox10+ cells) in the analyzed region. Data are presented as mean ± SEM. n = 3−9 animals per condition, and can be assessed in the Source Data file. Asterisks in all the panels in this figure indicate a significant difference between conditions (*p ≤ 0.05, **p ≤ 0.01, ***p ≤ 0.001, two-way ANOVA with Sidak’s correction with multiple comparisons). Exact p values are reported in the Source Data file. Black circles—P20; Gray circles—P60. GM gray matter, WM white matter, FG fasciculi gracilis, FC fasciculi cuneatus, dCST dorsal corticospinal tract. MOL mature oligodendrocyte. Source data are provided as a Source Data file.
Fig. 3
Fig. 3. The developmental origin does not specify OPCs into distinct MOL populations.
a Confocal representative images of the postnatal day (P)60 brain from Emx1::Cre-SOX10::GFP-TdTom mouse. Dashed outline highlights the corpus callosum and dissected region used for scRNAseq. b, c Uniform Manifold Approximation and Projection (UMAP) plots showing the OL lineage composition determined by graph-based clustering (Seurat), and integration cells with the Marques et al. scRNA-Seq dataset (b) and the TdTom+ and GFP+ OL lineage cells contribution to the clusters (c). d Frequency distribution of the TdTom+ and GFP+ OL lineage cells forming the major clusters. n = 2853 cells. e Schematic overview of the fate mapping experimental design. Green arrows show the GFP expression timeline 24 h delayed from the time of tamoxifen injection. f, g Percentage of the fate mapped OL lineage cells (Sox10+-GFP+ cells) derived by OPCs labeled at E12.5 and P3-5 calculated on the total number of OL lineage cells (Sox10+ cells) at juvenile (f) and adulthood (g). Data are presented as mean ± SEM. n = 4−5 (f) and 3−5 (g) animals per condition, and can be assessed in the Source Data file. h, i Confocal representative images show the MOL5/6 (Ptgds+-GFP+ OL lineage cells differentiated from pre- (TM E12.5) or postnatal (TM P3-5) OPCs in the P20 (h) and P60 (i) corpus callosum. Scale bar = 20 μm. j Percentages of the fate mapped OPCs-COPs (Ptprz1+-GFP+ OL lineage cells), MOL1 (Egr2+-GFP+ OL lineage cells), MOL2 (Klk6+-GFP+ OL lineage cells), and MOL5/6 (Ptgds+-GFP+ OL lineage cells) populations are calculated on the total number of fate mapped OL lineage cells (Sox10+-GFP+ cells) in the juvenile and adult corpus callosum. Data are presented as mean ± SEM. n = 3−5 animals per condition, and can be assessed in the Source Data file. Asterisks indicate a significant difference between conditions (**p ≤ 0.01, ****p ≤ 0.0001, two-way ANOVA with Sidak’s correction). Exact p values are reported in the Source Data file. TM tamoxifen, OPC oligodendrocyte progenitor cell, COP committed OPC, NFOL newly formed oligodendrocyte, MFOL myelin forming oligodendrocyte, MOL mature oligodendrocyte, TdTom tandem duplicated tomato, GFP green fluorescent protein. Source data are provided as a Source Data file.
Fig. 4
Fig. 4. TFEB does not regulate OPC differentiation into distinct MOL subpopulations during development and the OL lineage heterogeneity observed in vivo is not modeled in 3D culture conditions.
a, b Confocal representative images show that MOL2 (Klk6+-Aspa+ cells) and MOL5/6 (Ptgds+-Aspa+ cells) in the juvenile (P20) gray matter of the spinal cord of the Olig2::Cre-TFEBfl/fl (a) and Olig2::Cre+-TFEBfl/fl (b) mice. Scale bar = 20 μm. c, e Quantification of the MOL2 (Klk6+-Aspa+ cells, c), and MOL5/6 (Ptgds+-Aspa+ cells, d) populations in the gray and white matter of the juvenile (P20) spinal cord, and summary table (e). Percentages of the populations are calculated on the total number of mature OLs (Aspa+ cells) in the analyzed region. Data are presented as mean ± SEM. n = 3−6 animals per genotype, and values of the individual data points are reported in the Source Data file. Asterisks indicate a significant difference between conditions (**p ≤ 0.01, ***p ≤ 0.0001, two-way ANOVA with Sidak’s correction). Exact p values are reported in the Source Data file. f, g Confocal representative images show the MBP+ and Ptgds+-MBP+ cells derived from brain (f) and spinal cord (g) OPCs cultured on microfibers for 3, 7, or 14 days of differentiation in vitro. Scale bar = 50 μm. h, i Quantification of the MBP+ (h) and Ptgds+/MBP+ (i) cells cultured on microfibers for 3, 7 or 14 days of differentiation in vitro. Percentages of the populations are calculated on the total number of nuclei (h) or MBP+ cells (i). Data are presented as mean ± SEM. n = 3−11 independent experiments. Each experiment was a biological replicate. Tissue from n = 4−10 P7 pups was used for each biological replicate. OPC oligodendrocyte progenitor cell, Ctrl Olig2::Cre-TFEBfl/fl, cKO Olig2::Cre+-TFEBfl/fl, GM gray matter, WM white matter. j, k Representative images of MBP+ cell from brain OPCs 3 days in vitro with process extension on top of microfibers (j) and 14 days in vitro with some processes enwrapping microfibers (k). OPC oligodendrocyte progenitor cell. Source data are provided as a Source Data file.
Fig. 5
Fig. 5. MOL2 and MOL5/6 show differential susceptibility to disease.
a, b, lm Schematic of the different models of traumatic spinal cord injury as well as the lesions relative extent and distribution (a, l), level of the lesions (T9-10. b, m) and distance of the rostral and caudal analyzed segments (b, m). c, f, g, n, o Confocal representative images of the lesions following dorsal funiculi transection (c, f, g) and contusion (n, o) injuries, showing the specific loss of MOL2 (Klk6+ OL lineage cells) and the high repopulation by MOL5/6 (Ptgds+ OL lineage cells) of the lesions during the chronic phase following traumatic spinal cord injury (f, g, n, o), but not at the acute phase (c). Yellow dashed lines highlight the lesion sites. White rectangles highlight the regions shown in higher magnification. Scale bar = 100 μm. d, e, h, i, j, k, p, q Quantification of the OL lineage (d, h, i, p) and the MOL populations away and at the injury sites (e, j, k, q). Percentage of the MOL2 and MOL5/6 subpopulations was calculated on the total number of OL lineage cells (Sox10+ cells). Dashed black line marks the average percentage of the OL lineage cells in the intact adult spinal cord (d, h, p). Data are presented as mean ± SEM. n = 3–7 animals per condition, and can be assessed in the Source Data file. Asterisks indicate a significant difference between conditions (*p ≤ 0.05, **p ≤ 0.01, two-way ANOVA with Sidak’s correction). Exact p values are reported in the Source Data file. SCI spinal cord injury, dpi days post-injury, mpi months post-injury, T10 thoracic vertebra 10. MOL mature oligodendrocyte. Source data are provided as a Source Data file.
Fig. 6
Fig. 6. MOL2 and MOL5/6 change their transcriptional profile following traumatic spinal cord injury.
a, b Uniform Manifold Approximation and Projection (UMAP) plots showing 1967 Sox10::Cre-GFP-positive cells from laminectomy control, injury site, and Wallerian degeneration regions contributing to the clusters (a) and cell lineage composition (b), as determined by graph-based clustering (Seurat), and integration of labels with the Marques et al. scRNA-Seq dataset,. c, d Frequency distribution of the OL lineage cells from the laminectomy control and injury site (c) and Wallerian degeneration regions and injury site (d) forming the clusters. e, f 2D Volcano plots showing the differentially expressed genes (e) and biological processes (f) in the OL lineage cells from the injury site compared to laminectomy control and Wallerian degeneration regions. Gene symbols are colored according to the clusters that are enriched at, while the corresponding dot is colored according to the p value. The OL lineage was sorted from Sox10::Cre-GFP mouse line 3 months following spinal cord injury. CTRL laminectomy control, IS injury site, WD Wallerian degeneration. OPC oligodendrocyte progenitor cell, COP committed OPC, NFOL newly formed oligodendrocyte, MFOL myelin forming oligodendrocyte, MOL mature oligodendrocyte. Source data are provided as a Source Data file.

References

    1. Simons M, Nave KA. Oligodendrocytes: myelination and axonal support. Cold Spring Harb. Perspect. Biol. 2015;8:a020479. - PMC - PubMed
    1. Bercury KK, Macklin WB. Dynamics and mechanisms of CNS myelination. Dev. Cell. 2015;32:447–458. - PMC - PubMed
    1. Fields RD. White matter in learning, cognition and psychiatric disorders. Trends Neurosci. 2008;31:361–370. - PMC - PubMed
    1. Tomassy GS, Dershowitz LB, Arlotta P. Diversity matters: a revised guide to myelination. Trends Cell Biol. 2016;26:135–147. - PMC - PubMed
    1. Marques S, et al. Oligodendrocyte heterogeneity in the mouse juvenile and adult central nervous system. Science. 2016;352:1326–1329. - PMC - PubMed

Publication types

MeSH terms

Substances