. 2020 Nov 17;11(1):5718.
doi: 10.1038/s41467-020-19580-5.

Centennial response of Greenland's three largest outlet glaciers

Affiliations

Centennial response of Greenland's three largest outlet glaciers

Shfaqat A Khan et al. Nat Commun. .

Abstract

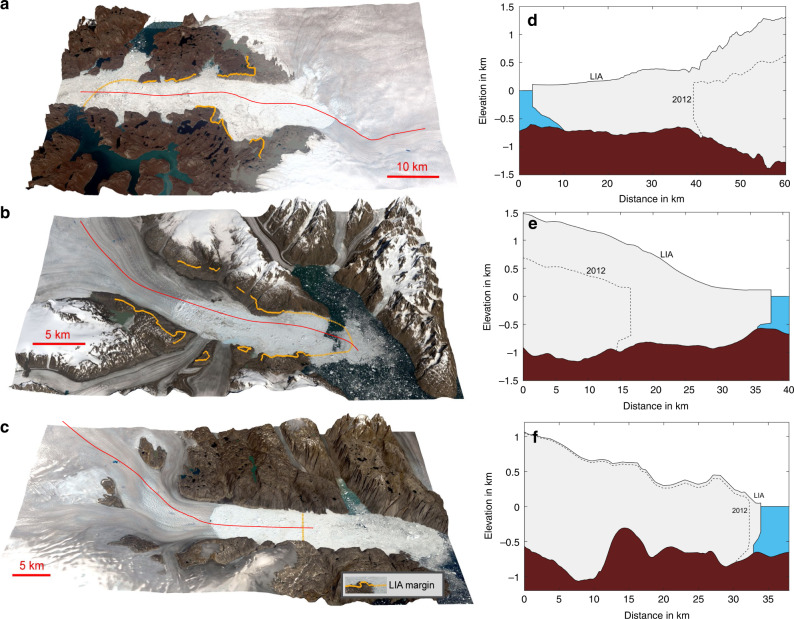
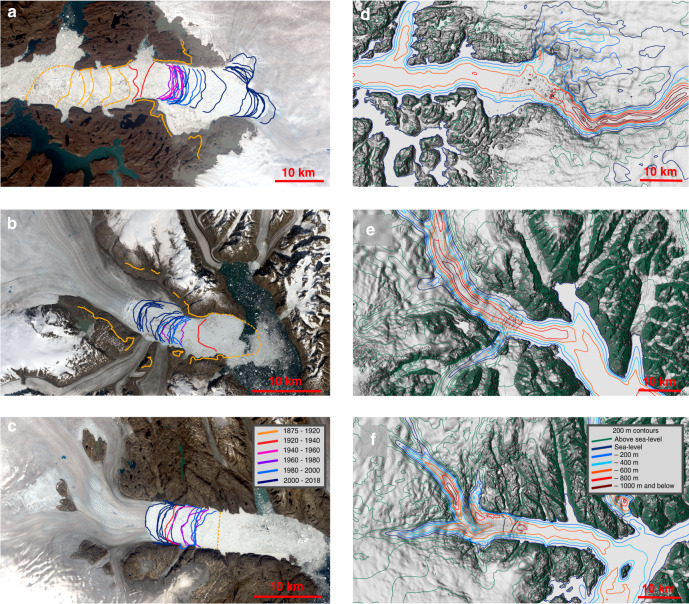
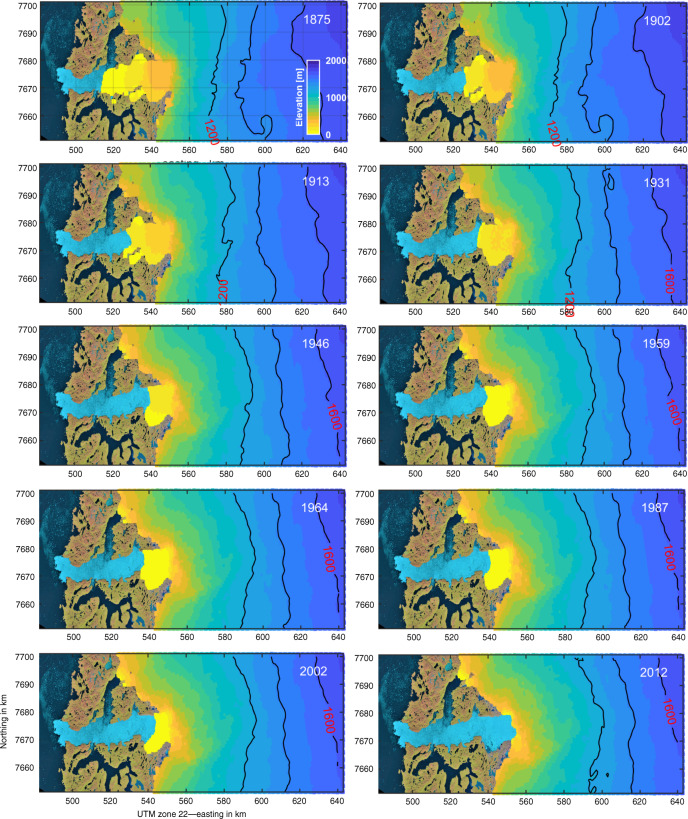
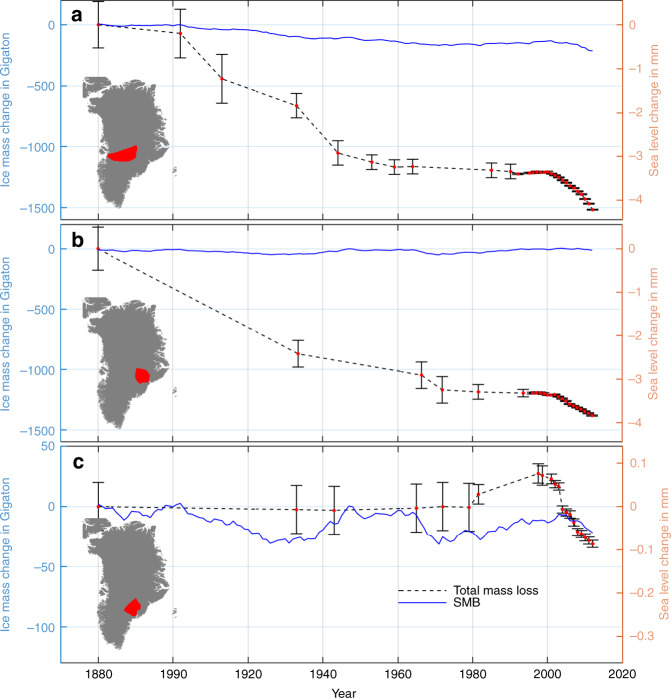
The Greenland Ice Sheet is the largest land ice contributor to sea level rise. This will continue in the future but at an uncertain rate and observational estimates are limited to the last few decades. Understanding the long-term glacier response to external forcing is key to improving projections. Here we use historical photographs to calculate ice loss from 1880-2012 for Jakobshavn, Helheim, and Kangerlussuaq glacier. We estimate ice loss corresponding to a sea level rise of 8.1 ± 1.1 millimetres from these three glaciers. Projections of mass loss for these glaciers, using the worst-case scenario, Representative Concentration Pathways 8.5, suggest a sea level contribution of 9.1-14.9 mm by 2100. RCP8.5 implies an additional global temperature increase of 3.7 °C by 2100, approximately four times larger than that which has taken place since 1880. We infer that projections forced by RCP8.5 underestimate glacier mass loss which could exceed this worst-case scenario.


Conflict of interest statement

The authors declare no competing interests.

Figures

Fig. 1
Fig. 1. Little Ice Age margin and surface elevation.
a Landsat image of Jakobshavn Isbræ from 2019. Yellow line represents Little Ice Age (LIA) maximum extent. Red line denotes central flow line. b same as a for Kangerlussuaq Glacier. c same as a for Helheim Glacier. d Bed topography and ice surface elevation during Little Ice Age maximum ice extent at Jakobshavn Isbræ. The profile follows the red line shown in a. e same as d, but for Kangerlussuaq Glacier. f same as d, but for Helheim Glacier.
Fig. 2
Fig. 2. Frontal retreat and bed elevation.
a Frontal positions from 1875 to 2018 for Jakobshavn Isbræ. b Frontal positions from 1880 to 2018 for Kangerlussuaq Glacier. c Frontal positions from 1880 to 2018 for Helheim Glacier. d Bed elevation contour map of Jakobshavn Isbræ. e Bed elevation contour map of Kangerlussuaq Glacier. f Bed elevation contour map of Helheim Glacier.
Fig. 3
Fig. 3. Retreat of Jakobshavn Isbræ.
Retreat and surface elevation in meter of Jakobshavn Isbræ in 1875, 1902, 1913, 1931, 1946, 1959, 1964, 1987, 2002, and 2012.
Fig. 4
Fig. 4. Ice mass change.
Time series of accumulated ice mass change from 1880 to 2012 for a Jakobshavn Isbræ. b Kangerlussuaq Glacier. c Helheim Glacier. Negative values denote mass loss. Black dashed curve denotes total observed ice mass loss change and the vertical bars denote uncertainty. The blue curve denotes SMB. Map of Greenland is shown in lower left corner and the red area denotes drainage area of the considered glacier. Right axis shows sea level change in mm and the left axis shows the corresponding ice mass change in gigaton.
Fig. 5
Fig. 5. Relative local sea level change.
Relative local sea level change during 1880–2012 in metres for a Jakobshavn Isbræ (top), b Kangerlussuaq Glacier, c Helheim Glacier caused by combined effect of elastic uplift, sea level change due to reduced gravity and uplift due to glacial isostatic adjustment.

References

    1. Bamber JL, Oppenheimer M, Kopp RE, Aspinall WP, Cooke RM. Ice sheet contributions to future sea-level rise from structured expert judgment. Proc. Nat. Acad. Sci. 2019;116:11195–11200. doi: 10.1073/pnas.1817205116. - DOI - PMC - PubMed
    1. Aschwanden A, et al. Contribution of the Greenland Ice Sheet to sea level over the next millennium. Sci. Adv. 2019;6:eaav9396. doi: 10.1126/sciadv.aav9396. - DOI - PMC - PubMed
    1. Price SF, Payne AJ, Howat IM, Smith BE. Committed sea-level rise for the next century from Greenland ice sheet dynamics during the past decade. Proc. Nat. Acad. Sci. 2011;108:8978–8983. doi: 10.1073/pnas.1017313108. - DOI - PMC - PubMed
    1. Nick FM, et al. Future sea-level rise from Greenland’s main outlet glaciers in a warming climate. Nature. 2013;497:235–238. doi: 10.1038/nature12068. - DOI - PubMed
    1. Morlighem M, Wood M, Seroussi H, Choi Y, Rignot E. Modeling the response of northwest Greenland to enhanced ocean thermal forcing and subglacial discharge. Cryosphere. 2019;13:723–734. doi: 10.5194/tc-13-723-2019. - DOI

Publication types