. 2020 Nov 17;11(1):5829.
doi: 10.1038/s41467-020-19509-y.

Infection fatality rate of SARS-CoV2 in a super-spreading event in Germany

Affiliations

Infection fatality rate of SARS-CoV2 in a super-spreading event in Germany

Hendrik Streeck et al. Nat Commun. .

Abstract

A SARS-CoV2 super-spreading event occurred during carnival in a small town in Germany. Due to the rapidly imposed lockdown and its relatively closed community, this town was seen as an ideal model to investigate the infection fatality rate (IFR). Here, a 7-day seroepidemiological observational study was performed to collect information and biomaterials from a random, household-based study population. The number of infections was determined by IgG analyses and PCR testing. We found that of the 919 individuals with evaluable infection status, 15.5% (95% CI:[12.3%; 19.0%]) were infected. This is a fivefold higher rate than the reported cases for this community (3.1%). 22.2% of all infected individuals were asymptomatic. The estimated IFR was 0.36% (95% CI:[0.29%; 0.45%]) for the community and 0.35% [0.28%; 0.45%] when age-standardized to the population of the community. Participation in carnival increased both infection rate (21.3% versus 9.5%, p < 0.001) and number of symptoms (estimated relative mean increase 1.6, p = 0.007). While the infection rate here is not representative for Germany, the IFR is useful to estimate the consequences of the pandemic in places with similar healthcare systems and population characteristics. Whether the super-spreading event not only increases the infection rate but also affects the IFR requires further investigation.


Conflict of interest statement

The authors declare no competing interests.

Figures

Fig. 1
Fig. 1. Timeline of the SARS-CoV2 super-spreading event and enrollment of study participants.
a On February 15, 2020, a carnival celebration became a SARS-CoV2 super-spreading event in the German community of Gangelt. The resulting increase in SARS-CoV2-infected people was instantly countered by a complete shutdown (schools, restaurants, stores, etc.). As a result, the number of reported cases (PCRrep) reached its peak around March 13 (85 reported in a four-day period) and declined thereafter, with 48 new cases reported in the seven-day study period (March 30 to April 6). Thus, at the starting point of the study (March 30), the main wave of new infections had already passed. The number of PCR-positive cases found in the study population (PCRnew) was 33 (four of those reported PCR positive in the past). This situation in the community of Gangelt was ideal to assess the cumulative real number of SARS-CoV2-infected individuals (area within dotted line: PCRrep, PCRnew and anti-SARS-CoV2 IgG/A). b Enrollment and flow of participants through the study.
Fig. 2
Fig. 2. IgA and IgG levels and number of SARS-CoV2 infected in the study population.
IgA and IgG were quantified (Euroimmun ELISA) in single plasma samples obtained from the study participants at one time point during the seven-day acquisition period. a IgG plotted against IgA in plasma of 919 study participants (log-scale, r = 0.778). The gray line indicates equality of log(IgA) and log(IgG). b Estimated percentage of IgA reactives (>0.8; black circle: 10.63% [7.48%; 13.88%]; gray circle: raw sample proportion 170/919, 18.50%) and IgG reactives (>0.8; black circle: 14.11% [11.15%; 17.27%]; gray circle: raw sample proportion, 125/919, 13.60%). Estimates were corrected for household clustering (cluster bootstrap) and for sensitivity and specificity (matrix method) of the IgA (sensitivity 100%; specificity 91.2%) and IgG (sensitivity 90.9%; specificity 99.1%) ELISA. Error bars refer to 95% confidence intervals. c Absolute numbers of IgG reactives (rectangle with black border), PCRnew positives (rectangle with dashed border, left side) and PCRrep positives (rectangle with dashed border, right side) as well as the respective overlaps of values (percentages in brackets). The number of infected (total gray area) is defined as participants positive for at least one of either IgG, PCRnew, or PCRrep (138/919, 15.02%; raw percentages not corrected for sensitivity and specificity). d NT titers were determined by a microneutralization assay using 100 TCID50. Titers indicate the reciprocal value of the plasma dilutions that protect 50% of the wells at incubation with 100 TCID50. Samples able to suppress the cytopathic effect (CPE) in at least all three wells of the 1:2 dilution (NT titer ≥ 2.8) are depicted above the dashed line. Samples for which the CPE was suppressed in one or two wells of the 1:2 dilution are shown directly below the dashed line. Samples showing a CPE in all wells with either equal or reduced severity compared to the negative control were depicted at the level of the x-axis. e Samples below the dashed line in d were re-evaluated using a plaque reduction neutralization test (PRNT). The neutralizing titers were calculated as the reciprocal of serum dilutions resulting in neutralization of 50% input virus (NT50). Dotted line: upper borderline for ELISA IgG ratio. Source data for b is provided as a Source Data file.
Fig. 3
Fig. 3. Estimation of the SARS-CoV2 infection rate and the IFR.
a The number of SARS-CoV2-positive reported cases in the study population is r = 22. The observed number of infected in the study population is known from the data available (at least one of either IgG + , PCRnew + or PCRrep + , i = 138). The ratio of i/n (study participants, 919) = 0.1502 is a raw estimate of the number of infected in the whole population of Gangelt (i = 0.1502 × 12,597 ≈ 1892). A raw estimate of the IFR in Gangelt is given by the number of SARS-CoV2-associated deaths (f = 7)/(i = 1892) = 0.370%. b The infection rates estimated from the IgG and PCR data in the study population, corrected for both sensitivity/specificity of the ELISA (matrix method) and household clustering (cluster bootstrap), is 15.53% [12.31%; 18.96%] (left bar, dark gray). An additional correction was made for the underrepresentation of reported PCR positive (PCRrep + ) in the study population (22/919 = 0.0239) as compared to the real proportion of PCRrep + in Gangelt (388/12,597 = 0.0308), increasing the infection rate by the factor 0.0308/0.0239 = 1.2866 to 19.98% [14.13%; 32.00%] (third bar from left, dark gray). Note that the latter confidence interval accounts for additional uncertainty in the correction factor. The bars in light gray depict the values corrected for a theoretical specificity of the ELISA of 98% (light gray) instead of the 99% provided on the data sheet of the company. c Infection fatality rate calculated based on the estimated infection rate and the number of SARS-CoV2-associated deaths (7 by the end of the acquisition period, mean age 80.8 ± 3.5 years, age range 76 years to 85 years). Similar to the infection rates in b, the estimated IFR of 0.36% [0.29%; 0.45%] (left bar) may be an estimate at the upper limit of the real IFR in Gangelt. IFR estimates were obtained by dividing the number of SARS-CoV2-associated deaths (7) by the point estimates and 95% CI limits of the infection rates in b. Source data for b, c are provided as a Source Data file.
Fig. 4
Fig. 4. Number of symptoms and Ig in SARS-CoV2-infected study participants.
Clinical symptoms reportedly associated with SARS-CoV2-infection were analyzed (questionnaire data). a Estimated mean number of symptoms in non-infected study participants (1.61 [1.42; 1.81]) and SARS-CoV2-infected study participants (3.58 [3.01; 4.27], Poisson GEE model, estimated relative mean increase in infected = 2.23 [1.82; 2.73], p < 0.001, rho = 0.248 [0.164; 0.332]; Poisson GEE model adjusted for age and sex: estimated relative mean increase in infected = 2.18 [1.78; 2.66], p < 0.001, rho = 0.250 [0.167; 0.333]). Results are based on the 876 study participants without missing values in any of the symptom items (range of the observed numbers of symptoms: 0 to 12, mean = 1.92, sd = 2.59, median = 1). Bars refer to the empirical mean values. b Raw percentages of symptoms in the 126 SARS-CoV2-infected study participants without missing values for any of the symptoms. Of the SARS-CoV2 infected, 22.22% reported that they did not have any (most left bar on x-axis: 0) of the 15 symptoms. Numbers above bars indicate the total number of individuals in the respective group. c IgA and IgG levels and intensity of symptoms. The boxplots depict the log(IgA) (light gray) and log(IgG) (dark gray) levels in the 126 infected study participants. In a quasi-Poisson model, no association between the number of symptoms (response variable) and log(IgA) (covariable) was found. Similar results were obtained from a quasi-Poisson model with the number of symptoms as response variable and log(IgG) as covariable. Note: Quasi-Poisson models were used instead of Poisson GEE models because the number of households was large relative to the number of analyzed study participants. All statistical tests were two-sided. No adjustments for multiple comparisons were made. Source data are provided as a Source Data file.
Fig. 5
Fig. 5. Association between household cluster size and the per-person infection risk.
Owing to the sampling procedure, study participants were clustered within households. a Estimated per-person infection risk by household cluster size (black dots; 95% CIs: gray lines). Estimates and CI limits were determined by fitting a logistic GEE model with the infection status as response variable and household cluster size as a factor covariable. No association between household cluster size and the per-person infection risk was found (p = 0.933). b Per-person infection risk in household clusters in which at least one person was found infected (black curve based on 86 household clusters, with 213 persons). The gray line below the black curve shows the expected per-person infection risk under the assumption that infection statuses of the household cluster members are independent. Estimates and CI limits were determined by fitting a logistic GEE model with the infection status as response variable and household cluster size as a factor covariable (excluding 13 household clusters of size 1 each). An association between household cluster size and the per-person infection risk was found (p < 0.001). The excess per-person infection risks are given by the deviations of the black curve from the gray reference curve (71.79% – 54.21%  = 17.59%, 57.14% – 39.09% = 18.05%, and 38.75% – 31.64% = 7.11%, respectively, for 2-, 3-, and 4-person household clusters). Under the assumption that transmissions to household members occurred independently and were due to only one infected person in each household, the black curve further allows for an estimation of the secondary infection risk: Assigning a 100% risk to the already infected household member, these risk estimates are given by (71.79% × 2 – 100%) = 43.59%, (57.14% × 3 – 100%)/2 = 35.71%, and (38.75% × 4 –  100%)/3 = 18.33%, respectively, for 2-, 3-, and 4-person household clusters (compared to an unconditional estimated infection risk of 15.53%). All statistical tests were two-sided. No adjustments for multiple comparisons were made. Source data are provided as a Source Data file.
Fig. 6
Fig. 6. Associations of sex, age, and co-morbidities with infection rate.
a Estimated rates of infected in the study participants (filled circles, with 95% CIs) for male participants (dark gray) and female participants (light gray) stratified by age groups. Estimates were obtained by fitting logistic GEE models with the infection status as response variable and age as covariable (rho = 0.256 [0.104; 0.407] and rho = 0.244 [0.154; 0.334], respectively, in the male and female subgroups). Bars refer to the raw percentages. In a logistic GEE model with both sex and age as covariables, neither sex (OR = 1.28 [0.95; 1.73] for females, p = 0.101) nor age (OR = 1.03 [0.94; 1.14] per 10 years, p = 0.539) were found to be associated with infection status. Numbers above bars indicate the total number of individuals in the respective group. Centers of error bars refer to point estimates. b For each of the co-morbidities, the infection rate (%) was determined by fitting a logistic GEE model with infection status as response variable to the data of all study participants (light gray: co-morbidity present (+), dark gray: co-morbidity not present (-)). Point estimates obtained from the GEE models are represented by filled circles (with 95% CIs). The bars represent the raw percentages of infected in each of the subgroups (calculated from the participant numbers shown above the bars). No associations between the infection status and any of the co-morbidities were found (according to Bonferroni–Holm corrected p-values). Associations remained insignificant in GEE models that included sex and age as additional covariables. Raw proportions are indicated above bars. Centers of error bars refer to point estimates. Error bars refer to 95% confidence intervals. All statistical tests were two-sided. Adjustments for multiple comparisons were made as indicated. Source data are provided as a Source Data file.
Fig. 7
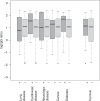
Fig. 7. Associations between IgG levels, co-morbidities, and celebrating carnival in the infected study participants.
The boxplots depict the log(IgG) levels of the infected study participants in subgroups defined by the presence of co-morbidities and celebrating carnival. In Gaussian models with log(IgG) as response variable, no associations between log(IgG), the co-morbidities, and celebrating carnival were found. Analysis was based on the 127 infected study participants that had complete data in the co-morbidity and carnival variables. Absolute numbers of study participants (left to right): 19, 108, 15, 112, 6, 121, 11, 116, 7, 120, 85, 42. Source data are provided as a Source Data file.
Fig. 8
Fig. 8. Associations of super-spreading event with infection rate and symptoms.
a The association with the lifestyle factor “celebrating carnival” was analyzed (questionnaire “have you celebrated carnival?” yes/no). Celebrating carnival was not limited to attending the main carnival event (Kappensitzung in Gangelt). Estimated infection rate (%; with 95% CIs) of participants not celebrating carnival (light gray) and participants celebrating carnival (dark gray). Point estimates (filled circles) and CIs were obtained by fitting a logistic GEE model with infection status as response variable and carnival (yes/no) as a factor covariable. The bars represent the raw percentage values. There was a positive association between celebrating carnival and infection status (OR = 2.56 [1.67; 3.93], p < 0.001, rho = 0.351 [0.162; 0.540]). Similar results were obtained when adding sex and age as covariables to the GEE model (OR = 3.08 [1.92; 4.95], p < 0.001, rho = 0.340 [0.126; 0.554]). Analyses were based on the 915 participants that had complete data in both the carnival and the infection variables. Error bars refer to 95% confidence intervals. b Estimated mean number of symptoms in infected participants not celebrating carnival (light gray) and in infected participants celebrating carnival (dark gray). Point estimates (filled circles) and CIs were obtained by fitting a quasi-Poisson model with the number of symptoms as response variable and carnival (yes/no) as a factor covariable. The quasi-Poisson model was used instead of a Poisson GEE model because the number of households was large relative to the number of analyzed study participants. There was a positive association between celebrating carnival and the number of symptoms (estimated relative mean increase = 1.63 [1.15; 2.33], p = 0.007). Similar results were obtained when adding sex and age as covariables to the model (estimated relative mean increase = 1.62 [1.12; 2.34], p = 0.011). Analyses were based on the 124 infected participants that had complete data in both the carnival and infection variables. Error bars refer to 95% confidence intervals. c Raw percentages of infected participants celebrating carnival, grouped by their numbers of symptoms. Numbers above bars indicate the total number of individuals in the respective group. All statistical tests were two-sided. Adjustments for multiple comparisons were made as indicated. Source data are provided as a Source Data file.

References

    1. World Health Organization. Coronavirus (COVID-19) Dashboard. WHO, https://covid19.who.int/ (2020).
    1. Mizumoto, K., Kagaya, K., Zarebski, A. & Chowell, G. Estimating the asymptomatic proportion of coronavirus disease 2019 (COVID-19) cases on board the Diamond Princess cruise ship, Yokohama, Japan, 2020. Euro Surveill. 25, 2000180 (2020). - PMC - PubMed
    1. Lai, C. C. et al. Asymptomatic carrier state, acute respiratory disease, and pneumonia due to severe acute respiratory syndrome coronavirus 2 (SARS-CoV-2): facts and myths. J. Microbiol. Immunol. Infect.53, 404–412 (2020). - PMC - PubMed
    1. The Centre for Evidence-Based Medicine. Global Covid-19 Case Fatality Rates. CEBM, https://www.cebm.net/covid-19/global-covid-19-case-fatality-rates/ (2020).
    1. Feng, Y. et al. COVID-19 with different severity: a multi-center study of clinical features. Am. J. Respir. Crit. Care Med.201, 1380–1388 (2020). - PMC - PubMed

Publication types

MeSH terms

Substances