. 2020 Nov 17;10(1):19946.
doi: 10.1038/s41598-020-76248-2.

Ecological drivers of genetic connectivity for African malaria vectors Anopheles gambiae and An. arabiensis

Affiliations

Ecological drivers of genetic connectivity for African malaria vectors Anopheles gambiae and An. arabiensis

Elizabeth Hemming-Schroeder et al. Sci Rep. .

Abstract

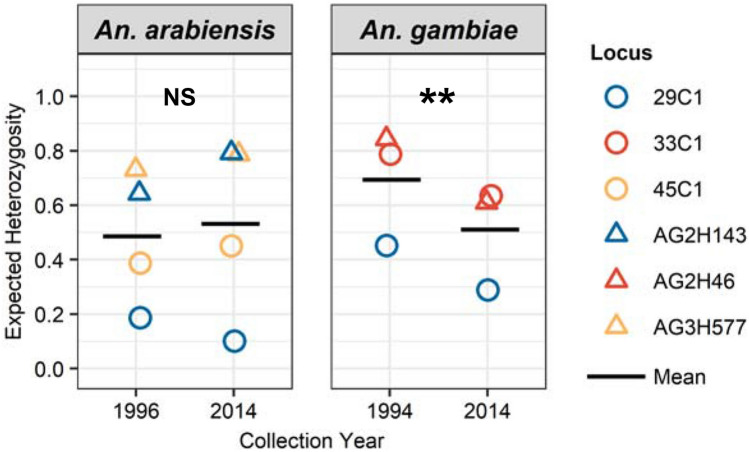
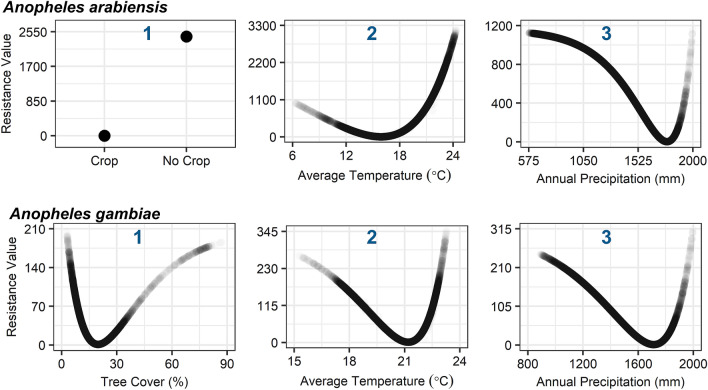
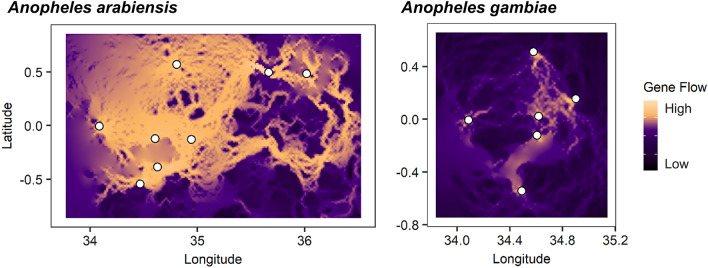
Anopheles gambiae and An. arabiensis are major malaria vectors in sub-Saharan Africa. Knowledge of how geographical factors drive the dispersal and gene flow of malaria vectors can help in combatting insecticide resistance spread and planning new vector control interventions. Here, we used a landscape genetics approach to investigate population relatedness and genetic connectivity of An. gambiae and An. arabiensis across Kenya and determined the changes in mosquito population genetic diversity after 20 years of intensive malaria control efforts. We found a significant reduction in genetic diversity in An. gambiae, but not in An. arabiensis as compared to prior to the 20-year period in western Kenya. Significant population structure among populations was found for both species. The most important ecological driver for dispersal and gene flow of An. gambiae and An. arabiensis was tree cover and cropland, respectively. These findings highlight that human induced environmental modifications may enhance genetic connectivity of malaria vectors.


Conflict of interest statement

The authors declare no competing interests.

Figures

Figure 1
Figure 1
Comparison of genetic diversity (expected heterozygosity) between 1994/1996 and 2014 from nearby study sites within the Lake Victoria basin area of western Kenya for Anopheles arabiensis and An. gambiae. **P < 0.01; NS indicates P > 0.05 by paired t-tests. Data from 1996 was obtained from Kamau et al.. Data from 1994 was obtained from Lehmann et al..
Figure 2
Figure 2
Inferred population structure estimated by STRUCTURE among Anopheles arabiensis (K = 3) and An. gambiae (K = 2). (A) Map of mean ancestral coefficients by study location. Pie chart color indicates proportion of population assigned to each ancestral cluster. (B) Individual level ancestral coefficients. Individuals are represented as rows. Horizontal black lines indicate division in sampling location and vertical black bars indicates region of sampling location. The most probable cluster is indicated by color. Within each individual, the extent of the component colors indicates the magnitude of the membership coefficient corresponding to each cluster. The background elevation maps were created from Shuttle Radar Topography Mission (SRTM) data in ArcMap 10.6.1 (https://desktop.arcgis.com/en/arcmap/).
Figure 3
Figure 3
Migration directionality and intensity among Anopheles arabiensis and An. gambiae populations in Kenya. The intensity of gene flow is indicated by the width of migration arrows. Only migration rates with median M > 18 are indicated on the map. The background elevation maps were created from Shuttle Radar Topography Mission (SRTM) data in ArcMap 10.6.1 (https://desktop.arcgis.com/en/arcmap/).
Figure 4
Figure 4
Response curves signifying the relationship between ecological variables and landscape resistance to gene flow in the three highest performing single-surface models for Anopheles gambiae and An. arabiensis. Blue number in plot indicates model ranking by Avg. ΔAIC value.
Figure 5
Figure 5
Gene flow map based on highest performing landscape resistance model for Anopheles gambiae and An. Arabiensis. Black circles indicate sampling locations. Yellow color indicates areas of high hypothesized gene flow between sampling locations. For An. arabiensis, map is based on the cropland model. For An. gambiae, map is based on the tree cover model. The maps were created in R 3.6.0 (https://www.r-project.org/rdata) with output currents from Circuitscape 4.0 (https://circuitscape.org/) based on the highest performing landscape resistance models.

References

    1. World Health Organization . World malaria report 2019. Geneva: WHO; 2019.
    1. Wirtz RA, Burkot TR. Detection of malarial parasites in mosquitoes. In: Maudlin I, Sinha RC, editors. Advances in Disease Vector Research. New York: Sprinter; 1991.
    1. Trape JF, Rogier C. Combating malaria morbidity and mortality by reducing transmission. Parasitol. Today. 1996;12:236–240. doi: 10.1016/0169-4758(96)10015-6. - DOI - PubMed
    1. Mala AO, et al. Plasmodium falciparum transmission and aridity: a Kenyan experience from the dry lands of Baringo and its implications for Anopheles arabiensis control. Malar. J. 2011;10:121. doi: 10.1186/1475-2875-10-121. - DOI - PMC - PubMed
    1. Macdonald G. The Epidemiology and Control of Malaria. London: Oxford Univ. Press; 1957.

Publication types