. 2020 Oct 25;10(26):12011-12025.
doi: 10.7150/thno.51144. eCollection 2020.

AhR activation attenuates calcium oxalate nephrocalcinosis by diminishing M1 macrophage polarization and promoting M2 macrophage polarization

Affiliations

AhR activation attenuates calcium oxalate nephrocalcinosis by diminishing M1 macrophage polarization and promoting M2 macrophage polarization

Xiaoqi Yang et al. Theranostics. .

Abstract

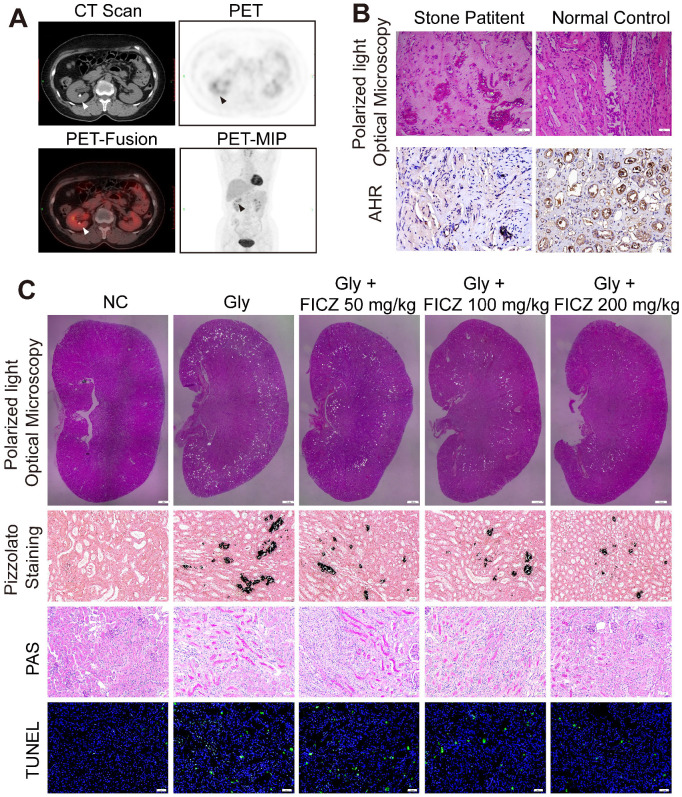
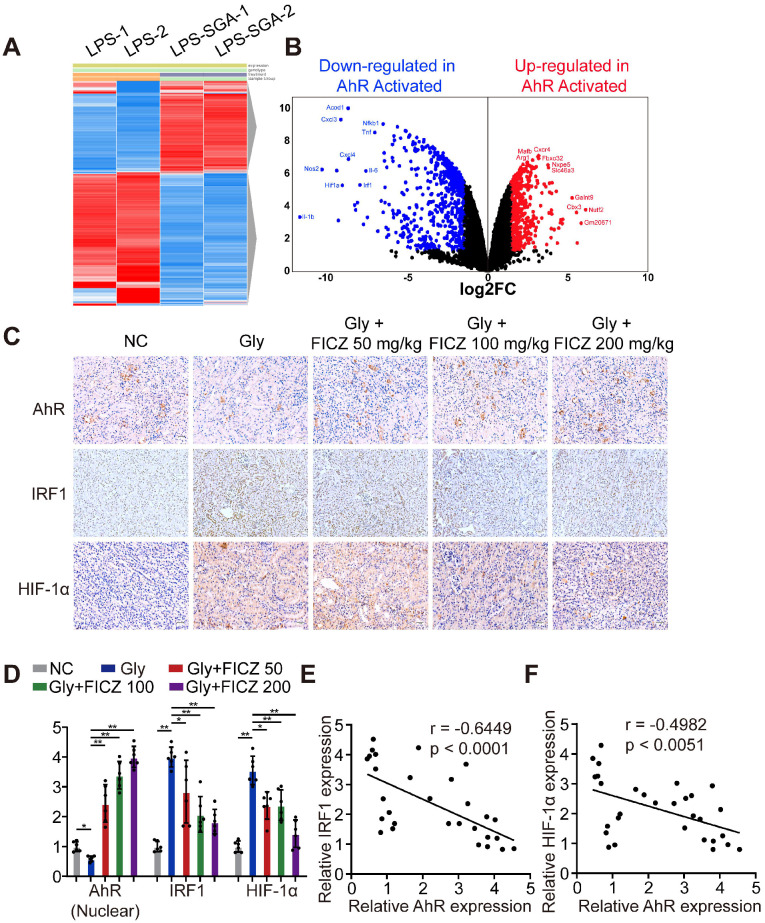
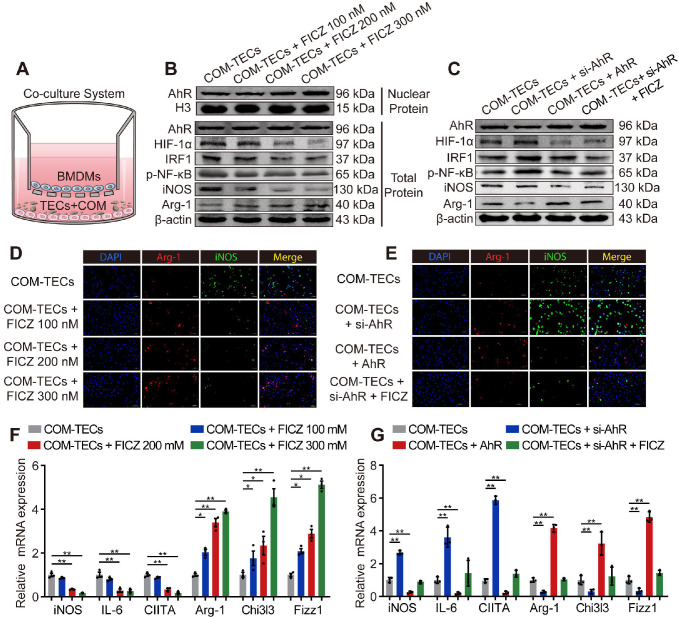
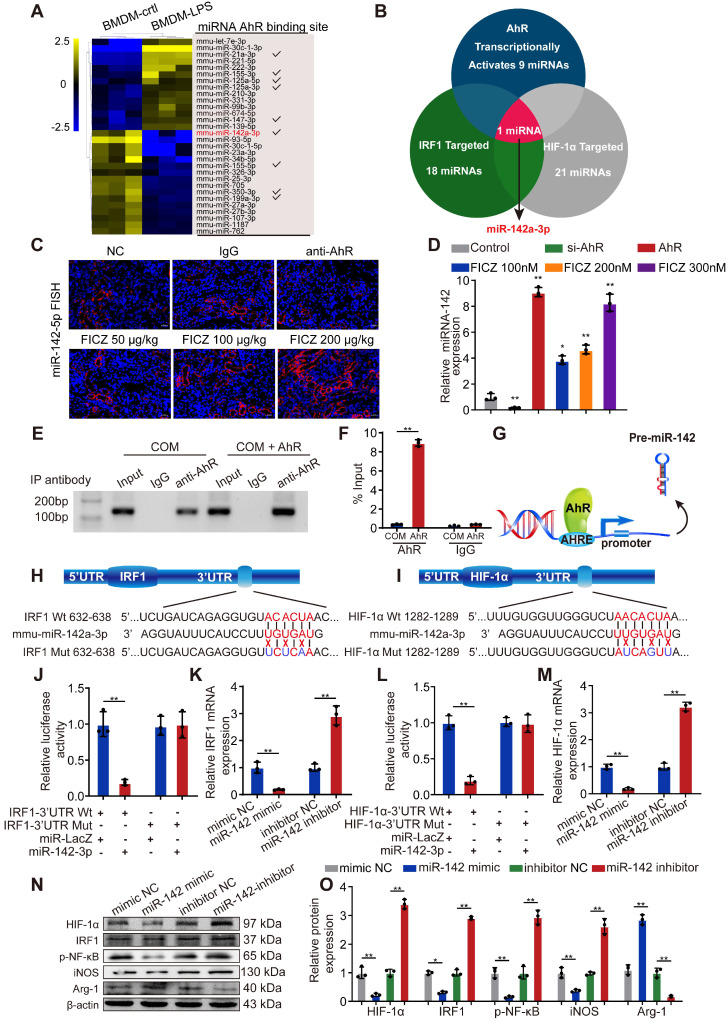
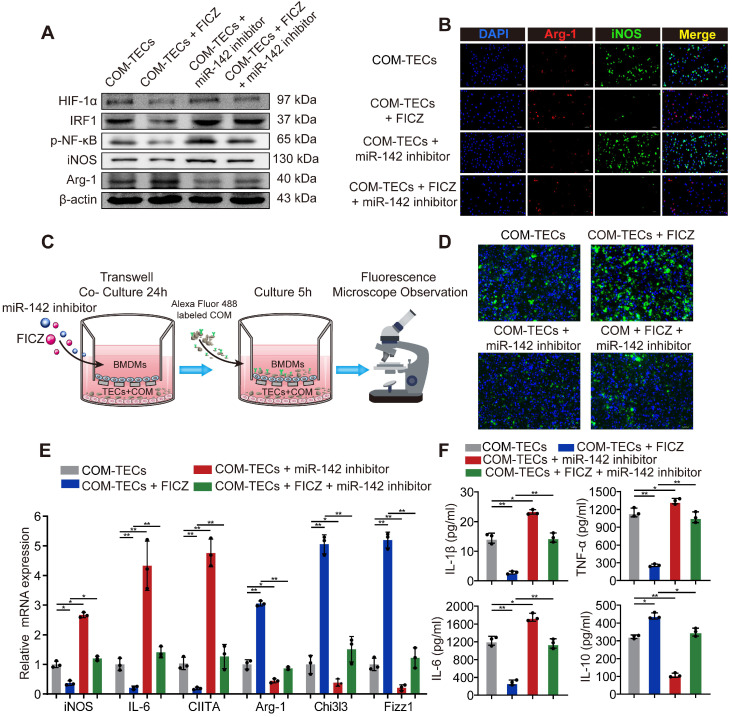
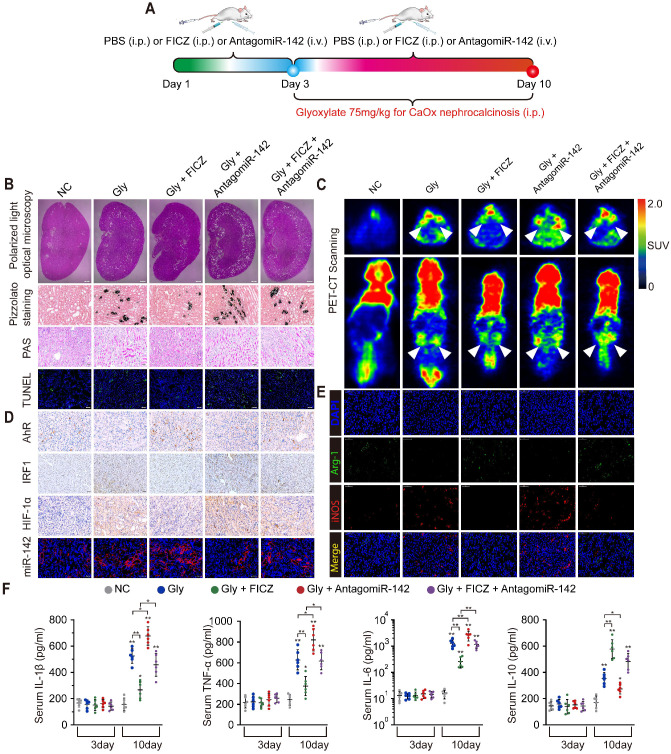
Calcium oxalate (CaOx) crystal can trigger kidney injury, which contributes to the pathogenesis of nephrocalcinosis. The phenotypes of infiltrating macrophage may impact CaOx-mediated kidney inflammatory injury as well as crystal deposition. How aryl hydrocarbon receptor (AhR) regulates inflammation and macrophage polarization is well understood; however, how it modulates CaOx nephrocalcinosis remains unclear. Methods: Mice were intraperitoneally injected with glyoxylate to establish CaOx nephrocalcinosis model with or without the treatment of AhR activator 6-formylindolo(3,2-b)carbazole (FICZ). Positron emission tomography computed tomography (PET-CT) imaging, Periodic acid-Schiff (PAS) staining, and polarized light optical microscopy were used to evaluate kidney injury and crystal deposition in mice kidney. Western blotting, immunofluorescence, chromatin immunoprecipitation, microRNA-fluorescence in situ hybridization, and luciferase reporter assays were applied to analyze polarization state and regulation mechanism of macrophage. Results: AhR expression was significantly upregulated and negatively correlated with interferon-regulatory factor 1 (IRF1) and hypoxia inducible factor 1-alpha (HIF-1α) levels in a murine CaOx nephrocalcinosis model following administration of FICZ. Moreover, AhR activation suppressed IRF1 and HIF-1α levels and decreased M1 macrophage polarization in vitro. In terms of the mechanism, bioinformatics analysis and chromatin immunoprecipitation assay confirmed that AhR could bind to miR-142a promoter to transcriptionally activate miR-142a. In addition, luciferase reporter assays validated that miR-142a inhibited IRF1 and HIF-1α expression by directly targeting their 3'-untranslated regions. Conclusions: Our results indicated that AhR activation could diminish M1 macrophage polarization and promote M2 macrophage polarization to suppress CaOx nephrocalcinosis via the AhR-miR-142a-IRF1/HIF-1α pathway.

Keywords: AhR; HIF-1α; IRF1; Macrophage; Nephrocalcinosis.


Conflict of interest statement

Competing Interests: The authors have declared that no competing interest exists.

Figures

Figure 1
Figure 1
High inflammation status and AhR dysregulation in stone patient kidneys while reducing renal inflammation and injury found in AhR-activated CaOx nephrocalcinosis mice. (A) PET-CT imaging studies assessing renal inflammatory responsiveness. Axial CT, axial PET, axial fused PET-CT and coronal PET maximum intensity projection (MIP) images suggesting enhanced renal uptake of 18F-FDG. Arrows are used to mark focal 18F-FDG accumulation in the form of a ring surrounding the stone. (B) crystal deposition in Randall's plaques (n = 10) was analysed via polarized light optical microscopy (100×; scale bar: 20 µm) and IHC staining for AhR in Randall's plaques (200×; scale bar: 20 µm). (C) Deposition of renal CaOx crystal in the corticomedullary junction of mice (n = 6) treated with increasing concentrations of FICZ was analysed via polarized light optical microscopy (20×, scale bar: 500 µm). Crystal deposition within corticomedullary junction regions was further confirmed by Pizzolato staining (200×; scale bar: 20 µm). Kidney injury and necrosis were evaluated by PAS staining (200×; scale bar: 20 µm) and TUNEL staining (200×; scale bar: 50 µm) in kidney tissues, respectively.
Figure 2
Figure 2
AhR significantly suppressed IRF1 and HIF-1α expression in a murine CaOx nephrocalcinosis model. (A) RNA-seq heatmap showing significantly altered mRNAs in SGA-treated BMDMs. (B) Volcano plots showing mRNA transcripts that were differentially expressed between LPS-treated and SGA-treated BMDMs. Significantly downregulated and upregulated mRNAs are shown in green and red, respectively, whereas genes that were not significantly changed are shown in black. (C) IHC staining for AhR, IRF1, and HIF-1α in the kidneys of FICZ-treated mice with CaOx nephrocalcinosis (200×; scale bar: 20 µm). (D) qRT-PCR was used to assess AhR, IRF1, and HIF-1α expression in kidney samples from FICZ-treated mice (n = 6) with CaOx nephrocalcinosis compared to kidney samples from model mice. (E, F) Pearson's correlation coefficient analysis (n = 30) of the expression levels of AhR and IRF1 (E) or HIF-1α (F). Each dot represents an individual animal. *P < 0.05; **P < 0.01, as assessed via one-way ANOVA (D).
Figure 3
Figure 3
AhR suppressed IRF1 and HIF-1α to attenuate CaOx crystal-stimulated M1 macrophage polarization in vitro. (A) BMDMs and COM-treated TECs co-culture model. (B, C) Western blotting analysis was used to detect AhR, HIF-1α, IRF1, NF-κB p65, iNOS, and Arg-1 expression after FICZ treatment and the upregulation or downregulation of AhR in BMDMs. β-actin served as a normalization control. (D, E) iNOS (M1 macrophage marker, green) and Arg-1 (M2 macrophage marker, red) distribution in BMDMs were detected by immunofluorescence (200×; scale bar: 20 µm). (F, G) qRT-PCR analysis of iNOS, IL-6, CIITA, Arg-1, Chi3l3 and Fizz1 expression to further determine polarization state of BMDM. The data are shown as the means ± SD of triplicate experiments. *P < 0.05; **P < 0.01, as assessed via one-way ANOVA (F, G).
Figure 4
Figure 4
AhR transcriptionally activates miR-142a to inhibit IRF1 and HIF-1α expression. (A) The top 30 miRNAs in BMDMs that are regulated by LPS are arranged in a miRNA array heatmap. In addition, miRNAs predicted to be under the transcriptional control of AhR (according to analysis with the JASPAR database) are noted. (B) Venn diagram analyses were performed to identify miRNAs that can both target IRF1 and HIF-1α and that are under the transcriptional control of AhR. (C) Renal expression of mmu-miR-142a-3p in mice (n = 6) with CaOx nephrocalcinosis following treatment with an AhR neutralizing antibody or FICZ treatment was assessed via FISH (200×; scale bar: 20 µm). (D) qRT-PCR was performed to measure mmu-miR-142a-3p expression in BMDMs using U6 RNA as a normalization control. (E, F) ChIP assays and ChIP qPCR analysis showed that AhR bound to the miR-142a promoter in BMDMs treated with the AhR overexpression plasmid. (G) A schematic model showed that AhR directly binds to the miR-142a promoter and activates its transcription. (H, I) WT and mutated miR-142a targeting sequences in the IRF1 and HIF-1α 3'-UTR regions that were used to construct luciferase reporters, with reporters bearing these IRF1 (J) or HIF-1α (L) 3'-UTR sequences co-transfected along with miR-142a mimic (100 nM). IRF1 (K) and HIF-1α (M) mRNA levels were detected via qRT-PCR in BMDMs following miR-142a mimic or inhibitor transfection. Western blotting (N, O) analysis enabled the detection of IRF1 and HIF-1α expression while also assessing the levels of iNOS and Arg-1 to monitor the polarization state of BMDMs following miR-142a mimic or inhibitor transfection. β-actin was employed as a normalization control. The data are shown as the means ± SD of triplicate experiments. *P < 0.05; **P < 0.01, as assessed via Student's t test (D, F) or one-way ANOVA (J-M, O).
Figure 5
Figure 5
AhR activation in vitro decrease M1 macrophage polarization to inhibit kidney inflammation and injury through the AhR-miR-142a-IRF1/HIF-1α axis in vitro. (A) Western blotting analysis enabled the detection of AhR, HIF-1α, IRF1, NF-κB p65, iNOS, and Arg-1 expression in BMDMs. β-actin was detected as an internal control. (B) iNOS (M1 macrophage marker, green) and Arg-1 (M2 macrophage marker, red) distributions in BMDMs were detected by immunofluorescence (200×; scale bar: 20 µm). (C) Schematic diagram of BMDMs phagocytic capacity testing. (D) Fluorescence microscopy was performed to analyse the phagocytic ability of BMDMs (200×; scale bar: 20 µm). (E) qRT-PCR analysis of iNOS, IL-6, CIITA, Arg-1, Chi3l3 and Fizz1 expression to further determine polarization state of BMDM. (F) ELISA was used to quantify cytokine levels in the co-culture media. The data are shown as the means ± SD of triplicate experiments. *P < 0.05; **P < 0.01, as assessed via one-way ANOVA (E, F).
Figure 6
Figure 6
AhR activation suppressed the deposition of CaOx crystal and CaOx nephrocalcinosis-mediated kidney inflammation and injury through the AhR-miR-142a-IRF1/HIF-1α axis in vivo. (A) Experimental overview. (B) The deposition of renal CaOx crystal in FICZ- and/or antagomiR-142a-treated mice was assessed via polarized light optical microscopy (20×; scale bar: 500 µm). Pizzolato staining was employed as a means of detecting these CaOx crystal in corticomedullary tissue, while PAS was utilized to evaluate injury to TECs (200×; scale bar: 20 µm), and TUNEL staining was employed to assess renal TECs death (200×; scale bar: 50 µm). (C) PET-CT scanning was employed as a means of assessing renal inflammation state in CaOx nephrocalcinosis mice. (D) IHC was used to analyse AhR, IRF1, and HIF-1α expression, and FISH was used to detect miR-142a expression in renal tissue (200×; scale bar: 20 µm). (E) iNOS (M1 macrophage marker, red) and Arg-1 (M2 macrophage marker, green) distributions in renal tissues were detected by immunofluorescence (200×; scale bar: 50 µm). (F) On days 3 and 10, the serum pro-inflammatory IL-1β, TNF-α, and IL-6 levels and the anti-inflammatory IL-10 levels were measured by ELISA. n = 6 per group. *P < 0.05; **P < 0.01, as assessed via one-way ANOVA (F).

References

    1. Romero V, Akpinar H, Assimos DG. Kidney stones: a global picture of prevalence, incidence, and associated risk factors. Rev Urol. 2010;12:e86–96. - PMC - PubMed
    1. Zeng G, Mai Z, Xia S, Wang Z, Zhang K, Wang L. et al. Prevalence of kidney stones in China: an ultrasonography based cross-sectional study. BJU Int. 2017;120:109–16. - PubMed
    1. Evan AP. Physiopathology and etiology of stone formation in the kidney and the urinary tract. Pediatr Nephrol. 2010;25:831–41. - PMC - PubMed
    1. Mulay SR, Kulkarni OP, Rupanagudi KV, Migliorini A, Darisipudi MN, Vilaysane A. et al. Calcium oxalate crystals induce renal inflammation by NLRP3-mediated IL-1beta secretion. J Clin Invest. 2013;123:236–46. - PMC - PubMed
    1. Liu H, Ye T, Yang X, Liu J, Jiang K, Lu H. et al. H19 promote calcium oxalate nephrocalcinosis-induced renal tubular epithelial cell injury via a ceRNA pathway. EBioMedicine. 2019;50:366–78. - PMC - PubMed

Publication types

MeSH terms