. 2020 Oct 26;10(26):12072-12089.
doi: 10.7150/thno.51231. eCollection 2020.

YTHDF1-enhanced iron metabolism depends on TFRC m6A methylation

Affiliations

YTHDF1-enhanced iron metabolism depends on TFRC m6A methylation

Jing Ye et al. Theranostics. .

Abstract

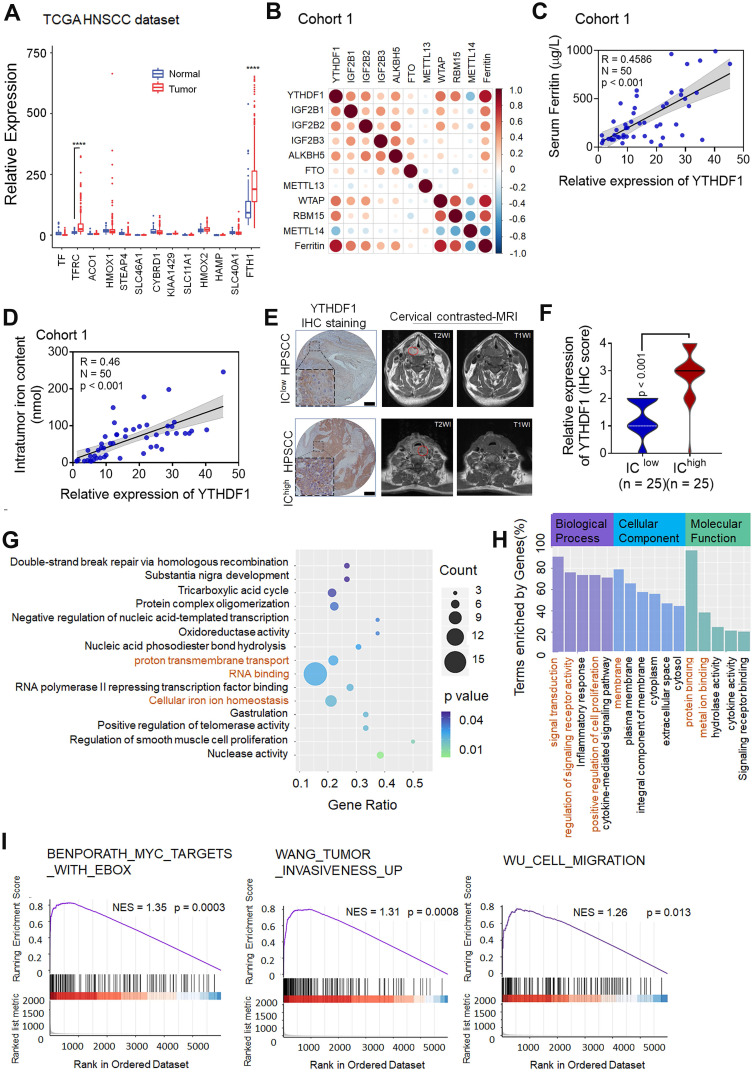
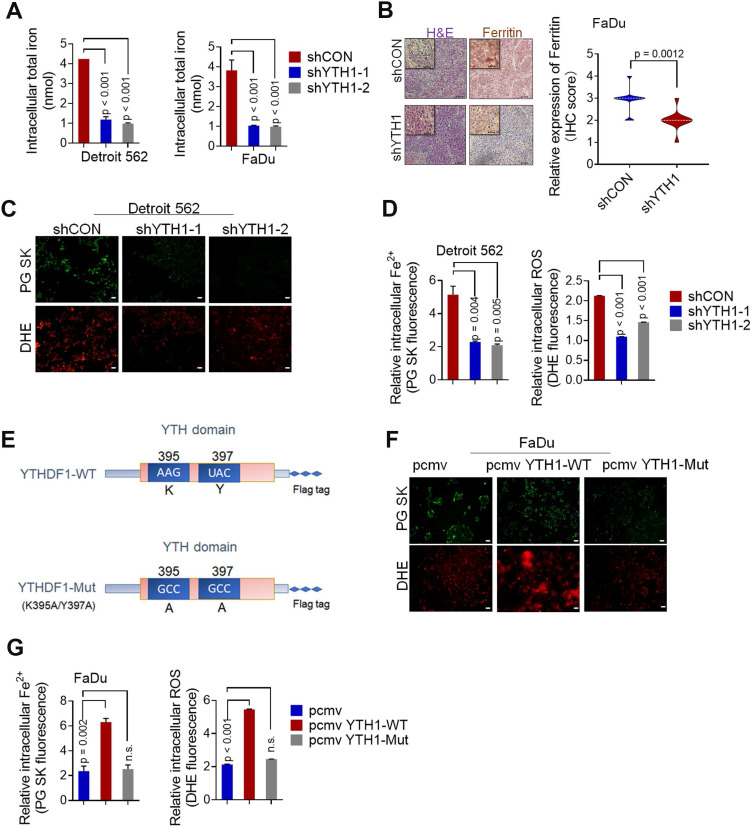
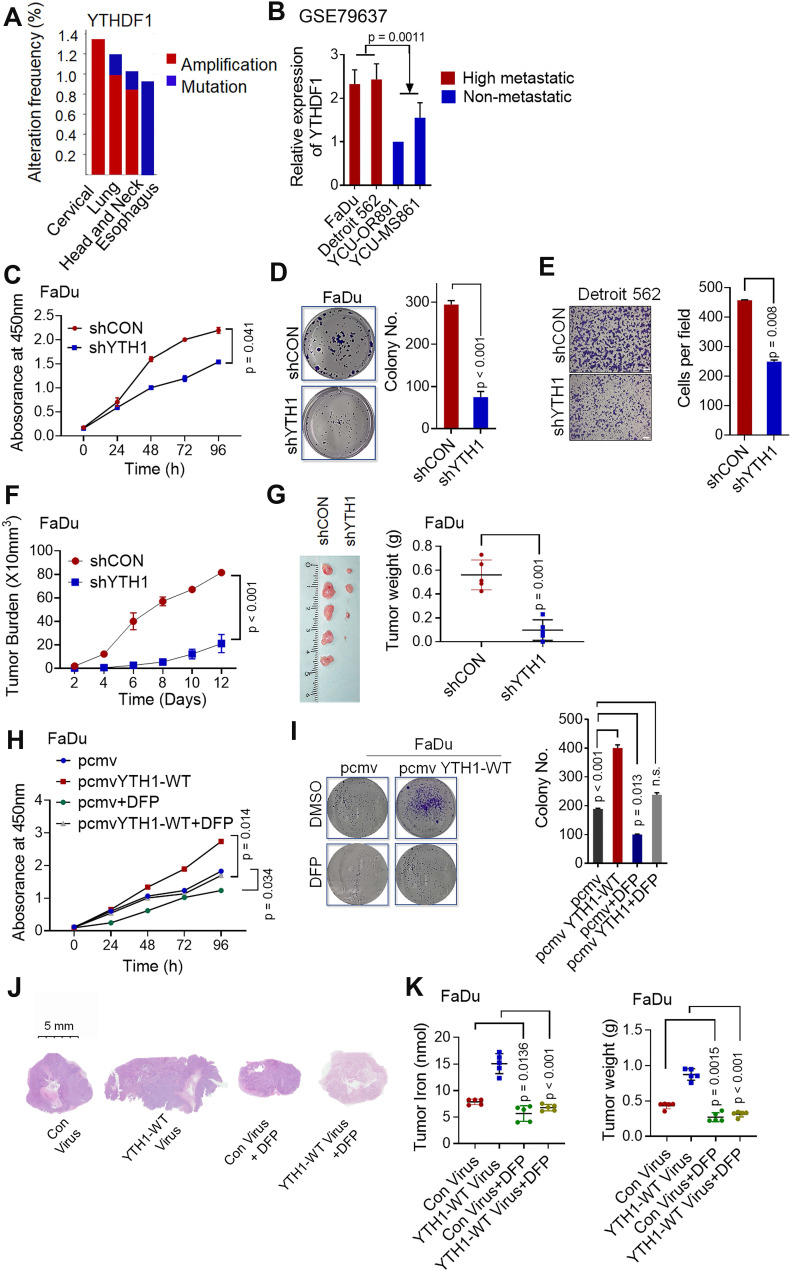
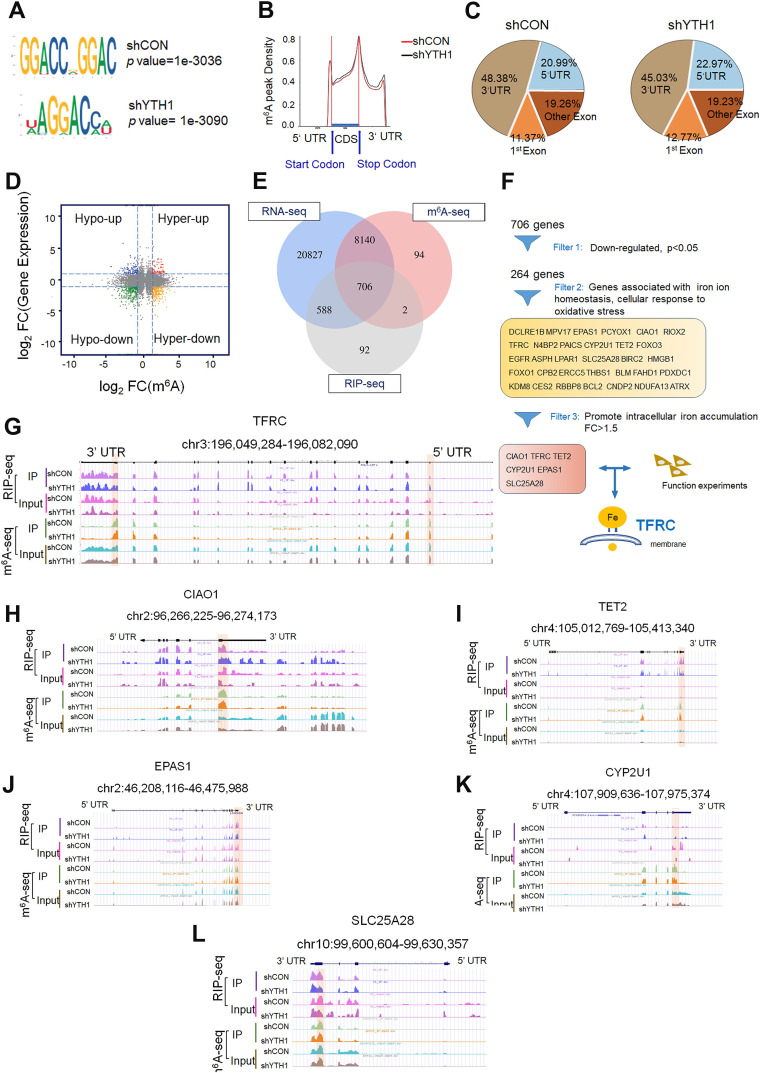
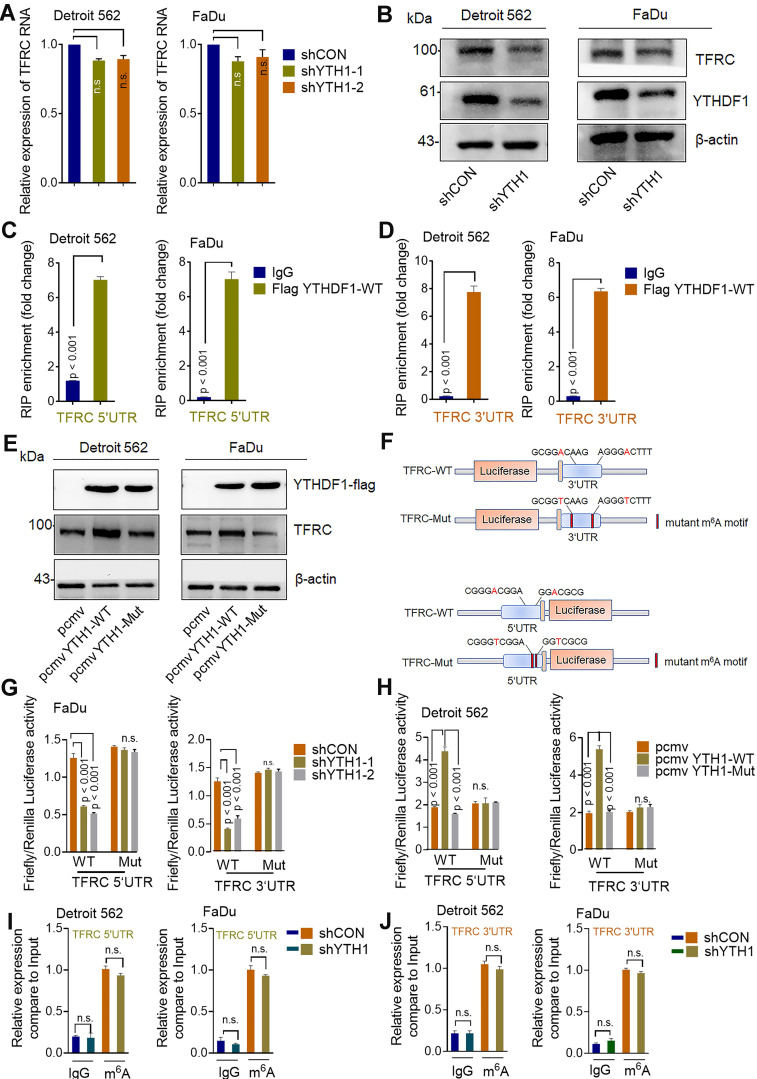
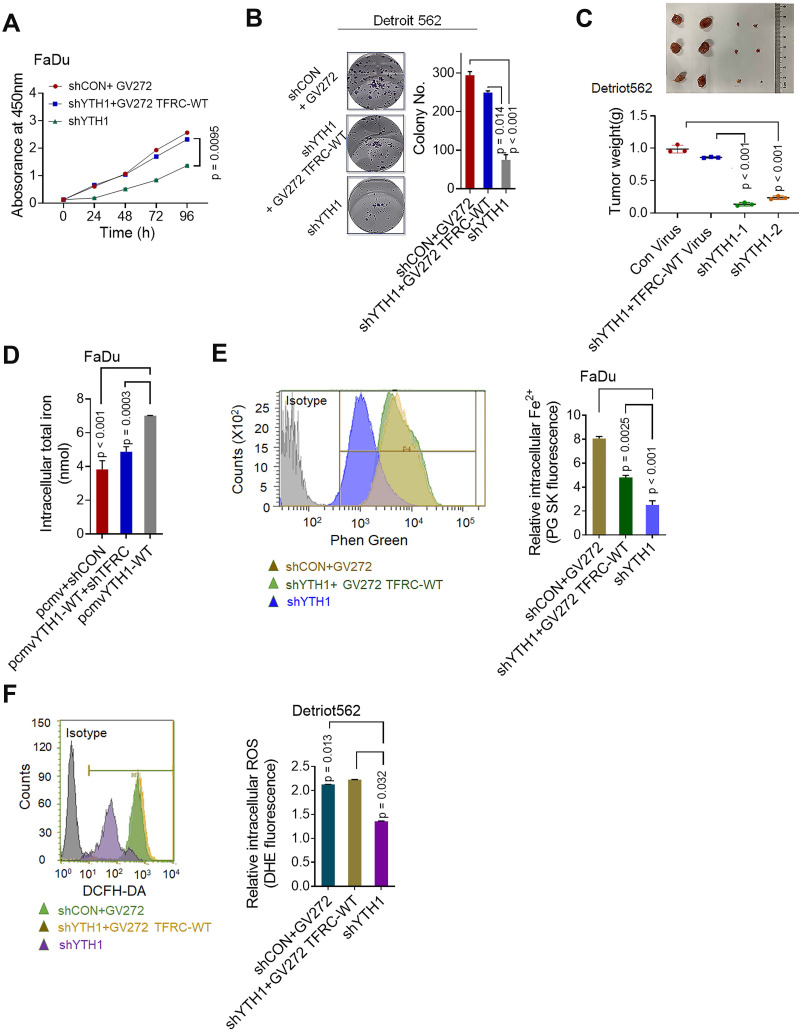
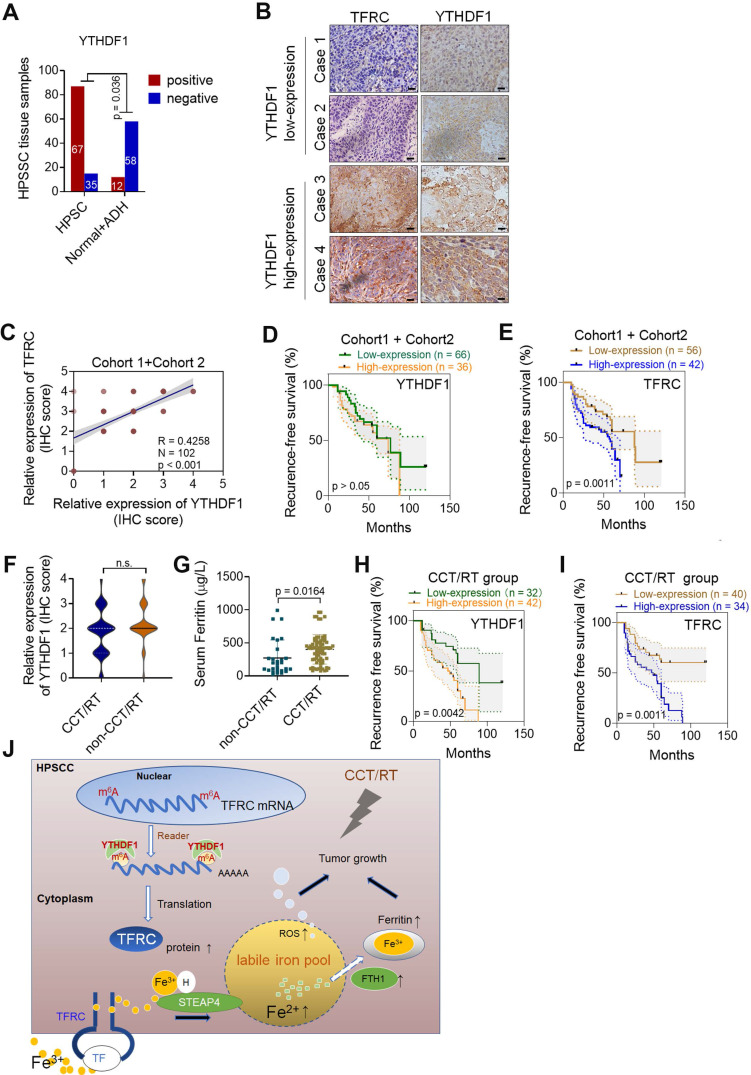
Background: Among head and neck squamous cell carcinomas (HNSCCs), hypopharyngeal squamous cell carcinoma (HPSCC) has the worst prognosis. Iron metabolism, which plays a crucial role in tumor progression, is mainly regulated by alterations to genes and post-transcriptional processes. The recent discovery of the N6-methyladenosine (m6A) modification has expanded the realm of previously undiscovered post-transcriptional gene regulation mechanisms in eukaryotes. Many studies have demonstrated that m6A methylation represents a distinct layer of epigenetic deregulation in carcinogenesis and tumor proliferation. However, the status of m6A modification and iron metabolism in HPSCC remains unknown. Methods: Bioinformatics analysis, sample analysis, and transcriptome sequencing were performed to evaluate the correlation between m6A modification and iron metabolism. Iron metabolic and cell biological analyses were conducted to evaluate the effect of the m6A reader YTHDF1 on HPSCC proliferation and iron metabolism. Transcriptome-wide m6A-seq and RIP-seq data were mapped to explore the molecular mechanism of YTHDF1 function in HPSCC. Results: YTHDF1 was found to be closely associated with ferritin levels and intratumoral iron concentrations in HPSCC patients at Sir Run Run Shaw Hospital. YTHDF1 induced-HPSCC tumorigenesis depends on iron metabolism in vivo in vitro. Mechanistically, YTHDF1 methyltransferase domain interacts with the 3'UTR and 5'UTR of TRFC mRNA, then further positively regulates translation of m6A-modified TFRC mRNA. Gain-of-function and loss-of-function analyses validated the finding showing that TFRC is a crucial target gene for YTHDF1-mediated increases in iron metabolism. Conclusion: YTHDF1 enhanced TFRC expression in HPSCC through an m6A-dependent mechanism. From a therapeutic perspective, targeting YTHDF1 and TFRC-mediated iron metabolism may be a promising strategy for HPSCC.

Keywords: Hypopharyngeal squamous cell carcinoma; Iron metabolism; N6-methyladenosine (m6A) modification; TFRC; YTHDF1.


Conflict of interest statement

Competing Interests: The authors have declared that no competing interest exists.

Figures

Figure 1
Figure 1
YTHDF1 is closely correlated with iron metabolism in HPSCC cells. (A) The results of iron regulatory gene expression assessments determined by RNA-seq with TCGA data are shown. *p < 0.05; **p < 0.01; ***p < 0.001; ***p < 0.0001. (B) The correlation matrix shows the relationship between the expression of m6A-modified genes and serum ferritin levels in 50 HPSCC patients in cohort 1. The expression of m6A- modified genes was detected by quantitative real-time PCR (qPCR). (C) Correlation between YTHDF1 expression and serum ferritin level in 50 HPSCC patients from cohort 1. YTHDF1 expression was detected by qPCR. (D) Correlation between YTHDF1 expression and intratumoral iron content (nmol) in 50 HPSCC patients from cohort 1. YTHDF1 expression was detected by qPCR. (E) Representative cervical contrast MR images and YTHDF1 IHC images of samples from HPSCC patients with high and low intratumoral iron concentrations (ICs) in cohort 1. Representative T1- and T2-weighted (WI) cervical MR images of patients with different levels of iron overload. Scale bar = 100 µm (10×, 40×). (F) Statistical analysis of the relative expression of YTHDF1 (IHC score) in HPSCC patients with high and low ICs based on unpaired Student's t-tests. (G-H) Gene Ontology (GO) (G) and Kyoto Encyclopedia of Genes and Genomes (KEGG) (H) analyses of 860 significantly enriched upregulated genes and 889 significantly enriched downregulated genes as identified by RNA-seq. (I) GSEA plots showing the pathways of differentially expressed genes altered by YTHDF1 and involved in HPSCC.
Figure 2
Figure 2
YTHDF1 promotes iron metabolism in HPSCC cells. (A) Intracellular iron levels (nmol) were measured using an iron assay kit with Detroit 562 and FaDu HPSCC cells transfected with shCON or shYTHDF1. (B) Xenograft tumor masses harvested from shCON- or shYTHDF1-transfected FaDu cells. Representative images of H&E stained cells were used to evaluate ferritin expression. (C) Representative fluorescence microscopy was used to evaluate intracellular Fe2+ and ROS levels in Detroit 562 cells transfected with shCON or shYTHDF1 and then stained with Phen Green (green) and LDH (red). Scale bar = 100 µm. (D) Quantification of Phen Green- and LDH-positive cells shown in (b), analysed by flow cytometry. The ratio of the mean fluorescence intensity (MFI) was calculated for each sample. The data were normalized to those of the control samples as shown by the relative Fe2+ or ROS ratios. (E) Schematic representation of the wild-type (YTHDF1-WT) and mutant (YTHDF1-Mut) YTHDF1 constructs. (F) Representative fluorescence microscopy showing intracellular Fe2+ and ROS levels in Detroit 562 cells transfected with a control vector, pCMV-YTHDF1-WT or pCMV-YTHDF1- Mut plasmid and stained with Phen Green (green) and LDH (red) (F). Scale bar = 100 µm. (G) Quantification of Phen Green- and LDH-positive cells shown in (e), analysed by flow cytometry. The ratio of the mean fluorescence intensity (MFI) was calculated for each sample. The data were normalized to those of the control samples as shown by the relative Fe2+ or ROS ratios. Means±SEM, unpaired Student's t-tests. WT: Wild-type, YTH1:YTHDF1, PG: Phen Green.
Figure 3
Figure 3
YTHDF1 promotes HPSCC cell proliferation by regulating intracellular iron metabolism. (A) YTHDF1 is frequently amplified in various squamous cell cancers (cervical, lung, head and neck, oesophagus, etc.) according to cBioPortal data sets. Colors indicate mutations (green), deletions (blue), and amplifications (red). (B) Expression of YTHDF1 mRNA in highly metastatic cell lines (FaDu origin: hypopharynx, Detroit 562 origin: pleural effusion) and nonmetastatic lines (YCU-OR891 origin: oral floor, YCU-MS861 origin: maxillary sinus); data were generated from a network database. (C-E) CCK-8 (C), colony formation (D) and Transwell (E) assays were performed to determine the proliferation and growth of HPSCC cells with YTHDF1 knockdown. Magnification: E, 5 ×, scale bar = 100 µm. (F,G) Xenograft tumor masses harvested from shCON- and shYTHDF1-transfected FaDu cells. Tumor burden was measured at the indicated time points (F), and tumor weight was measured 12 days after injection (G). (H,I) CCK-8 (H) and colony formation (I) assays were performed with FaDu cells transfected with a control vector or pCMV-YTHDF1-WT plasmid and subsequently treated with 1 mM DFP. (J-L) Representative images of H&E-stained tissues to evaluate xenograft tumor formation (J), tumor volumes (K), and intratumoral iron levels (L) in nude mice bearing FaDu cells transfected with a control vector or pCMV-YTHDF1-WT plasmid with or without DFP treatment (1 mg/mL in drinking water). The results are presented as the mean± SEM of 5 mice per group per time point, unpaired Student's t-test. WT: wild-type, YTH1: YTHDF1; DFP: deferiprone. Figure 3K and Figure S2E show the same control virus and YTHDF1-WT virus xenograft groups.
Figure 4
Figure 4
Transcriptome-wide m6A-seq, RNA-seq and RIP-seq assays. (A) The m6A motif detected by the HOMER motif discovery tool with m6A-seq data. Metagene plot depicting nearly unchanged m6A-peak distributions and similar GGAC consensus motifs in the shCON- and shYTHDF1-transfected FaDu cells (both replicates). (B) Density distribution of the m6A peaks across mRNA transcripts. The upstream untranslated region (5′UTR), coding region (CDS), and downstream untranslated region (3′UTR) were divided into 100 segments, and the percentages of peaks within each segment were determined. (C) Proportion of m6A peak distribution in the 5'UTR, start codon, CDS, stop codon and 3'UTR region in the entire set of mRNA transcripts. (D) Distribution of genes with a significant change in both m6A level (log2 FC) and gene expression level (log2 FC) in the shCON- and shYTHDF1-transfected FaDu cells. (E) Venn diagram illustrating the overlapping genes identified by m6A-seq, RIP-seq, and RNA-seq. (F) Flow chart of the selected candidate YTHDF1 target genes in FaDu cells. (G-I) IGV tracks displaying the distribution of m6A peaks and YTHDF1-binding peaks among the indicated genes according to m6A-seq and YTHDF1 RIP-seq of FaDu cells.
Figure 5
Figure 5
YTHDF1 regulates TFRC expression in HPSCC cells in an m6A methyltransferase-dependent manner. (A) Relative RNA level of TFRC in Detroit 562 and FaDu cells upon YTHDF1 knockdown. (B) Western blot analysis of the protein level of TFRC in Detroit 562 and FaDu cells upon YTHDF1 knockdown. (C,D) RIP analysis of the interaction of the 5'UTR (C) and 3'UTR (D) of TFRC mRNA in FaDu cells transfected with the FLAG-YTHDF1-WT plasmid. Enrichment of TFRC with FLAG was measured by qPCR and normalized to the input level. (E) Western blot analysis of the protein level of TFRC in Detroit 562 and FaDu cells transfected with the YTHDF1-WT or YTHDF1-Mut plasmid. (F) Schematic representation of wild-type (TFRC-WT) and m6A mutant (TFRC-Mut) TFRC constructs. (G) Relative luciferase activity of the WT or Mut TFRC-5′UTR and TFRC-3′UTR luciferase reporter in FaDu cells transfected with control vector or shYTHDF1. Firefly luciferase activity was measured and normalized to Renilla luciferase activity. (H) Relative luciferase activity of WT and Mut (A-to-T mutation) TFRC-5′UTR and TFRC- 3′UTR luciferase reporters in Detroit 562 cells transfected with pCMV-YTHDF1-WT or pCMV-YTHDF1-Mut plasmid. Firefly luciferase activity was measured and normalized to Renilla luciferase activity. (I,J) The m6A modification in the 5'UTR (I) and 3'UTR (J) of TRFC mRNA in Detroit 562 and FaDu cells with YTHDF1 knockdown, as assessed by gene-specific m6A-RIP-qPCR assays. Error bars indicate the means ± SEM, n = 3; unpaired Student's t-test.
Figure 6
Figure 6
TFRC is a crucial target gene for the YTHDF1 promotion of iron metabolism. (A,B) CCK-8 (A) and colony formation (B) assays were performed after shCON and YTHDF1- knockdown Detroit 562 cells were transfected with the GV272 or GV272-TRFC-WT plasmid. (C) Masses of the xenograft tumors harvested from different groups. Tumor weight was measured 12 days after injection. (D) Intracellular iron levels (nmol) were measured in the GV272- and GV272-TRFC-WT- transfected shCON and YTHDF1-knockdown Detroit 562 and FaDu cells. (E,F) Flow cytometry and quantification of Phen Green- and LDH-positive shCON and YTHDF1-knockdown Detroit 562 cells transfected with the GV272 or GV272-TRFC-WT plasmid showing intracellular Fe2+ levels (E) and ROS levels (F).
Figure 7
Figure 7
YTHDF1 links poor prognosis in HPSCC patients with CCT/RT treatments. (A) Quantification of YTHDF1 expression in cancerous and paired paracancerous tissues from patients in cohort 1 and cohort 2. (B) Representative IHC images of YTHDF and TFRC in HPSCC tissues from patients in cohort 1 and cohort 2. Scale bar = 100 µm (40 ×). (C) Pearson's rank correlation of YTHDF1 and TFRC proteins in HPSCC tissues from patients in cohort 1 and cohort 2 based on the IHC analysis. (D,E) Kaplan-Meier analysis of HPSCC patients to determine the correlations between YTHDF1 expression (D), TRFC expression (E) and recurrence-free survival based on data generated from IHC staining of HPSCC tissues. (F,G) Statistical analysis of the relative expression of TFRC (F) and serum ferritin (G) in HPSCC patients treated with or without CCT/RT, as assessed by the Mann-Whitney U test. (H,I) Kaplan-Meier analysis of HPSCC patients treated with CCT/RT to determine the correlations between YTHDF1 expression (H), TRFC expression (I) and recurrence-free survival. (J) Proposed model of the relationship between TFRC expression enhanced by the m6A modification reader YTHDF1, HPSCC cell progression, cell response to CCT/RT upon tumor hypoxia, and iron metabolism.

References

    1. Siegel RL, Miller KD, Jemal A. Cancer statistics, 2020. CA Cancer J Clin. 2020;70:7–30. - PubMed
    1. Arends CR, Petersen JF, van der Noort V, Timmermans AJ, Leemans CR, de Bree R. et al. Optimizing Survival Predictions of Hypopharynx Cancer: Development of a Clinical Prediction Model. Laryngoscope. 2020;130:2166–72. - PMC - PubMed
    1. Gatta G, Botta L, Sanchez MJ, Anderson LA, Pierannunzio D, Licitra L. Prognoses and improvement for head and neck cancers diagnosed in Europe in early 2000s: The EUROCARE-5 population-based study. Eur J Cancer. 2015;51:2130–43. - PubMed
    1. Carvalho AL, Nishimoto IN, Califano JA, Kowalski LP. Trends in incidence and prognosis for head and neck cancer in the United States: a site-specific analysis of the SEER database. Int J Cancer. 2005;114:806–16. - PubMed
    1. Petersen JF, Timmermans AJ, van Dijk B, Overbeek L, Smit LA, Hilgers F. et al. Trends in treatment, incidence and survival of hypopharynx cancer: a 20-year population-based study in the Netherlands. Eur Arch Otorhinolaryngol. 2018;275:181–9. - PMC - PubMed

Publication types

MeSH terms