. 2020 Oct 27;10(26):12189-12203.
doi: 10.7150/thno.48028. eCollection 2020.

IL-33/ST2 induces neutrophil-dependent reactive oxygen species production and mediates gout pain

Affiliations

IL-33/ST2 induces neutrophil-dependent reactive oxygen species production and mediates gout pain

Chengyu Yin et al. Theranostics. .

Abstract

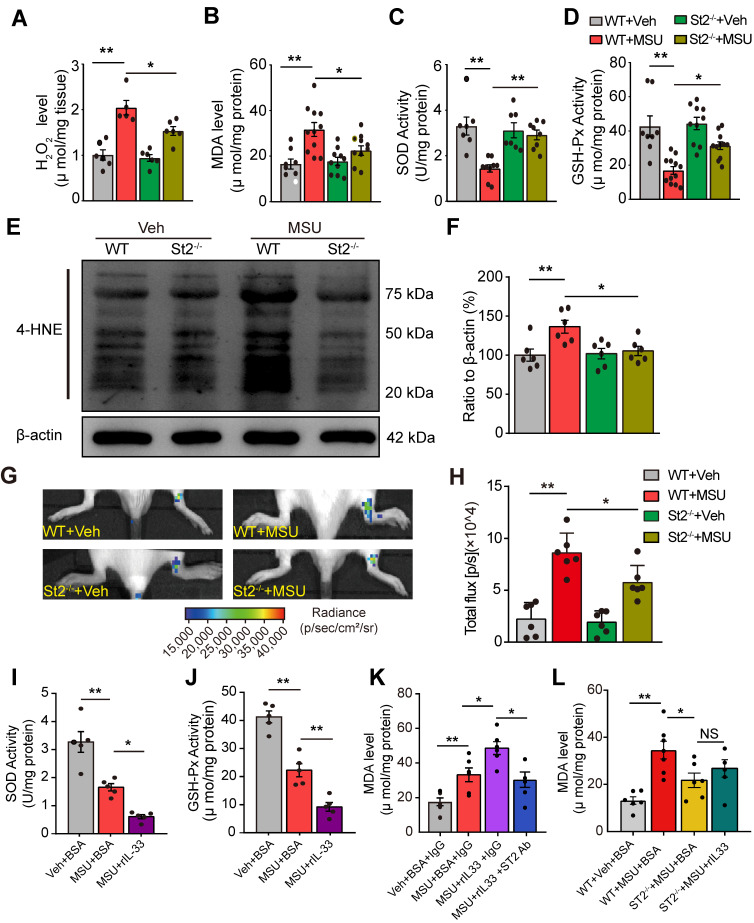
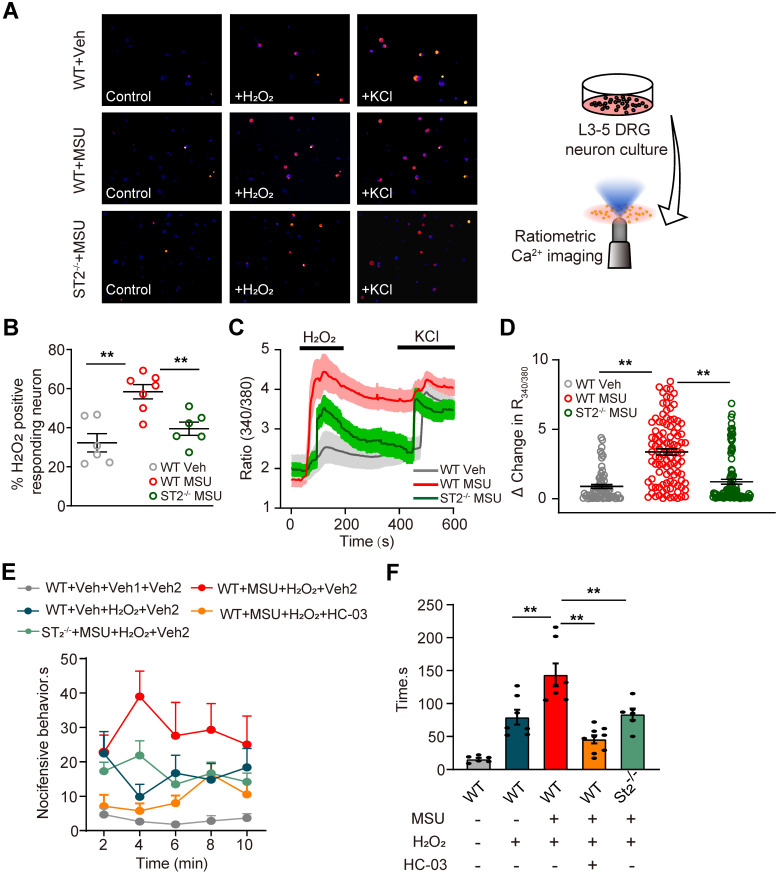
Objective: Gout, induced by monosodium urate (MSU) crystal deposition in joint tissues, provokes severe pain and impacts life quality of patients. However, the mechanisms underlying gout pain are still incompletely understood. Methods: We established a mouse gout model by intra-articularly injection of MSU crystals into the ankle joint of wild type and genetic knockout mice. RNA-Sequencing, in vivo molecular imaging, Ca2+ imaging, reactive oxygen species (ROS) generation, neutrophil influx and nocifensive behavioral assays, etc. were used. Results: We found interleukin-33 (IL-33) was among the top up-regulated cytokines in the inflamed ankle. Neutralizing or genetic deletion of IL-33 or its receptor ST2 (suppression of tumorigenicity) significantly ameliorated pain hypersensitivities and inflammation. Mechanistically, IL-33 was largely released from infiltrated macrophages in inflamed ankle upon MSU stimulation. IL-33 promoted neutrophil influx and triggered neutrophil-dependent ROS production via ST2 during gout, which in turn, activated transient receptor potential ankyrin 1 (TRPA1) channel in dorsal root ganglion (DRG) neurons and produced nociception. Further, TRPA1 channel activity was significantly enhanced in DRG neurons that innervate the inflamed ankle via ST2 dependent mechanism, which results in exaggerated nociceptive response to endogenous ROS products during gout. Conclusions: We demonstrated a previous unidentified role of IL-33/ST2 in mediating pain hypersensitivity and inflammation in a mouse gout model through promoting neutrophil-dependent ROS production and TRPA1 channel activation. Targeting IL-33/ST2 may represent a novel therapeutic approach to ameliorate gout pain and inflammation.

Keywords: Gout; TRPA1; arthritis; cytokine; neutrophil; reactive oxygen species.


Conflict of interest statement

Competing Interests: The authors have declared that no competing interest exists.

Figures

Figure 1
Figure 1
RNA-Seq expression analysis of mRNA changes in inflamed ankle tissues of MSU-induced mouse gout model. (A) Representative photos showing mouse ankle injected with PBS (Veh group) or MSU (MSU group). The pictures were taken 24 h after injection. (B) Time course of the % increase in ankle diameter after model establishment. n = 6 mice/group, **p<0.01 vs. Veh group. (C) Representative photos of ankle H&E staining from Veh and MSU group. The right panels show enlarged area as indicated in the left. (D) Time course of PWT changes in the right hind paw after model establishment. n = 6 mice/group, *p<0.05 and **p<0.01 vs. Veh group. (E) Heat map illustration of the DEGs derived from MSU group vs. Veh group. n = 3 mice/group. (F) Volcano plot showing gene expression profiles in MSU group vs. Veh group. Red and blue spots indicate up- and down-regulated DEGs, respectively, whereas grey spots indicate non-DEGs. (G) Top 10 most highly up-regulated inflammatory cytokines or chemokines in MSU group vs. Veh group.
Figure 2
Figure 2
The expressions of IL-33 and ST2 proteins are up-regulated in inflamed ankle tissues of mouse gout model. (A-C) qPCR analysis of Il-33, St2 and Il-1RAcP gene expression fold changes in MSU group vs. Veh group (PBS). Ankle tissues were harvested 24 h after model establishment. n = 6-8 mice/group. (D) ELISA result of IL-33 protein changes in MSU group vs. Veh group. n = 5 mice/group. **p<0.01, NS: no significance. (E) IL-33 protein expression in ankle tissues examined by Western blotting at 0, 8, 24 and 48 h time points after MSU or Veh group establishment. Upper panel shows representative photos of IL-33 and β-actin protein expression. Lower panel indicates the summarized IL-33 expression normalized to β-actin in MSU and Veh group. n = 6 mice/group. (F) ST2 protein expression in ankle tissues examined by Western blotting at 0, 8, 24 and 48 h time points after MSU or Veh group establishment. Upper panel shows representative photos of ST2 and β-actin protein expression. Lower panel indicates the summarized ST2 expression normalized to β-actin in MSU and Veh group. n = 6 mice/group. *p<0.05 and **p<0.01 vs. 0 h time point, NS: no significance vs. 0 h time point. Student's t test was used for statistical analysis in (A-D). One-way ANOVA followed by Tukey post hoc test was used for statistical analysis in panels (E-F).
Figure 3
Figure 3
IL-33/ST2 is involved in mediating pain hypersensitivity and inflammatory response of the mouse gout model. (A) Schematic picture depicting the time points of IL-33 neutralizing antibody (IL-33 Ab) or isotype control IgG application (i.p.) and behavioral/ankle edema tests. MSU or PBS (Veh) was injected into the ankle (i.a.) at 0 h time point. (B&C) The comparison of % increase of ankle diameter (B) or PWT (C) 1, 4, 8 and 24 h after IL-33 Ab or isotype control IgG application. (D) Time course showing PWT changes in WT and Il33-/- mice after MSU or PBS injection. (E) Summary of the normalized area under the curve as in (D), in which WT+Veh group was taken as 100%. n = 6 mice/group. (F) Time course showing % increase in ankle diameter in WT and Il33-/- mice after MSU or PBS injection. (G) Summary of the normalized area under the curve as in (F), in which WT+Veh group was taken as 100%. n = 7 mice/group. (H) Time course showing PWT changes in WT and St2-/- mice after MSU or PBS injection. (I) Summary of the normalized area under the curve as in (H), in which WT+Veh group was taken as 100%. n = 7 mice/group. (J) Time course showing % increase in ankle diameter in WT and St2-/- mice after MSU or PBS injection. (K) Summary of the normalized area under the curve as in (J), in which WT+Veh group was taken as 100%. n = 7 mice/group. *p<0.05 and **p<0.01 vs. WT+Veh group. #p<0.05 and ##p<0.01 vs. WT+MSU group. One-way ANOVA followed by Tukey post hoc test was used for statistical analysis in panels (E, G, I & K). Two-way ANOVA followed by Tukey post hoc test was used for statistical analysis in panels (B, C, D, F, H & J).
Figure 4
Figure 4
Macrophage is a cellular mechanism for IL-33 overproduction during gout. (A) Upper panel: Schematic protocol illustrating time points for MSU/LPS incubation and RAW264.7 cell harvest. Lower panel: Expression of Il-33 gene in RAW264.7 cells after vehicle (Veh, PBS), MSU (0.5 or 1 mg/ml) or LPS (1 µg/ml) incubation by qPCR. (B) IL-33 protein expression changes in RAW264.7 cells after vehicle (PBS), MSU (0.5 mg/ml) or LPS (1 µg/ml) incubation by ELISA. (C) IL-33 protein expression changes in macrophages after vehicle, MSU (0.5 or 1 mg/ml) or LPS (1 µg/ml) incubation by ELISA. n = 5-6 replicates/group. (D) Protocol illustrating in vivo depleting macrophages in mice via treating with clodronate-laden liposome (i.p.). Liposome (Lipo) was used as vehicle control. (E) Immunofluorescence staining of periarticular tissues using F4/80 to detect macrophages. Right panels show enlarged fields depicted as white boxes on the left. (F) F4/80 positively stained cell counts per observation field. n = 4 mice/group. (G) Western blot of IL-33 protein expression in ankle tissues after macrophage depletion. Upper panel: representative images of IL-33 and β-actin protein expression in Veh+Lipo, MSU+Lipo and MSU+Clodro groups. Lower panel: summarized IL-33 expression normalized to β-actin. (H) Time course of the % increase in ankle diameter after MSU injection. (I) Summary of the normalized AUC as in (H), in which Veh+Lipo group was taken as 100%. (J) Time course of PWT changes after MSU injection. (K) Summary of the normalized AUC as in (J), in which Veh+Lipo group was taken as 100%. n = 7 mice/group. *p<0.05 and **p<0.01 vs. Veh+Lipo group. #p<0.05 and ##p<0.01 vs. MSU+Lipo group. NS: no significance. One-way ANOVA followed by Tukey post hoc test was used for statistical analysis in panels (A, B, C, F, G, I & K). Two-way ANOVA followed by Tukey post hoc test was used for statistical analysis in panels (H & J).
Figure 5
Figure 5
IL-33/ST2 participates in oxidative stress modulation and promotes ROS production in gout condition. (A-D) Summarized data showing H2O2 content (A), MDA content (B), SOD activity (C) and GSH-Px activity (D) determined in WT or ST2-/- mice ankle tissues 24 h after vehicle (Veh, PBS) or MSU injection. (E) 4-HNE and β-actin expression in mice ankle tissues determined by Western blot. (F) Summarized data of 4-HNE expression normalized to β-actin. (G) In vivo ROS imaging showing ROS contents in the ankle area using L-012 in different groups. (H) Summarized total fluorescence flux of L-012 in the ankle area. (I-J) SOD activity (I) and GSH-Px activity (J) in ankle tissues 4 h after BSA or rIL-33 (300 ng) injection. (K) MDA level in ankle tissues 4 h after BSA or rIL-33 injection. ST2 neutralizing antibody (50 µg) or isotype IgG was co-injected with rIL-33. (L) MDA level in ankle tissues 4 h after BSA or rIL-33 injection in WT or St2-/- mice. *p<0.05 and **p<0.01. NS: no significance. One-way ANOVA followed by Tukey post hoc test was used for statistical analysis.
Figure 6
Figure 6
IL-33/ST2 promotes neutrophil influx into inflamed tissue to generate oxidative stress in gout condition. (A) MPO activity determined in WT or ST2-/- mice ankle tissues 24 h after vehicle (Veh, PBS) or MSU injection. n = 5-9 mice/group. (B) MPO activity determined in ankle tissue of gout model mice after exogenously injection with BSA or rIL-33. (C) Schematic protocol for blocking neutrophil influx via fucoidine (20 mg/kg in 20 µl injecting volume, i.v.). (D-H) MPO activity (D), H2O2 (E), SOD activity (F), GSH-Px activity (G) and MDA content (H) measured in fucoidine- or vehicle (PBS)-treated gout model mice. n = 5-9 mice/group. (I) % increase in ankle diameter of gout model mice 1 or 3 h after fucoidine or PBS treatment. (J) PWT of gout model mice 1 or 3 h after fucoidine or PBS treatment. n = 5-8 mice/group. *p<0.05 and **p<0.01. One-way ANOVA followed by Tukey post hoc test was used for statistical analysis.
Figure 7
Figure 7
TRPA1 channel activity is increased in DRG neurons of gout model mice via ST2 dependent manner, which enhances the nociceptive response to endogenous ROS products in gout condition. (A) Pseudo color images from Fura-2-based ratiometric Ca2+ imaging indicating the Ca2+ responses from ipsilateral L3-5 DRG neurons in response to the endogenous TRPA1 agonist H2O2 (500 µM) in Veh (PBS) or MSU group mice. 40 mM KCl was perfused at the end of each recording to determine all live DRG neurons in observation field. (B) Summarized % of H2O2 positive responding DRG neurons in each observation field from Veh or MSU group of mice. n = 6-7 tests/group. Each group contains 150-200 neurons derived from 3-4 mice. (C) Comparison of averaged Ca2+ responses induced by 500 µM H2O2 between Veh and MSU group. Ca2+ traces are overlaid for comparison. n > 40 cells/group. (D) Summarized data showing Δ increase in peak 340/380 ratio before and after H2O2 application. n > 60 neurons/group derived from 3-4 mice/group. (E) Time course of the nocifensive behaviors of Veh and MSU group mice after H2O2/HC-030031 or corresponding vehicle injection. Veh: PBS, Veh1: PBS, Veh2: 1% DMSO (in PBS), HC-03: HC-030031. (F) Total time summary of all time points in panel (E). **p<0.01. One-way ANOVA followed by Tukey post hoc test was used for statistical analysis.

References

    1. Rees F, Hui M, Doherty M. Optimizing current treatment of gout. Nat Rev Rheumatol. 2014;10:271–83. - PubMed
    1. Roddy E, Doherty M. Epidemiology of gout. Arthritis Res Ther. 2010;12:223. - PMC - PubMed
    1. Terkeltaub R. Update on gout: new therapeutic strategies and options. Nat Rev Rheumatol. 2010;6:30–8. - PubMed
    1. Richette P, Doherty M, Pascual E, Barskova V, Becce F, Castaneda-Sanabria J. et al. 2016 updated EULAR evidence-based recommendations for the management of gout. Ann Rheum Dis. 2017;76:29–42. - PubMed
    1. Dalbeth N, Choi HK, Joosten LAB, Khanna PP, Matsuo H, Perez-Ruiz F. et al. Gout. Nat Rev Dis Primers. 2019;5:69. - PubMed

Publication types

MeSH terms