. 2020 Oct 30;10(26):12204-12222.
doi: 10.7150/thno.47683. eCollection 2020.

Embryonic stem cell-derived mesenchymal stem cells promote colon epithelial integrity and regeneration by elevating circulating IGF-1 in colitis mice

Affiliations

Embryonic stem cell-derived mesenchymal stem cells promote colon epithelial integrity and regeneration by elevating circulating IGF-1 in colitis mice

Jun Xu et al. Theranostics. .

Abstract

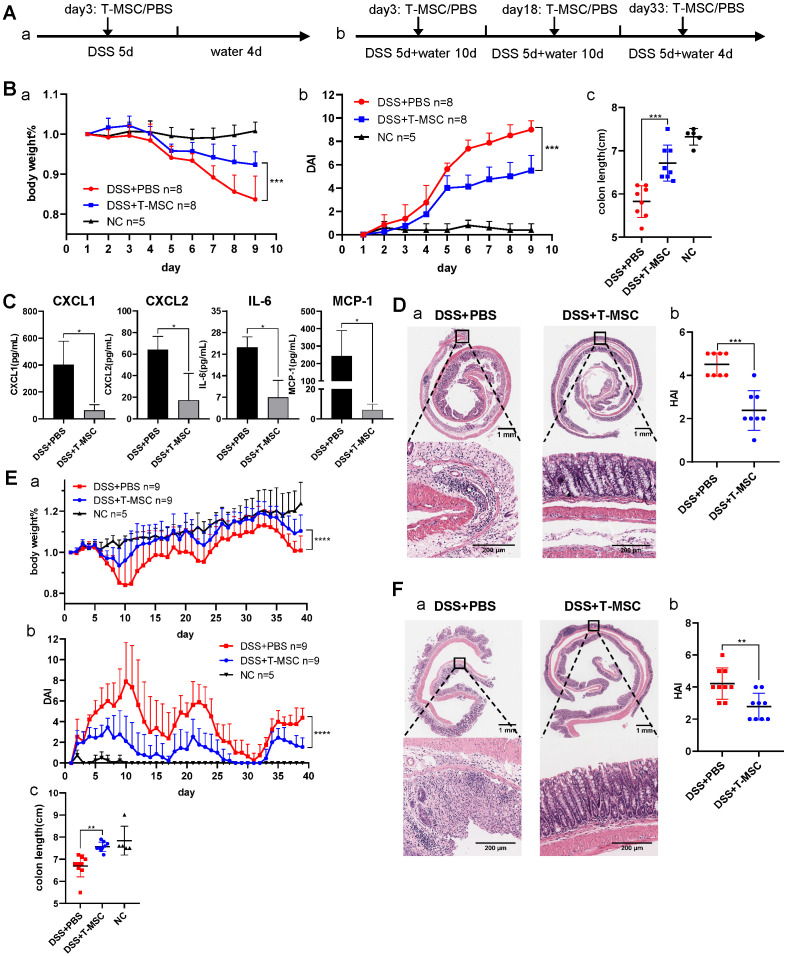
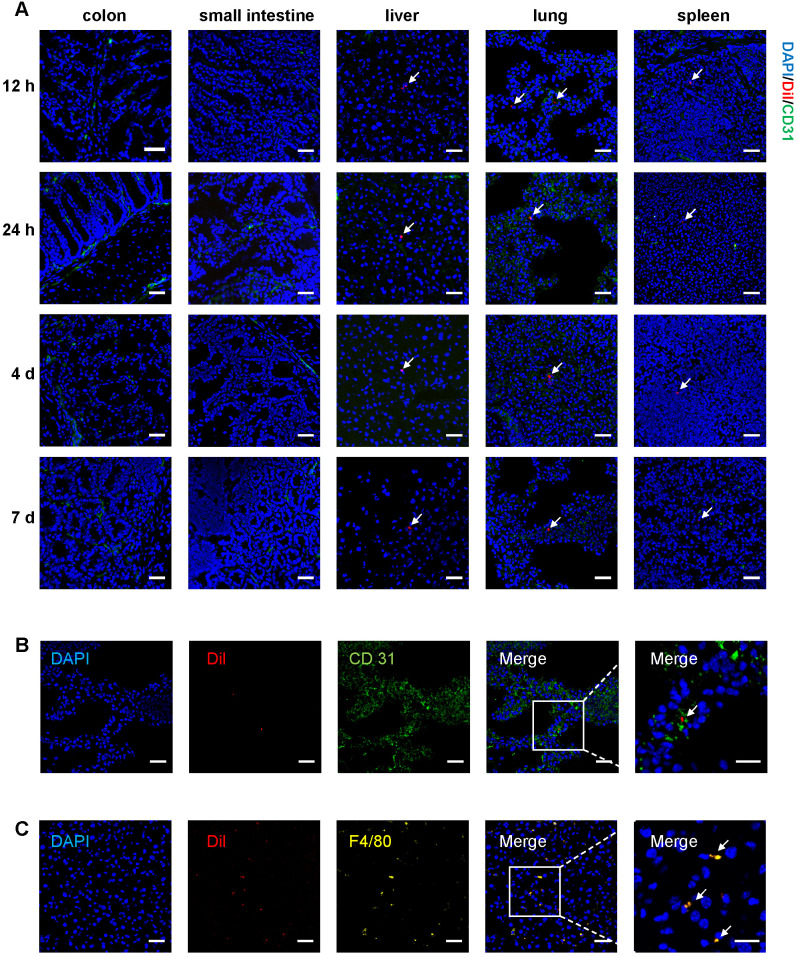
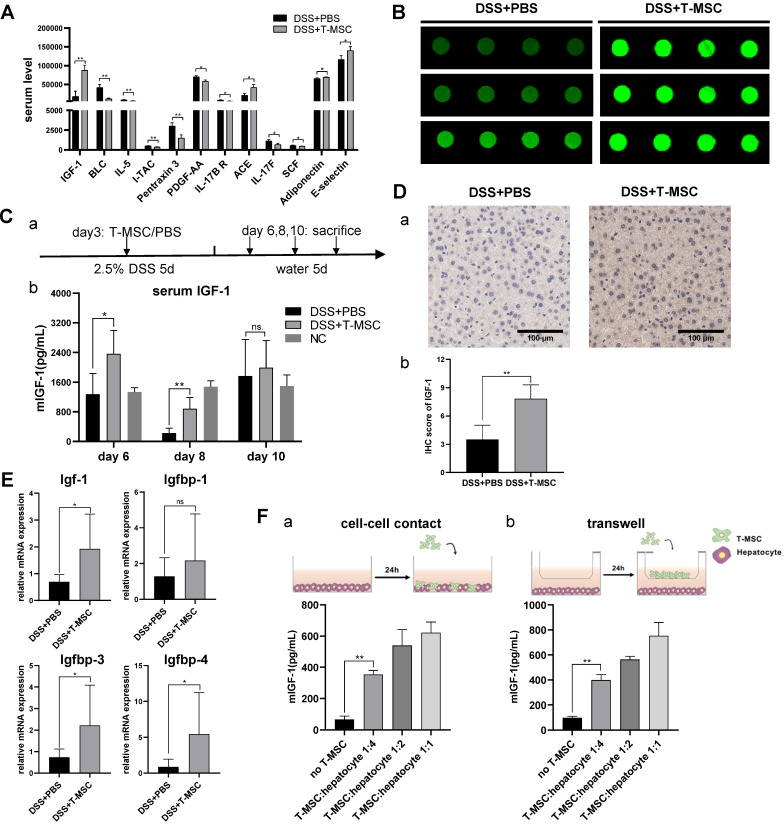
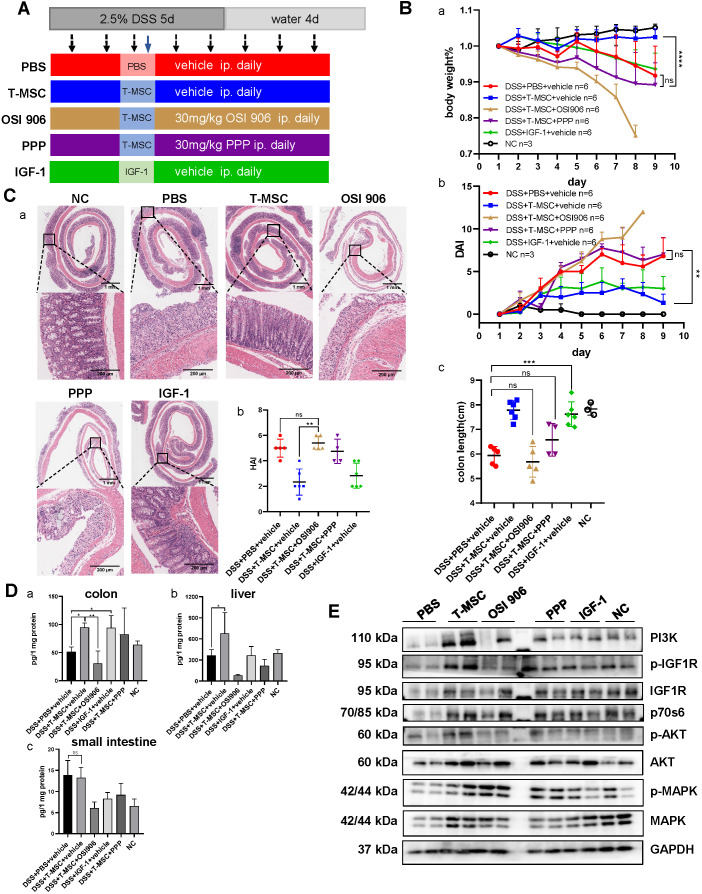
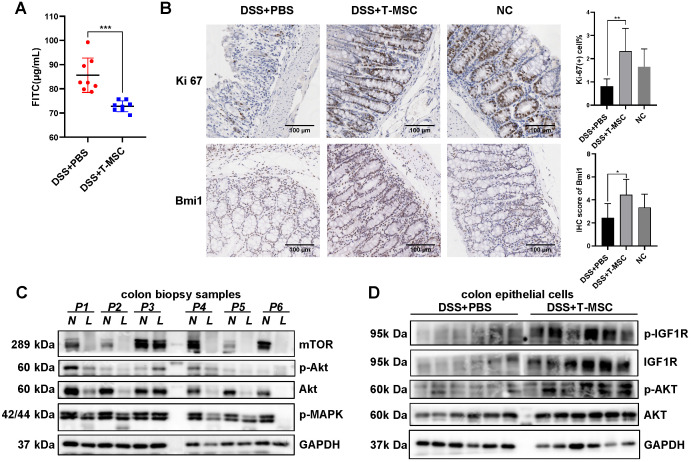
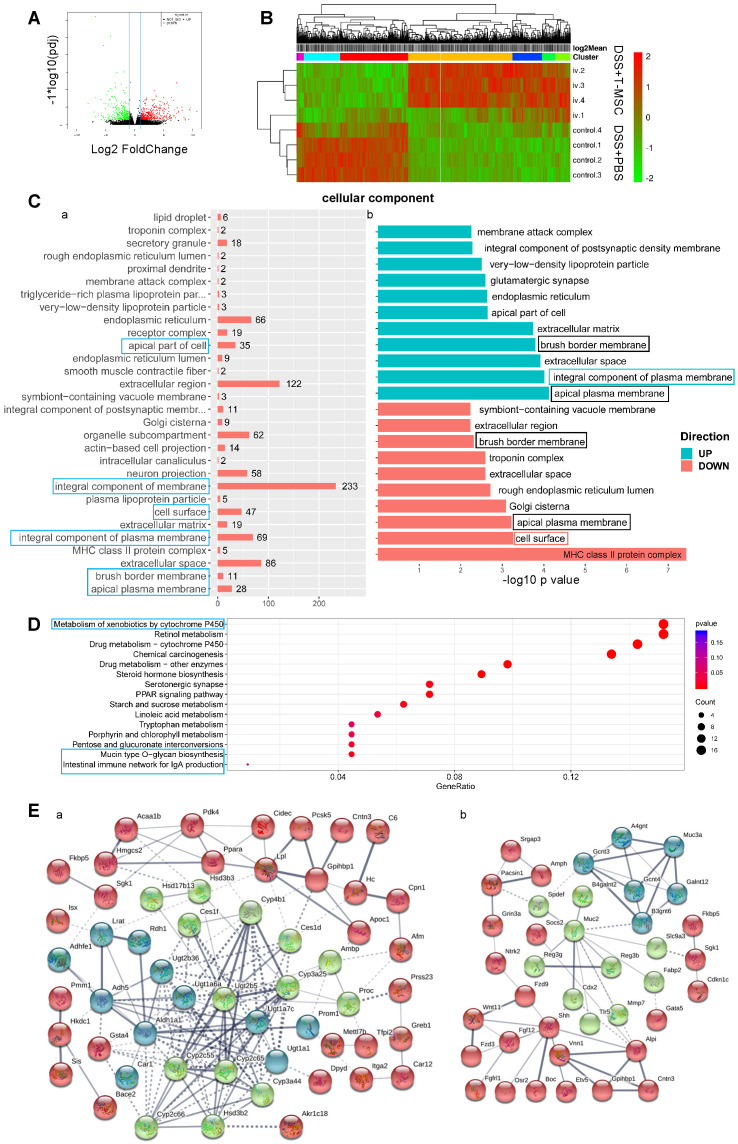
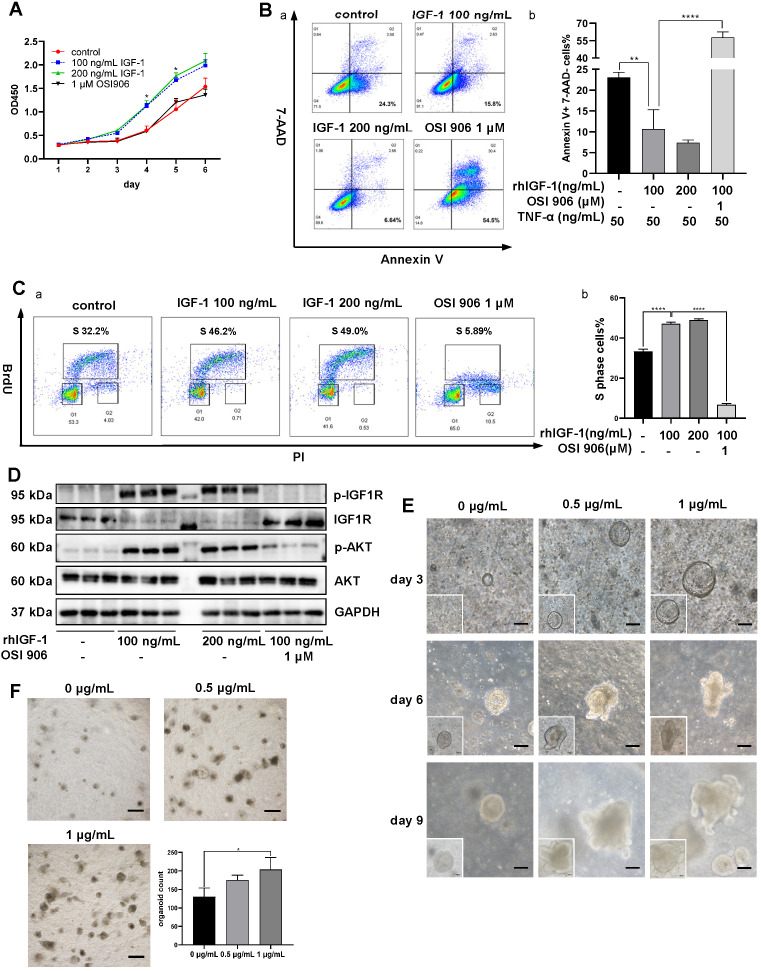
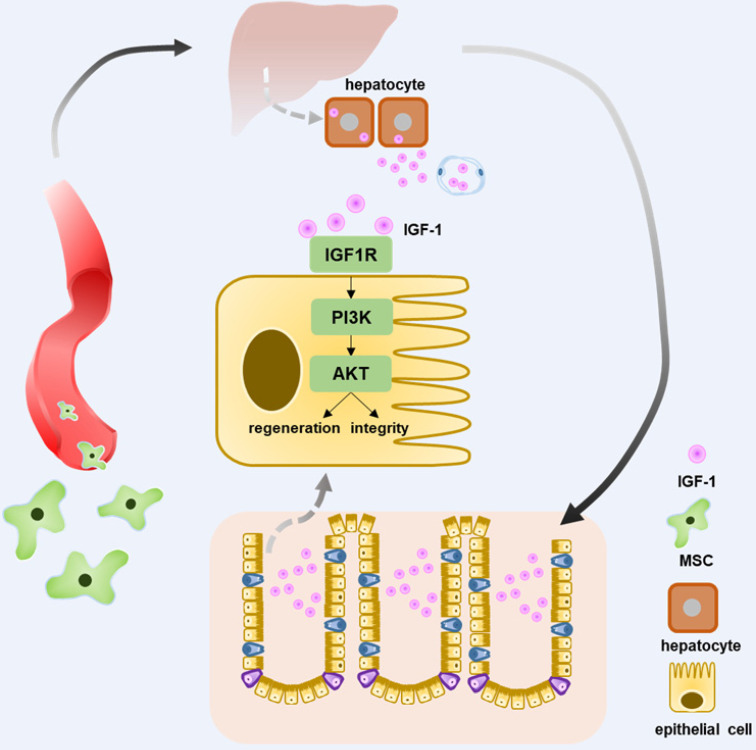
Rationale: Mesenchymal stem cells (MSCs) show promising therapeutic potential in treating inflammatory bowel disease (IBD) due to their immunomodulatory and trophic functions. However, their efficacy is influenced by tissue origin, donator condition, isolation, and expansion methods. Here, we generated phenotypically uniform MSCs from human embryonic stem cells (T-MSCs) and explored the molecular mechanisms involved in promoting mucosal integrity and regeneration in colitis mice. Methods: T-MSCs were injected intravenously into mice with dextran sulfate sodium (DSS)-induced colitis, and the in vivo distribution and therapeutic efficacy were evaluated. We performed serum cytokine antibody microarrays to screen potentially effective proteins and examined the therapeutic effect of insulin-like growth factor-1 (IGF-1). Colon epithelial regeneration potential was evaluated, and RNA sequencing was employed to determine the underlying molecular mechanisms. Finally, in vitro IGF-1 stimulation was performed to assess its effect on cell functions and organoid growth. Results: Intravenous administration of T-MSCs alleviated colitis in both acute and chronic DSS mouse models. Labeled T-MSCs were mainly distributed in the lungs, liver, and spleen after systemic infusion. The antibody array analysis of serum cytokines indicated that the IGF-1 level was increased in the treatment group, and serum ELISA further confirmed its elevation in the regeneration stage. Intraperitoneal injection of IGF-1 receptor inhibitors abrogated the anti-inflammatory activity of T-MSCs. The colonic epithelium of the treatment group showed greater regenerative potency than the controls and the IGF1R-PI3K-AKT pathway was up-regulated. RNA sequencing showed that T-MSC treatment contributed to colonic cell integrity and promoted xenobiotic metabolism. In vitro IGF-1 stimulation promoted the growth and proliferation of colon cells and organoids. Conclusions: Intravenous infusion of T-MSCs alleviated colitis in mice by elevating the circulating IGF-1 level. Increased IGF-1 maintained the integrity of epithelial cells and contributed to their repair and regeneration. Our study has identified T- MSCs as a potential cell resource for IBD treatment.

Keywords: epithelium regeneration; inflammatory bowel disease; insulin-like growth factor-1; mesenchymal stem cell; mucosa integrity.


Conflict of interest statement

Competing Interests: Xiaofang Wang is the employee of ImStem Biotechnology Inc. and ZhuHai Hengqin ImStem Biotechnology Ltd. Other authors have declared that no competing interest exists.

Figures

Figure 1
Figure 1
Intravenous T-MSC administration alleviated DSS-induced colitis in mice. A. Experimental layout of T-MSC treatment in the acute and chronic DSS colitis. The acute colitis model was induced by 2.5% DSS in drinking water for 5 consecutive days. Mice received an intravenous injection of 5×10⁵ T-MSCs (n=8) or PBS (n=8) on day 3. The chronic colitis model was induced by 3 cycles of 1.5% DSS (5 d) + water (10 d or 4 d). Mice received intravenous injections of 5×10⁵ T-MSCs (n=9) or PBS (n=9) on day 3, 18, and 33. Negative control (NC) group mice were maintained on untreated drinking water (n=5 in both acute and chronic DSS colitis models). B. Therapeutic efficacy evaluation of acute DSS model. a. bodyweight percentage. b. DAI scores. c. colon length. C. Serum inflammatory cytokines in acute DSS colitis model measured by mouse high sensitivity T cell magnetic bead panel. D. a. HE staining of colon sections in the acute colitis model. Scale bar = 1 mm top panel/200 µm bottom panel. b. HAI scores of colons. E. Therapeutic efficacy evaluation of chronic DSS model. a. bodyweight percentage. b. DAI scores. c. colon length. F. a. HE staining of colon sections in the chronic colitis model. Scale bar = 1 mm top panel/200 µm bottom panel. b. HAI scores of colons. Data are expressed as mean±SD. *p < 0.05, **p < 0.01, ***p < 0.001 and ****p < 0.0001. DAI: disease activity index; HAI: histopathology activity index.
Figure 2
Figure 2
In vivo tracking of Dil-labeled T-MSC. A. Mice were fed with 2.5% DSS for 3 days, and Dil-labeled T-MSCs were injected intravenously. In vivo distribution of T-MSCs was observed by immunofluorescence staining of the colon, small intestine, liver, lung, and spleen. Scale bar = 50 µm B. Immunofluorescence staining of the vascular endothelial cell marker CD 31 in frozen lung sections. Scale bar = 50 µm (left panel)/20 µm (right panel, magnified view). C. Immunofluorescence staining of the macrophage marker F4/80 in frozen sections of the liver. Scale bar = 50 µm (left panel)/20 µm (right panel, magnified view). Arrows indicate labeled cell components.
Figure 3
Figure 3
T-MSC treatment increased serum IGF-1 level. A. Serum cytokines of T-MSC-treated mice and PBS controls in acute colitis model were measured by the antibody array test. Normalized signal values were analyzed by student t-test, cytokines with p<0.05, and signal value>500 are listed. B. Fluorescent signals of IGF-1 detected by a microarray scanner in the antibody array test. C. Serum IGF-1 expression was verified by ELISA. a. experimental layout of the T-MSC treatment model. b. mice serum samples were collected on day 6, day 8, and day 10, and IGF-1 levels were detected by ELISA. D. Immunohistochemical staining of IGF-1 in the liver. a. IHC staining of liver sections. b. IHC scores of IGF-1. Scale bar = 100 µm. E. RT-qPCR for relative mRNA expression (normalized to GAPDH) of Igf-1 and Igfbps (Igfbp1, Igfbp3, Igfbp4) in the liver. F. T-MSCs and mouse primary hepatocytes were co-cultured at different ratios in cell-cell contact or Transwell assays, and supernatant IGF-1 was measured. Data are expressed as mean ± SD. *p < 0.05 and **p < 0.01. mIGF-1: mouse IGF-1.
Figure 4
Figure 4
IGF-1 receptor inhibitors blocked the therapeutic efficacy of T-MSC administration. A. Experimental scheme for the IGF-1 receptor inhibitor model. Colitis was induced by 2.5% DSS in drinking water for 5 consecutive days. DSS + PBS + vehicle group received daily intraperitoneal injections of inhibitor vehicles for 8 consecutive days and a single intravenous injection of PBS on day 3. DSS + T-MSC + vehicle group received daily intraperitoneal injections of inhibitor vehicles for 8 consecutive days and a single intravenous injection of 5×10⁵ cells on day 3. DSS + T-MSC + OSI 906 group received daily intraperitoneal injections of 30 mg/kg OSI 906 for 8 consecutive days and a single intravenous injection of 5×10⁵ cells on day 3. DSS + T-MSC + PPP group received daily intraperitoneal injections of 30 mg/kg PPP for 8 consecutive days and a single intravenous injection of 5×10⁵ cells on day 3. DSS + IGF-1 + vehicle group received daily intraperitoneal injections of inhibitor vehicles for 8 consecutive days and a single intravenous injection 2 mg/kg IGF-1 on day 3. B. Therapeutic efficacy was evaluated in each group. a. bodyweight percentage. b. DAI scores. c. colon length. C. a. HE staining of colon sections in different groups. Scale bar = 1 mm (top panel)/200 µm (bottom panel). b. HAI scores of colon sections. D. ELISA for normalized IGF-1 levels in different tissues. a. IGF-1 expression in the colon. b. IGF-1 expression in the liver. c. IGF-1 expression in the small intestine. E. IGF1-IGF1R downstream protein expressions were measured by Western blotting. Immunoblotting of MAPK, p-MAPK, AKT, p-AKT, IGF1R, p-IGF1R, p70s6, and PI3K were performed. Data are expressed as mean ± SD. *p < 0.05, **p < 0.01, ***p < 0.001 and ****p < 0.0001. DAI: disease activity index; HAI: histopathology activity index.
Figure 5
Figure 5
T-MSC treatment maintained proliferative potency of colon epithelium. A. FITC-dextran solutions were administered intra-gastrically, and serum FITC concentration in the acute colitis model was detected 4 h after administration. B. The proliferative potential of the remaining colon epithelium in the acute colitis model was measured by IHC staining of Ki-67 and intestinal stem cell marker Bmi1. Scale bar = 100 µm. C. Inflammatory mucosae (L, lesion) and its adjacent normal mucosae (N, normal) of IBD patients were collected and expressions of p-MAPK, AKT, p-AKT, and mTOR were measured by Western blotting. D. Colon epithelial cells in the acute colitis model were isolated and expressions of AKT, p-AKT, IGF1R, and p-IGF1R were measured by Western blotting. Data are expressed as mean ± SD. *p < 0.05, **p < 0.01, ***p < 0.001.
Figure 6
Figure 6
RNA-sequencing of colon tissues. Transcriptomic analysis of colon tissues in the acute colitis model was performed to investigate differential gene expressions at the transcriptional level. A. Volcano plot of DEGs. Red dots for up-regulated genes and green dots for down-regulated genes in the T-MSC group. B. Heatmap of hierarchical clustering of samples and DEGs. C. Gene Ontology enrichment analysis of DEGs in Cellular Component. a. GO annotations of DEGs and their corresponding gene numbers. Blue boxes represent annotations that might be related to T-MSC's therapeutic function. b. GO annotations of up-regulated (green) and down-regulated (red) DEGs. -log 10 p-value was used to measure the expressions of DEGs. The green box represents associated annotation with up-regulated DEGs, the red box represents associated annotation with down-regulated DEGs, and black boxes represent associated annotations with both up-regulated and down-regulated DEGs. D. KEGG pathway dot plot of DEGs. Dot size represents the numbers of DEGs, and the dot color represents the corresponding p value. Blue boxes represent pathways that might explain T-MSC's therapeutic function. E. PPI analysis of up-regulated DEGs. Line thickness indicates the strength of data support. a. proteins related to the detoxification process. b. proteins related to mucin function. DEG: differentially expressed gene; PPI: protein-protein interaction.
Figure 7
Figure 7
Effects of in vitro IGF-1 stimulation on colon cells and organoids. A. The proliferation of NCM 460 cells was measured by the CCK-8 assay. OD450 values were observed for 6 days. rhIGF-1 stimulation (100 ng/mL, 200 ng/mL) increased OD 450 values on day 4 and day 5. B. Apoptosis of NCM 460 cells was induced by 50 ng/mL TNF-α in culture media. Flow cytometry analysis of Annexin V and 7-AAD staining showed rhIGF-1 stimulation (100 ng/mL, 200 ng/mL) decreased the percentage of Annexin V+, 7-AAD- early apoptotic cells. C. Flow cytometry analysis of BrdU and PI staining was used to measure the cell cycle. rhIGF-1 stimulation (100 ng/mL, 200 ng/mL) increased BrdU+ S phase cell percentage compared with controls. D. Protein expressions of downstream IGF1-IGF1R pathway in NCM 460 cells were measured by Western blotting. rhIGF-1 stimulation increased the phosphorylation of AKT and IGF-1 receptors. E. Mice colon crypts were isolated for organoid culture and rmIGF-1 (0.5 µg/mL, 1 µg/mL) was added daily from day 3 (the time point when colon organoids began to appear and grow). In vitro IGF-1 stimulation increased the growth speed and led to a larger size and more buddings of the organoids. Scale bar = 100 µm F. Colon organoids were harvested and counted on day 10. rmIGF-1 stimulation increased total organoid numbers. Scale bar = 500 µm. Data are expressed as mean ± SD. *p < 0.05, **p < 0.01 and ****p < 0.0001. rhIGF-1: recombinant human IGF-1; rmIGF-1: recombinant mouse IGF-1.
Figure 8
Figure 8
Schematic diagram elucidating T-MSCs' therapeutic efficacy in colitis mice. Intravenous injection of T-MSCs showed therapeutic function in both acute and chronic DSS-induced colitis. Antibody array test indicated T-MSCs injection increased serum IGF-1 level. Further study showed elevated serum IGF-1 might originated from endogenous secretion of the liver. IGF1R-PI3K-AKT pathway in colon epithelium was upregulated after T-MSCs treatment. RNA sequencing analysis of colon samples identified DEGs that were related to cell integrity, xenobiotic metabolism, and mucous barrier. In conclusion, increased IGF-1 contributed to the integrity and regeneration of colon epithelium and promoted the recovery of chemically induced colitis in mice.

References

    1. Wu J, Wei Z, Cheng P, Qian C, Xu F, Yang Y. et al. Rhein modulates host purine metabolism in intestine through gut microbiota and ameliorates experimental colitis. Theranostics. 2020;10(23):10665–10679. - PMC - PubMed
    1. Kaser A, Zeissig S BR. Inflammatory bowel disease. Annu Rev Immunol. 2010;28:573–621. - PMC - PubMed
    1. Turner JR. Molecular basis of epithelial barrier regulation: from basic mechanisms to clinical application. Am J Pathol. 2006;169(6):1901–9. - PMC - PubMed
    1. Abraham C, Cho JH. Inflammatory bowel disease. N Engl J Med. 2009;361(21):2066–2078. - PMC - PubMed
    1. Uccelli A, Moretta L, Pistoia V. Mesenchymal stem cells in health and disease. Nat Rev Immunol. 2008;8(9):726–736. - PubMed

MeSH terms

Substances