. 2020 Nov 3:2020:9734560.
doi: 10.1155/2020/9734560. eCollection 2020.

Chicoric Acid Ameliorates Nonalcoholic Fatty Liver Disease via the AMPK/Nrf2/NF κ B Signaling Pathway and Restores Gut Microbiota in High-Fat-Diet-Fed Mice

Affiliations

Chicoric Acid Ameliorates Nonalcoholic Fatty Liver Disease via the AMPK/Nrf2/NF κ B Signaling Pathway and Restores Gut Microbiota in High-Fat-Diet-Fed Mice

Xiaoqin Ding et al. Oxid Med Cell Longev. .

Abstract

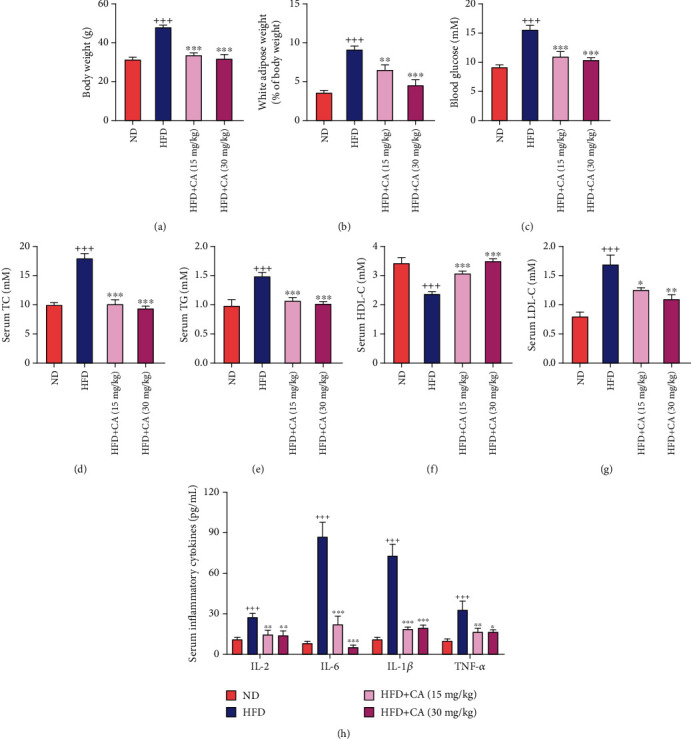
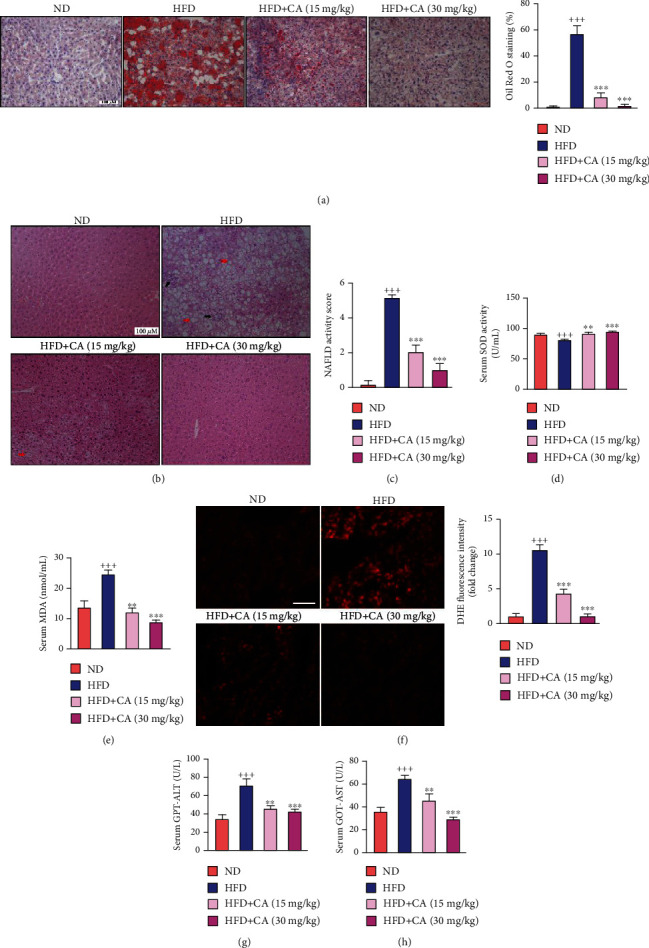
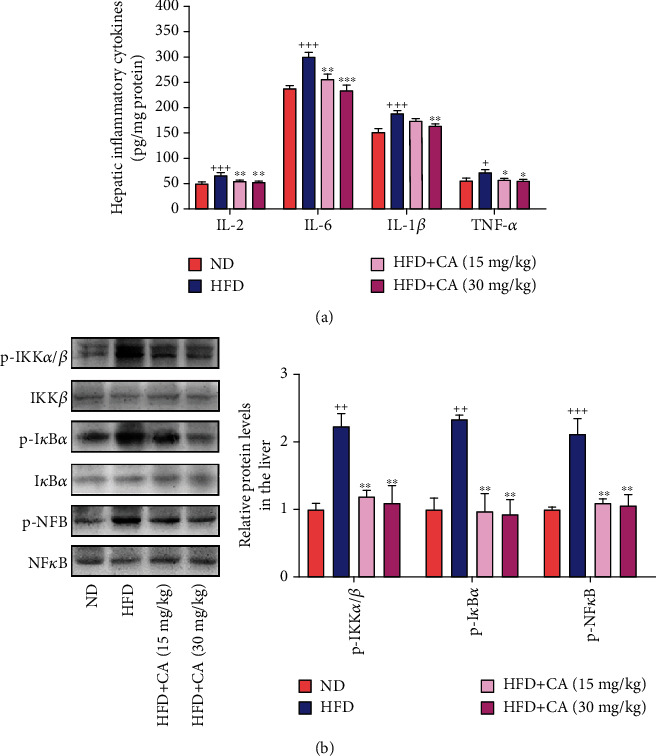
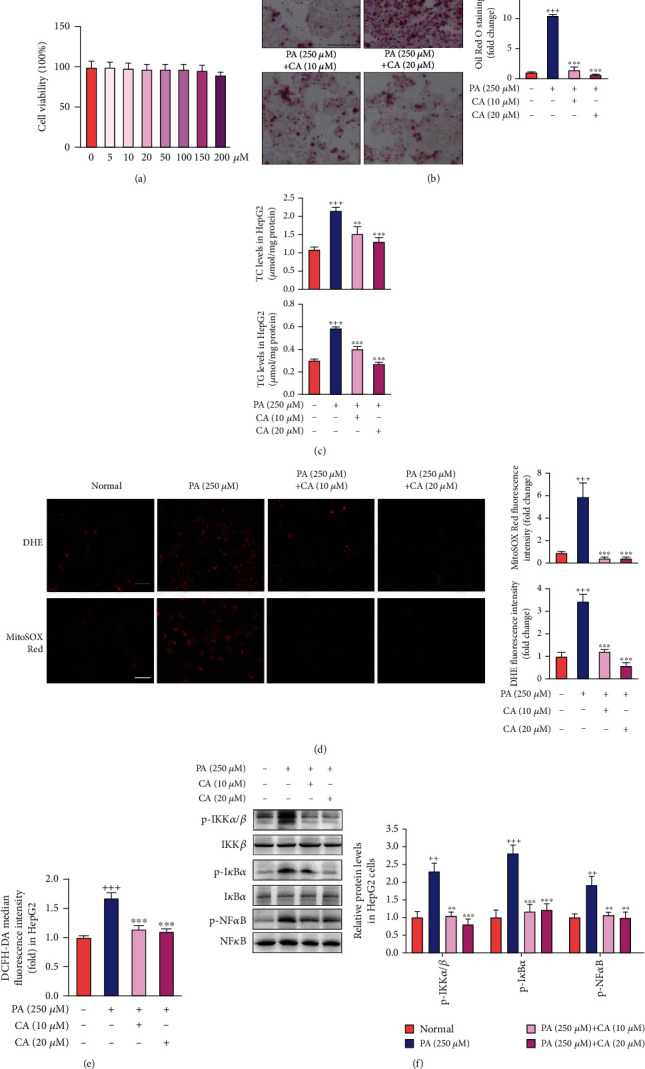
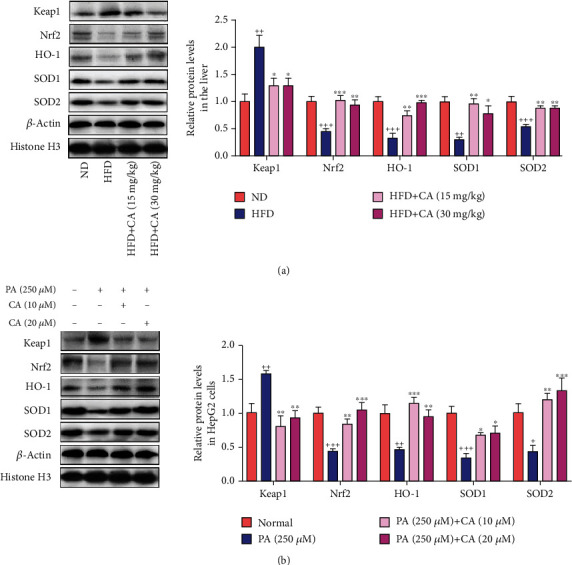
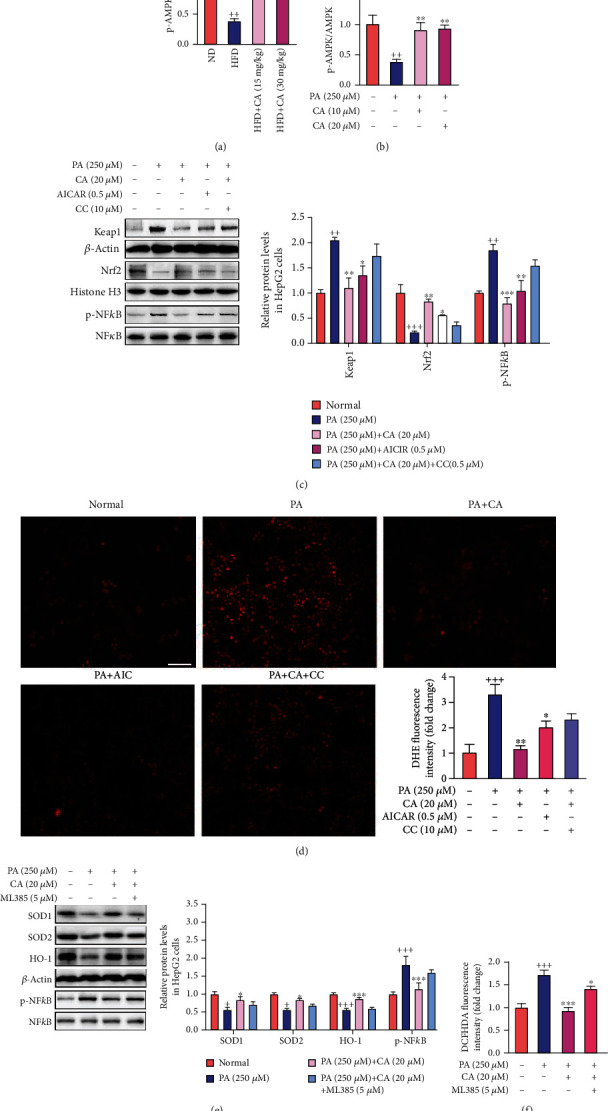
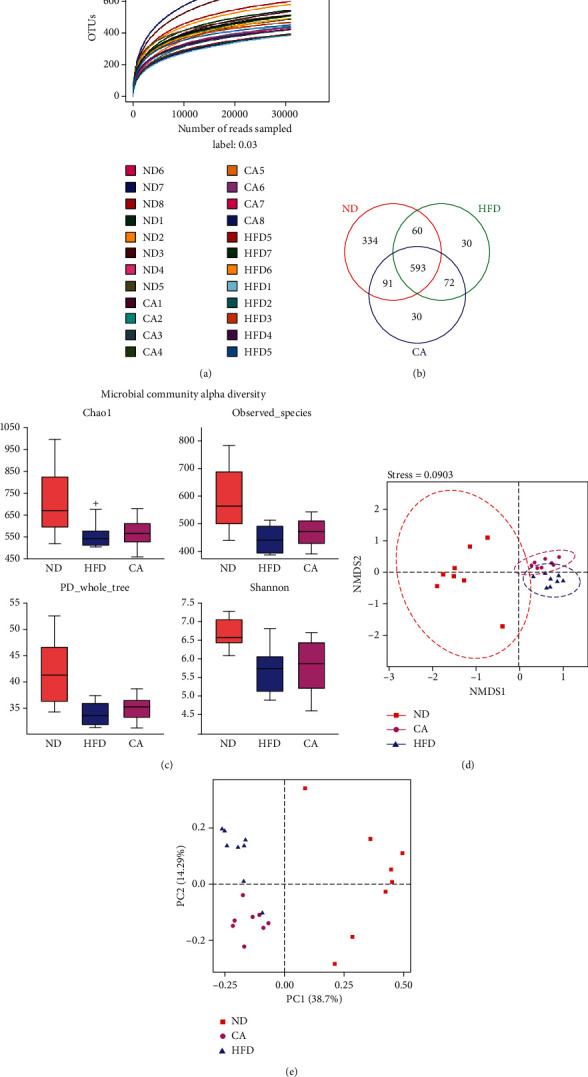
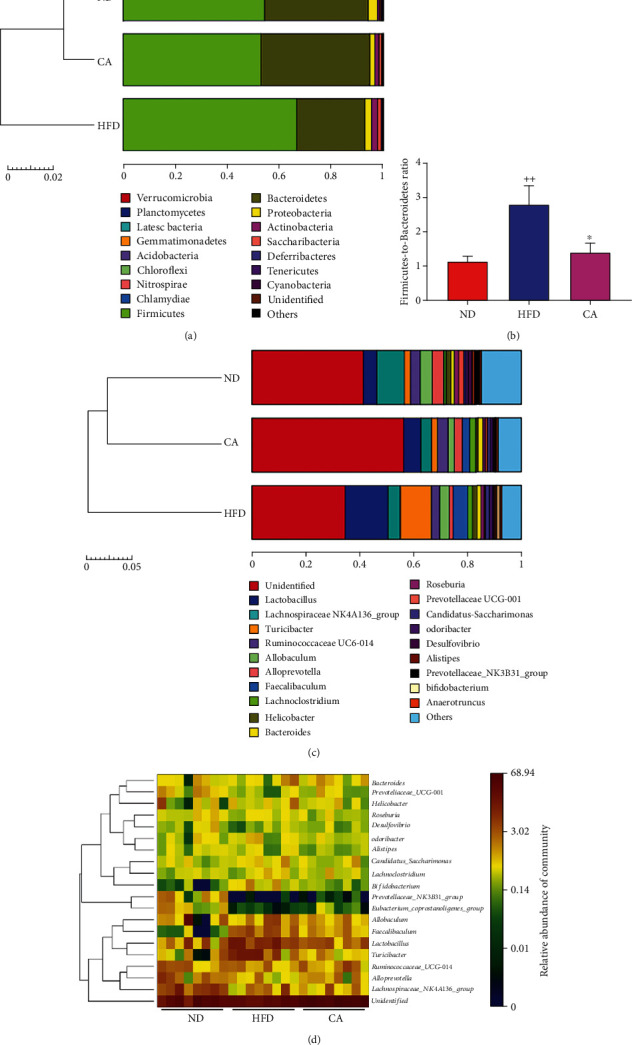
This study examines the effects of chicoric acid (CA) on nonalcoholic fatty liver disease (NAFLD) in high-fat-diet- (HFD-) fed C57BL/6 mice. CA treatment decreased body weight and white adipose weight, mitigated hyperglycemia and dyslipidemia, and reduced hepatic steatosis in HFD-fed mice. Moreover, CA treatment reversed HFD-induced oxidative stress and inflammation both systemically and locally in the liver, evidenced by the decreased serum malondialdehyde (MDA) abundance, increased serum superoxide dismutase (SOD) activity, lowered in situ reactive oxygen species (ROS) in the liver, decreased serum and hepatic inflammatory cytokine levels, and reduced hepatic inflammatory cell infiltration in HFD-fed mice. In addition, CA significantly reduced lipid accumulation and oxidative stress in palmitic acid- (PA-) treated HepG2 cells. In particular, we identified AMPK as an activator of Nrf2 and an inactivator of NFκB. CA upregulated AMPK phosphorylation, the nuclear protein level of Nrf2, and downregulated NFκB protein level both in HFD mice and PA-treated HepG2 cells. Notably, AMPK inhibitor compound C blocked the regulation of Nrf2 and NFκB, as well as ROS overproduction mediated by CA in PA-treated HepG2 cells, while AMPK activator AICAR mimicked the effects of CA. Similarly, Nrf2 inhibitor ML385 partly blocked the regulation of antioxidative genes and ROS overproduction by CA in PA-treated HepG2 cells. Interestingly, high-throughput pyrosequencing of 16S rRNA suggested that CA could increase Firmicutes-to-Bacteroidetes ratio and modify gut microbial composition towards a healthier microbial profile. In summary, CA plays a preventative role in the amelioration of oxidative stress and inflammation via the AMPK/Nrf2/NFκB signaling pathway and shapes gut microbiota in HFD-induced NAFLD.


Conflict of interest statement

The authors declare that they have no conflict of interest.

Figures

Figure 1
Figure 1
Effects of CA on hyperglycemia, dyslipidemia, and inflammation in HFD mice. CA affected body weight (a), white adipose (b), blood glucose (c), serum TC (d), TG (e), HDL-C (f), LDL-C (g), and serum inflammatory cytokines (h) in HFD-fed mice. C57BL/6 mice were randomly divided into four groups: in the ND group, mice were fed with a ND and received 0.9% NaCl solution. In the HFD group, mice were fed with a HFD diet and received 0.9% NaCl solution. In the two HFD+CA groups, mice were fed with a HFD and received 15 mg/kg or 30 mg/kg of CA once daily by oral gavage. Data represent the mean ± SEM, n = 8 per group. +++p < 0.001 vs. ND group. p < 0.05, ∗∗p < 0.01, and ∗∗∗p < 0.001 vs. HFD group.
Figure 2
Figure 2
CA alleviated hepatic lipid accumulation, oxidative stress, inflammation, and liver injury in HFD-fed mice. (a) Hepatic ORO staining (scale bar: 100 μM) and quantitative analysis of lipid content (n = 6). (b) Histological analysis of liver tissues by H&E staining (scale bar: 100 μM); red arrow: cytoplasmic vacuolation; black arrow: inflammatory cell infiltration. (c) NAFLD activity score determined according to the liver section histology analysis (n = 6). (d, e) Serum SOD and MDA activity levels in mice (n = 8). (f) The in situ ROS of the liver detected by DHE staining (scale bar: 50 μM) and the fluorescence intensity analysis (n = 4). (g, h) Serum GPT-ALT and GOT-AST levels in mice (n = 8). Data represent the mean ± SEM. ++p < 0.01 and +++p < 0.001 vs. ND group. ∗∗p < 0.01 and ∗∗∗p < 0.001 vs. HFD group.
Figure 3
Figure 3
CA suppressed the hepatic NFκB pathway and liver inflammation in HFD mice. (a) Hepatic levels of IL-2, IL-6, IL-1β, and TNF-α (n = 8). (b) Hepatic p-IKKα/β, p-IκBα, and p-NFκB protein levels in mice (n = 3). Data represent the mean ± SEM. ++p < 0.01 and +++p < 0.001 vs. ND group. p < 0.05, ∗∗p < 0.01, and ∗∗∗p < 0.001 vs. HFD group.
Figure 4
Figure 4
CA ameliorated lipid accumulation and oxidative stress, as well as inhibited the NFκB pathway in PA-induced HepG2 cells. (a) Cell viability after treatment with different concentrations of CA from 0 to 250 μM for 24 h (n = 8). (b) lipid droplets detected by ORO staining (scale bar: 100 μM) and quantitative analysis of lipid content in HepG2 cells (n = 4). (c) Intracellular TC and TG levels in HepG2 cells (n = 8). (d) The intracellular O2·− and mitochondrial ROS detected by DHE (scale bar: 100 μM), MitoSOX Red staining (scale bar: 50 μM), and the fluorescence intensity analyses in PA-treated HepG2 cells (n = 8). (e) ROS production detected by DCFH-DA detector (n = 8). (f) The protein levels of p-IKKα/β, p-IκBα, and p-NFκB in HepG2 cells (n = 3). Data represent the mean ± SEM. ++p < 0.01 and +++p < 0.001 vs. normal group. ∗∗p < 0.01 and ∗∗∗p < 0.001 vs. PA group.
Figure 5
Figure 5
CA regulated keap1/Nrf2 signaling in the liver of HFD mice and PA-treated HepG2 cells. (a, b) The protein levels of keap1, nuclear Nrf2, SOD1, SOD2, and HO-1 in the liver or HepG2 cells. Data represent the mean ± SEM, n = 3 per group. ++p < 0.01 and +++p < 0.001 vs. ND or normal group. ∗∗p < 0.01 and ∗∗∗p < 0.001 vs. HFD or PA group.
Figure 6
Figure 6
CA suppressed oxidative stress and inflammation via AMPK activation. (a, b) Effects of CA on the phosphorylation of APMK in the liver and HepG2 cells (n = 3). (c) The protein levels of keap1, nuclear Nrf2, and p-NFκB in HepG2 cells (n = 3). (d) ROS production of cells detected by DHE staining (scale bar: 100 μM) and the fluorescence intensity analysis (n = 4). (e) The protein levels of SOD1, SOD2, HO-1, and p-NFκB in HepG2 cells (n = 3). (f) ROS production in HepG2 cells detected by DCFH-DA detector (n = 8). Data represent the mean ± SEM. ++p < 0.01 and +++p < 0.001 vs. ND or normal group. p < 0.05 and ∗∗p < 0.01 vs. HFD or PA group.
Figure 7
Figure 7
Effect of CA (30 mg/kg) treatment on the relative abundance of gut microbial community in HFD mice. (a) Rarefaction curve for each sample (ND1-ND8: mice fed with a ND and received 0.9% NaCl solution; HFD1-8: mice fed with a HFD diet and received 0.9% NaCl solution; CA1-8: mice fed with a HFD and received 30 mg/kg of CA once daily by oral gavage). (b) Venn diagram of the overlap of the OTUs in the gut microbiota in different treatments. (c) The bacterial richness in gut estimated by alpha-diversity of chao1, observed_species, PD_whole_tree, and Shannon indexes. The β-diversity analysis of nonmetric multidimensional scaling (NMDS) (d) and principle coordinate analysis (PCoA) (e). Data represent the mean ± SEM, n = 8. +p < 0.05 vs. ND group.
Figure 8
Figure 8
Effect of CA treatment on the population structure of gut microbiota in HFD mice. (a) Bar plot analysis of microbial community at the phylum level in mice. (b) The alteration in the Firmicutes-to-Bacteroidetes ratio in mice. Bar plot analysis (c) and heat map analysis (d) of microbial community at the genus level in mice. Data represent the mean ± SEM, n = 8 per group. ++p < 0.001 vs. ND group. p < 0.05 vs. HFD group.

References

    1. Musso G., Cassader M., Gambino R. Non-alcoholic steatohepatitis: emerging molecular targets and therapeutic strategies. Drug Discovery. 2016;15(4):249–274. doi: 10.1038/nrd.2015.3. - DOI - PubMed
    1. Younossi Z., Anstee Q. M., Marietti M., et al. Global burden of NAFLD and NASH: trends, predictions, risk factors and prevention. Gastroenterology & Hepatology. 2018;15(1):11–20. doi: 10.1038/nrgastro.2017.109. - DOI - PubMed
    1. Buzzetti E., Pinzani M., Tsochatzis E. A. The multiple-hit pathogenesis of non-alcoholic fatty liver disease (NAFLD) Metabolism. 2016;65(8):1038–1048. doi: 10.1016/j.metabol.2015.12.012. - DOI - PubMed
    1. Wanless I. R., Shiota K. The pathogenesis of nonalcoholic steatohepatitis and other fatty liver diseases: a four-step model including the role of lipid release and hepatic venular obstruction in the progression to cirrhosis. Seminars in Liver Disease. 2004;24(1):99–106. doi: 10.1055/s-2004-823104. - DOI - PubMed
    1. Sumida Y., Yoneda M. Current and future pharmacological therapies for NAFLD/NASH. Journal of Gastroenterology. 2018;53(3):362–376. doi: 10.1007/s00535-017-1415-1. - DOI - PMC - PubMed

MeSH terms