. 2020 Oct 21;7(10):200872.
doi: 10.1098/rsos.200872. eCollection 2020 Oct.

An integrative machine learning approach to discovering multi-level molecular mechanisms of obesity using data from monozygotic twin pairs

Affiliations

An integrative machine learning approach to discovering multi-level molecular mechanisms of obesity using data from monozygotic twin pairs

Milla Kibble et al. R Soc Open Sci. .

Abstract

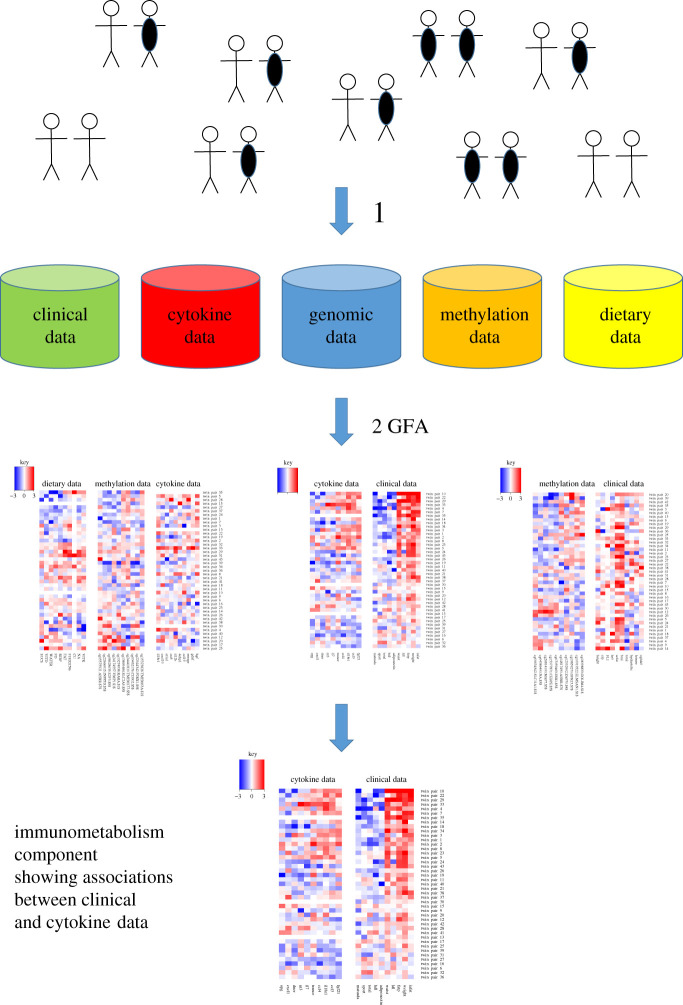
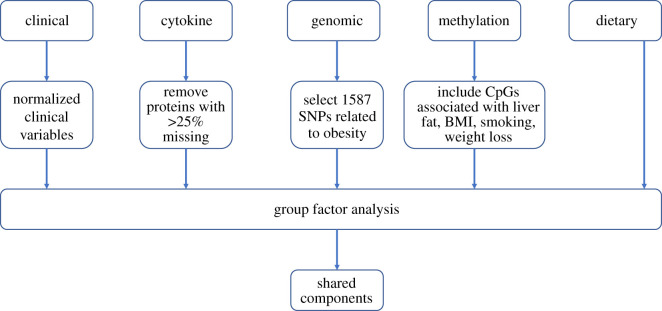
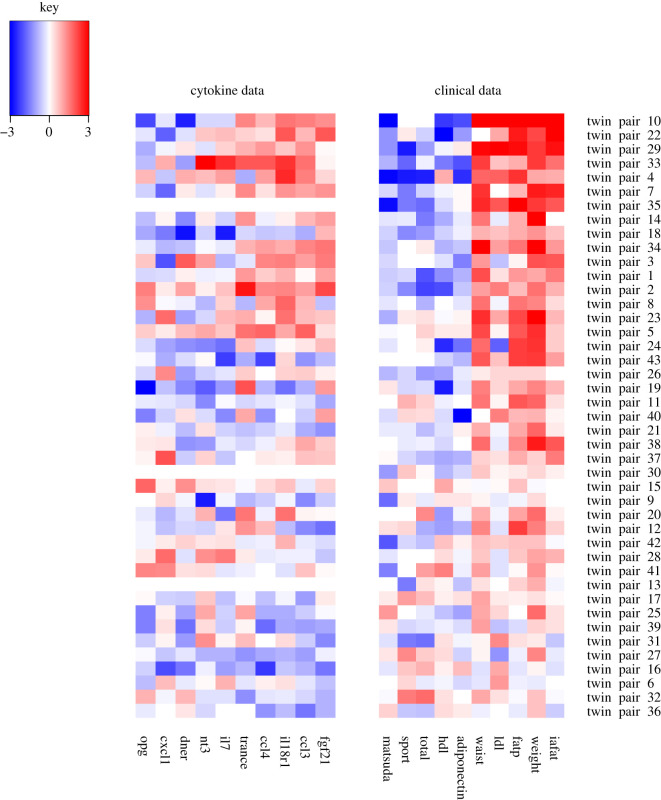
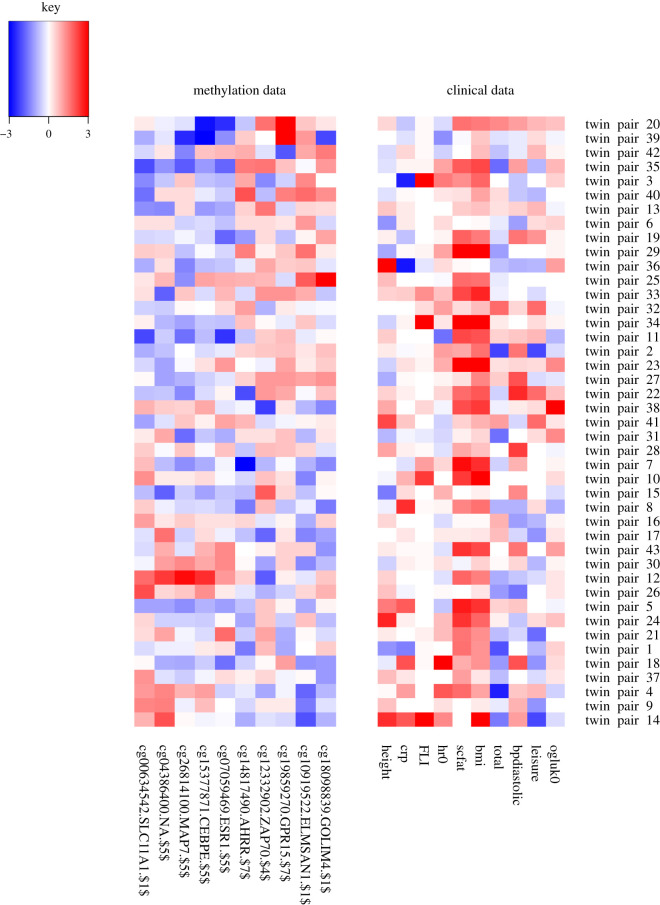
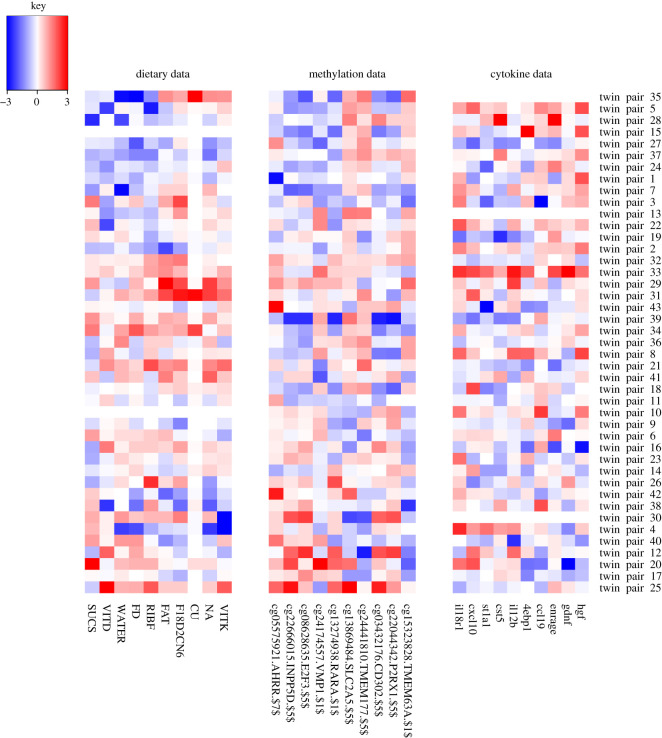
We combined clinical, cytokine, genomic, methylation and dietary data from 43 young adult monozygotic twin pairs (aged 22-36 years, 53% female), where 25 of the twin pairs were substantially weight discordant (delta body mass index > 3 kg m-2). These measurements were originally taken as part of the TwinFat study, a substudy of The Finnish Twin Cohort study. These five large multivariate datasets (comprising 42, 71, 1587, 1605 and 63 variables, respectively) were jointly analysed using an integrative machine learning method called group factor analysis (GFA) to offer new hypotheses into the multi-molecular-level interactions associated with the development of obesity. New potential links between cytokines and weight gain are identified, as well as associations between dietary, inflammatory and epigenetic factors. This encouraging case study aims to enthuse the research community to boldly attempt new machine learning approaches which have the potential to yield novel and unintuitive hypotheses. The source code of the GFA method is publically available as the R package GFA.

Keywords: big data; machine learning; monozygotic twins; obesity.


Conflict of interest statement

We have no competing interests.

Figures

Figure 1.
Figure 1.
Pipeline for the GFA analysis on MZ twin pairs. (1) Clinical, cytokine, genomic, methylation and dietary data were collected from 43 young adult monozygotic twin pairs, where 25 of the twin pairs were substantially weight discordant (delta BMI > 3 kg m–2). For each twin pair and each variable, the value for the leaner twin was subtracted from the value for the heavier twin. This resulted in five large data matrices comprising 42, 71, 1587, 1605 and 63 variables, respectively. (2) All five large data matrices were input into the group factor analysis (GFA) computational tool, giving rise to 38 so-called component diagrams (three of which are shown in this figure). Each component diagram has up to five small heatmaps picturing the associations discovered within or between the five datasets. The magnified component is the immunometabolism component, also in figure 3.
Figure 2.
Figure 2.
A data processing flow-chart for the GFA analysis.
Figure 3.
Figure 3.
The immunometabolism component. The method has picked up associations between clinical data and cytokine data. The twin pairs seem to be ordered roughly by fat percentage (fatp) discordance, with the most discordant pairs at the top of the picture also having high negative HDL and adiponectin difference (in other words the heavier twin in the pair has a lower value of HDL and adiponectin than the leaner twin). Because we are working with difference values (value for the heavier twin in the pair minus the value for the leaner twin in the pair), the BMI column will throughout the analyses be completely red (indicating positive values), because the BMI for the heavier twin minus the BMI for the leaner twin will always be by design a positive value. Likewise, through all of the components certain other variables highly correlated with BMI are completely red, such as weight, subcutaneous fat, liver fat and fat percentage, and variables inversely correlated with BMI are blue, such as adiponectin. Full description of the clinical variables: adiponectin, fasting plasma adiponectin concentration; fatp, percentage body fat; hdl, fasting plasma high density lipoprotein concentration; iafat, intra-abdominal fat volume; ldl, fasting plasma low density lipoprotein concentration; matsuda, Matsuda index; sport, sport index; total, total physical activity index; waist, waist circumference; weight, body weight.
Figure 4.
Figure 4.
The leisure time physical activity component. As can be seen in table 1, the maximum within pair difference in the leisure time activity index is 1.25, which can be considered large (these index values usually have mean 3 and a range of 3.25). Full description of the clinical variables: bpdiastolic, diastolic blood pressure; bmi, body mass index; crp, C-reactive protein; FLI, fatty liver index; height, height; hr0, heart rate; leisure, leisure time index; ogluk0, fasting plasma glucose concentration; scfat, subcutaneous fat volume; total, total physical activity index.
Figure 5.
Figure 5.
The epigenetic component. Full description of the dietary variables: CU, copper; FAT, fat; F18D2CN6, fatty acid 18:2-n6; FD, fluoride; NA, sodium; RIBF, riboflavine; SUCS, sucrose; VITD, vitamin D; VITK, vitamin K; WATER, water.

References

    1. World Health Organization. 2018. Obesity and overweight. See http://www.who.int/news-room/fact-sheets/detail/obesity-and-overweight.
    1. Font-Burgada J, Sun B, Karin M. 2016. Obesity and cancer: the oil that feeds the flame. Cell Metab. 23, 48–62. (10.1016/j.cmet.2015.12.015) - DOI - PubMed
    1. Afshin A, et al. . 2017. Health effects of overweight and obesity in 195 countries over 25 years. New Engl. J. Med. 377, 13–27. (10.1056/NEJMoa1614362) - DOI - PMC - PubMed
    1. Ng M, et al. 2014. Global, regional, and national prevalence of overweight and obesity in children and adults during 1980–2013: a systematic analysis for the Global Burden of Disease Study 2013. Lancet 384, 766–781. (10.1016/S0140-6736(14)60460-8) - DOI - PMC - PubMed
    1. van Dongen J, et al. 2015. Longitudinal weight differences, gene expression and blood biomarkers in BMI-discordant identical twins. Int. J. Obes. 39, 899–909. (10.1038/ijo.2015.24) - DOI - PMC - PubMed

LinkOut - more resources