

Global Seasonality of Human Coronaviruses: A Systematic Review
- PMID: 33204751
- PMCID: PMC7651300
- DOI: 10.1093/ofid/ofaa443
Global Seasonality of Human Coronaviruses: A Systematic Review
Abstract
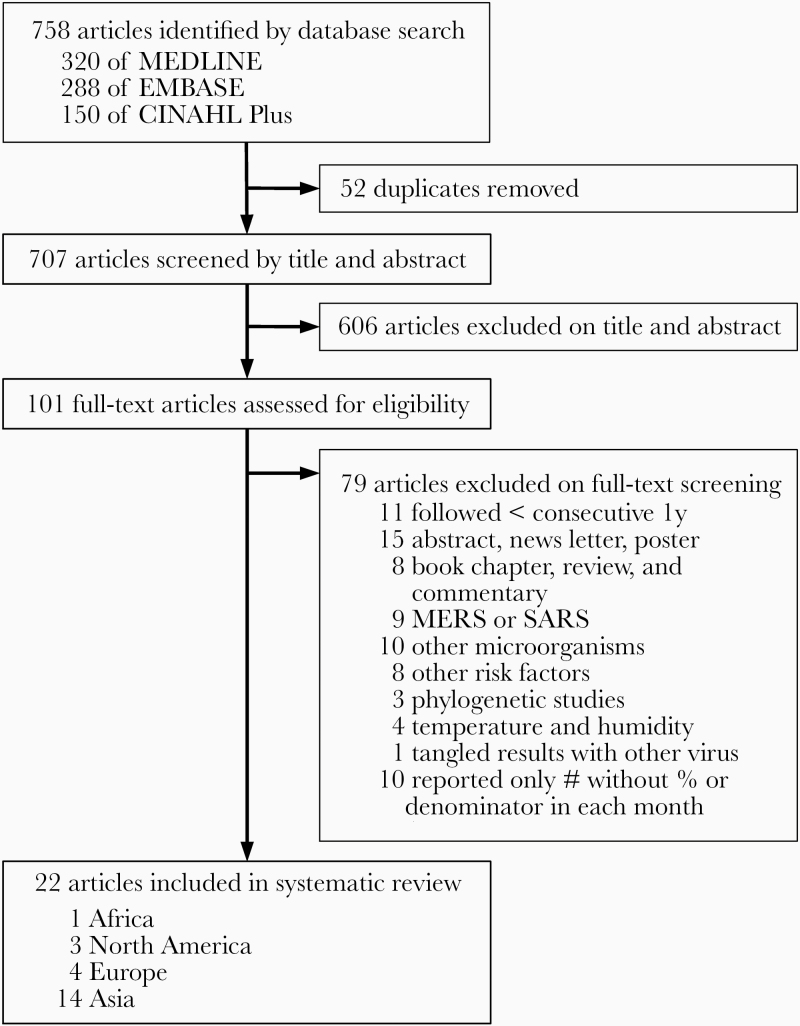
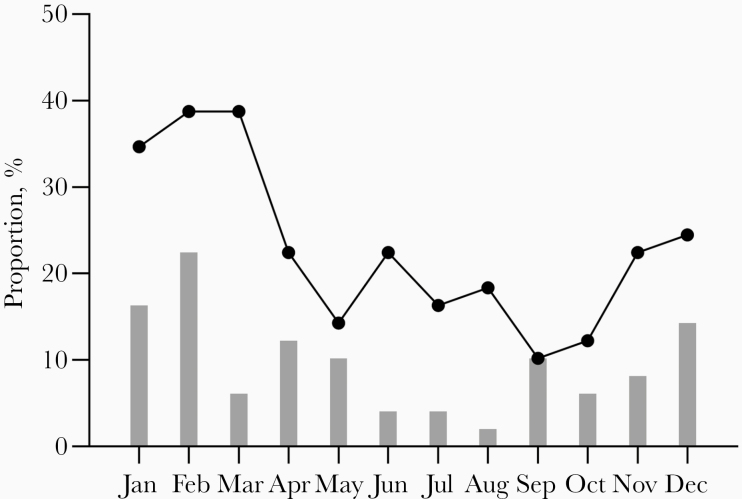
In the context of the coronavirus disease 2019 pandemic, we aimed to systematically address the global seasonal patterns of human coronavirus (HCoV) infections. We identified relevant articles from MEDLINE, EMBASE, and CINAHL Plus as of May 11, 2020. The main outcomes were the peak months of HCoV infections each year and the months during which more than 5% of positive respiratory specimen tests were attributable to HCoV. Of 707 articles reviewed, 22 met the inclusion criteria. The annual percentage of HCoV infections reached a peak in February globally. We found a higher HCoV positivity rate among studies that tested only children (median: 5.9%, range: 0.9%-18.4%), compared with other studies of adults alone (median: 5.2%, range: 3.3%-7.1%) or the entire population (median: 1.9%, range: 0.2%-8.1%). We found the largest global peak of HCoV during the winter season, with the highest rate of positivity among children.
Keywords: climate; coronavirus; epidemic; seasonality; weather.
© The Author(s) 2020. Published by Oxford University Press on behalf of Infectious Diseases Society of America.
Figures
References
Publication types
LinkOut - more resources
Full Text Sources
Other Literature Sources
Miscellaneous
