. 2020 Sep 19;23(10):101582.
doi: 10.1016/j.isci.2020.101582. eCollection 2020 Oct 23.

Single-Cell Profiling Reveals Divergent, Globally Patterned Immune Responses in Murine Skin Inflammation

Affiliations

Single-Cell Profiling Reveals Divergent, Globally Patterned Immune Responses in Murine Skin Inflammation

Yale Liu et al. iScience. .

Abstract

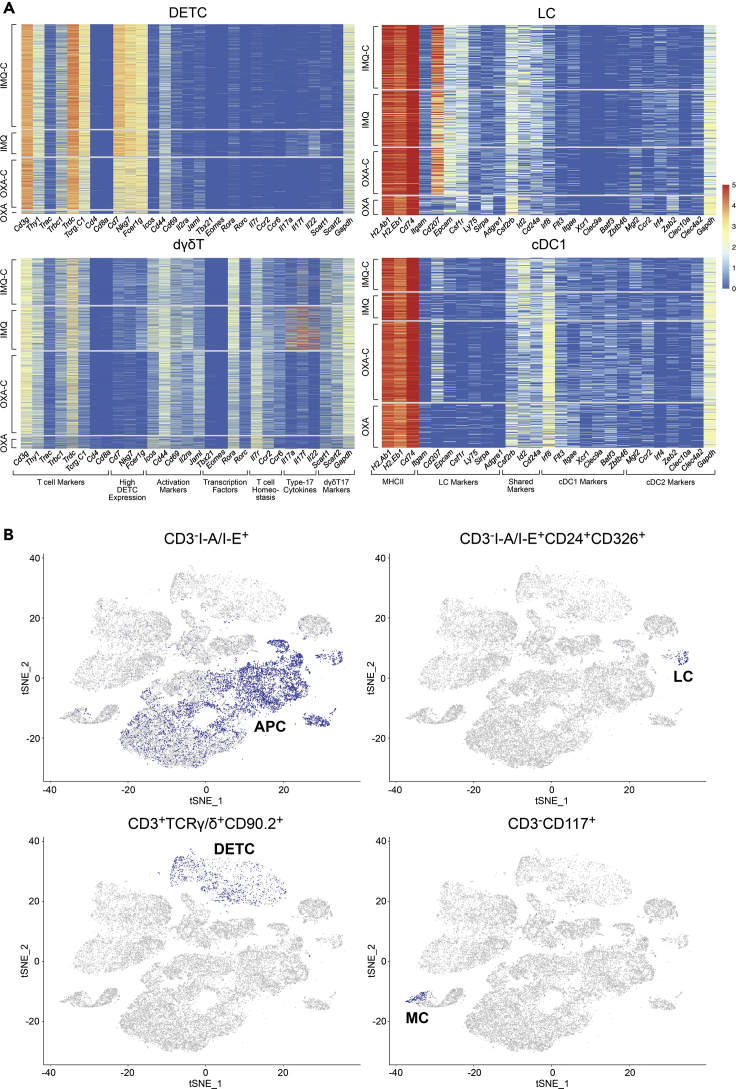
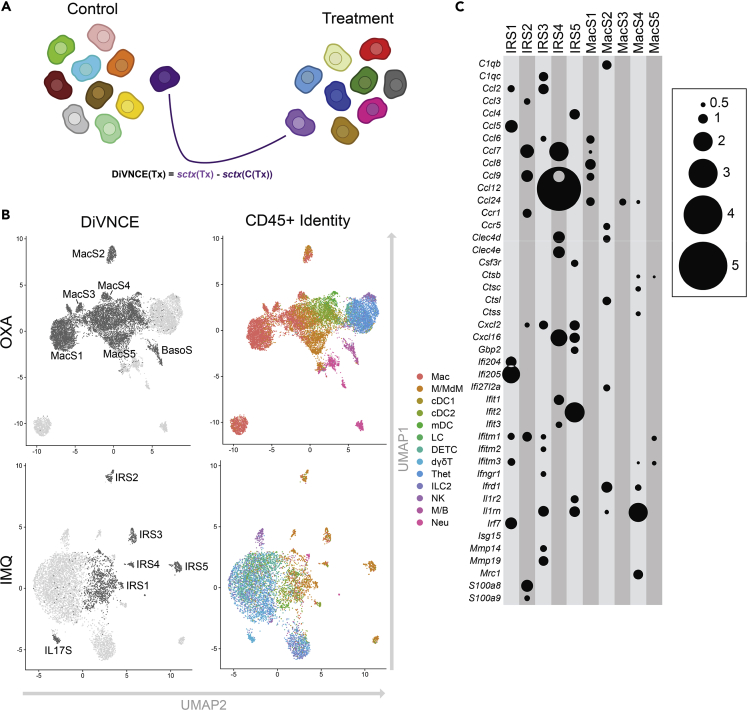
Inflammatory response heterogeneity has impeded high-resolution dissection of diverse immune cell populations during activation. We characterize mouse cutaneous immune cells by single-cell RNA sequencing, after inducing inflammation using imiquimod and oxazolone dermatitis models. We identify 13 CD45+ subpopulations, which broadly represent most functionally characterized immune cell types. Oxazolone pervasively upregulates Jak2/Stat3 expression across T cells and antigen-presenting cells (APCs). Oxazolone also induces Il4/Il13 expression in newly infiltrating basophils, and Il4ra and Ccl24, most prominently in APCs. In contrast, imiquimod broadly upregulates Il17/Il22 and Ccl4/Ccl5. A comparative analysis of single-cell inflammatory transcriptional responses reveals that APC response to oxazolone is tightly restricted by cell identity, whereas imiquimod enforces shared programs on multiple APC populations in parallel. These global molecular patterns not only contrast immune responses on a systems level but also suggest that the mechanisms of new sources of inflammation can eventually be deduced by comparison to known signatures.

Keywords: Immunology; Systems Biology.


Conflict of interest statement

A.J.S. and S.C.B. are employees of ImmunityBio Inc, S.C.B. is an equity holder of ImmunityBio Inc. The remaining authors disclose no conflicts.

Figures

None
Graphical abstract
Figure 1
Figure 1
Single-Cell Profiling Demarcates Key Immune Cell Populations in Murine Skin (A) t-SNE map shows 13 immune cell classes conserved across treatment conditions, delineated by Louvain clustering. Each dot represents one of 44,130 profiled cells. (B) Relative proportions for each immune cell population for each paired treatment condition and its control. Top panel shows imiquimod (IMQ, blue), and imiquimod control (IMQ-C, green). Bottom panel shows oxazolone (OXA, red) and oxazolone control (OXA-C, turquoise). (C) Immune cell population marker transcript expression levels (x axis) for the 13 immune cell populations (y axis). Size of dots represents the fraction of cells expressing a particular marker, and color intensity indicates mean normalized scaled expression levels. (D) Violin plots show normalized transcript expression distribution on a per cluster basis for selected immune cell population marker genes that distinguish major populations. Cd163, Mrc1, and Folr2 for macrophages; Clec9a for cDC1; Sirpa in macrophages, monocytes, and cDC2; Cd207 for LC; and Cd4, Cd8a, and Foxp3 for Thet. Each dot represents gene expression of a single cell, and the kernel density plot shape represents the overall distribution. See also Figure S1 and Tables S1, S2 and S3.
Figure 2
Figure 2
Cluster-Specific Single-Cell Transcript and Protein Expression Validates Immune Cell Population Assignments (A) Cluster-specific heatmaps show normalized RNA expression count values of selected marker genes on the x axis and single cells on the y axis. Cells are ordered on y axis by treatment condition (IMQ-C, IMQ, OXA-C, OXA). (B) Projection of protein epitope (CITE-seq) expression “gated” immune cell populations from OXA-C/OXA datasets onto transcript-based t-SNE plot from Figure 1A. Depicted are CD3I-A/I-E+ APC cells, CD3I-A/I-E+CD24+CD326+ Langerhans cells, CD3+TCRγ/δ+CD90.2+ DETCs, and CD3CD117+ mast cells. See also Figure S2 and Tables S2 and S3.
Figure 3
Figure 3
Oxazolone and Imiquimod Divergently Reprogram Immune Cells (A) Stacked bar plots showing relative percentages of each immune cell population for each of the treatment conditions (IMQ-C, IMQ, OXA-C, and OXA). (B) Unsupervised hierarchical clustering heatmap for treatment-induced differentially expressed genes on a per cluster basis. Columns depict average logFC of oxazolone- or imiquimod-treated cells (versus control) for each cluster. Rows depict selected treatment-specific DEGs for OXA versus OXA-C and IMQ versus IMQ-C. (C–F) (C) Cluster-specific scatterplots showing OXA or IMQ treatment-induced differentially expressed genes for macrophages, (D) M/MdM cells, (E) dγδT cells, and (F) M/B populations (avg_logFC for OXA DEGs relative to OXA-C on y axis and IMQ DEGs relative to IMQ-C on x axis). Pseudocolored dots represent significant DEGs (p.adj <0.05) for OXA (red), IMQ (blue), or both treatments (purple). See also Figures S3 and S4 and Tables S4 and S5.
Figure 4
Figure 4
Infiltrating Basophils Produce Il4 and Il13 after Oxazolone but Not Imiquimod Treatment of Murine Skin (A) Heatmap displaying count values for the top 100 most variable genes (y axis) defined by pseudotime (x axis) for M/B population cells. Two nonredundant and non-covariate k-means-defined subpopulations are denoted by the color bar at the top of the panel (mast cells, red, left; basophils, blue, right). Rows represent genes and columns represent single cells of the M/B cluster. (B) Feature plots showing mast and basophil marker expression projected onto the t-SNE M/B cluster from Figure 1A. Each row depicts transcript expression of a different marker gene for mast cells (c-Kit RNA and protein [CITE-seq] and Mcpt4) and basophils (Itgam, Mcpt8). Each column shows M/B population t-SNE plots representing only the cells from the treatment condition listed at the top. (C) Principal-component analysis (PCA) of mast cells (orange/red, left) and basophils (blue/green, right) demonstrating these subpopulations do not share a differentiation trajectory. (D) Differential gene expression volcano plot between mast cells and basophils. x axis depicts the average logFC for basophils relative to mast cells. y axis depicts –log10(p.adj). Significant genes are defined as |avg_logFC |≥1 and p.adj ≤0.05 [–log10(p.adj) ≥1.3]. Blue dots represent basophil, and red dots represent mast cell upregulated genes. See also Table S4.
Figure 5
Figure 5
DiVNCE Analysis Yields High Degree of Compartmentalization by Cell Identity for Oxazolone but not Imiquimod Transcriptional Response in CD45+ Cells (A) Schematic representation by which DiVNCE identifies the most similar, “neighboring” control cell for each treatment cell and then catalogs their transcriptional differences. (B) UMAP representation showing partitioning of oxazolone-treated cells based on 12 DiVNCE profiles (six highlighted for comparison, upper left panel), with same clusters colored by cell identities as depicted in Figure 1A (upper right). Lower left panel shows imiquimod-treated cells partitioned on 11 DiVNCE profiles (six highlighted for comparison) and same clusters colored by cell identity (lower right). Mac clusters 1–5 represent five DiVNCE patterns finely subdividing macrophages in the Mac classification, highlighting greater compartmentalization. In contrast, in the IMQ dataset, interferon-responsive DiVNCE signatures (IRS 1–5) are each shown by multiple APC types, showing mixing and lower relative compartmentalization. Also displayed for validation are unbiased detection of a basophil Mcpt8/Il13 DiVINCE signature in the OXA M/B granulocyte cell identity cluster and an IL17 signature in a subset of IMQ dermal γδ T cells (Figure S6 and Table S6). (C) Log2-fold elevations from DiVNCE comparisons (represented by circle size) for inflammatory transcripts (y axis) for MacS S and IRS signatures (x axis), all p.adj <1 × 10−3. See also Figure S5 and Table S6.

References

    1. Ainscough J.S., Macleod T., McGonagle D., Brakefield R., Baron J.M., Alase A., Wittmann M., Stacey M. Cathepsin S is the major activator of the psoriasis-associated proinflammatory cytokine IL-36γ. Proc. Natl. Acad. Sci. U S A. 2017;114:E2748–E2757. - PMC - PubMed
    1. Akahoshi M., Song C.H., Piliponsky A.M., Metz M., Guzzetta A., Abrink M., Schlenner S.M., Feyerabend T.B., Rodewald H.-R., Pejler G. Mast cell chymase reduces the toxicity of Gila monster venom, scorpion venom, and vasoactive intestinal polypeptide in mice. J. Clin. Invest. 2011;121:4180–4191. - PMC - PubMed
    1. Bros M., Dexheimer N., Ross R., Trojandt S., Höhn Y., Tampe J., Sutter A., Jährling F., Grabbe S., Reske-Kunz A.B. Differential gene expression analysis identifies murine Cacnb3 as strongly upregulated in distinct dendritic cell populations upon stimulation. Gene. 2011;472:18–27. - PubMed
    1. Cheng J.B., Sedgewick A.J., Finnegan A.I., Harirchian P., Lee J., Kwon S., Fassett M.S., Golovato J., Gray M., Ghadially R. Transcriptional programming of normal and inflamed human epidermis at single-cell resolution. Cell Rep. 2018;25:871–883. - PMC - PubMed
    1. Croft A.P., Campos J., Jansen K., Turner J.D., Marshall J., Attar M., Savary L., Wehmeyer C., Naylor A.J., Kemble S. Distinct fibroblast subsets drive inflammation and damage in arthritis. Nature. 2019;570:246–251. - PMC - PubMed