. 2020 Jul 21;1(4):100056.
doi: 10.1016/j.xcrm.2020.100056.

Molecular Profiling Reveals a Common Metabolic Signature of Tissue Fibrosis

Affiliations

Molecular Profiling Reveals a Common Metabolic Signature of Tissue Fibrosis

Ji Zhang et al. Cell Rep Med. .

Abstract

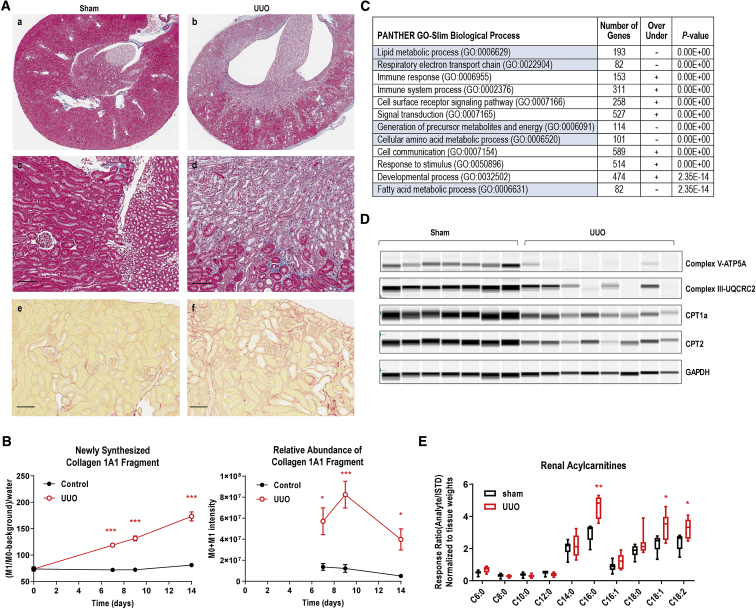
Fibrosis, or the accumulation of extracellular matrix, is a common feature of many chronic diseases. To interrogate core molecular pathways underlying fibrosis, we cross-examine human primary cells from various tissues treated with TGF-β, as well as kidney and liver fibrosis models. Transcriptome analyses reveal that genes involved in fatty acid oxidation are significantly perturbed. Furthermore, mitochondrial dysfunction and acylcarnitine accumulation are found in fibrotic tissues. Substantial downregulation of the PGC1α gene is evident in both in vitro and in vivo fibrosis models, suggesting a common node of metabolic signature for tissue fibrosis. In order to identify suppressors of fibrosis, we carry out a compound library phenotypic screen and identify AMPK and PPAR as highly enriched targets. We further show that pharmacological treatment of MK-8722 (AMPK activator) and MK-4074 (ACC inhibitor) reduce fibrosis in vivo. Altogether, our work demonstrate that metabolic defect is integral to TGF-β signaling and fibrosis.

Keywords: AMPK; MK-4074; MK-8722; PGC1α; PPAR; TGF-β; fatty acid oxidation; fibrosis; metabolism.


Conflict of interest statement

The authors are current or former employees of Merck Sharp & Dohme Corp., a subsidiary of Merck & Co., Inc., Kenilworth, NJ, USA, and/or shareholders of Merck & Co., Inc., Kenilworth, NJ, USA. P.S.K. is a current employee and/or shareholder of Jnana Therapeutics. P.C. is a current employee and/or shareholder of PRA Health Sciences. Y.Z. is a current employee and/or shareholder of HistoBridge, LLC. Y.H. and T.E.A. are current employees of FDA. T-Q.C. is a current employee and/or shareholder of Calico Life Sciences. J.C. is a current employee and/or shareholder of AstraZeneca. L-J.M. is a current employee and/or shareholder of Johnson and Johnson. M.H. is a current employee and/or shareholder of Maze Therapeutics. K.K.J. is a current employee and/or shareholder of Shrὄdinger, Inc. I.K.S and S.P. are current employees and/or shareholders of Kallyope, Inc.

Figures

None
Graphical abstract
Figure 1
Figure 1
Transcriptome Analysis Identifies a Common Metabolic Signature in Human Primary Cells Treated with TGF-β (A) Schematic overview of RNA-seq analyses of four human primary cell types with TGF-β treatment. 3 independent replicates were used for each time point collection. (B) RT-PCR analysis of αSMA gene expression in human primary cells upon TGF-β treatment (5 ng/mL for 24 h), which was almost completely reversed by the presence of ALK5 inhibitor, SB-525334 (10 μM). n = 3, Mean ± SD. (C) Common effects of TGF-β across four cell types. Shown are the 1,603 genes that met the ±1.2-fold change and FDR_BH p < 0.1 threshold at 24 h in all four cell types. The color gradient represents fold change compared to vehicle-treated cells (−3.0 to 3.0-fold). (D) GO term enrichment analysis of the 1,603 genes using the PANTHER enrichment test (http://pantherdb.org). (E) Gene expression ratios of fatty acid oxidation enzymes in human primary cells and fibrotic tissues. From left: cardiac fibroblasts, hepatic stellate cells (HSCs), NHLF, RPTEC, UUO kidney, CCl4 liver, and BDL liver. Heatmap was generated by using Morpheus software (https://software.broadinstitute.org/morpheus/). The color gradient represents fold change compared treatment (TGF-β 24 h, surgery, or CCl4 treatment) to control (−8.5 to 8.5-fold). Gray, below detection limit. ∗Peroxisomal enzymes.
Figure 2
Figure 2
Downregulation of Fatty Acid Oxidation in UUO Kidneys (A) Histological analyses of normal (sham) and UUO kidneys at day 9. (a–d) trichrome staining revealed renal pelvis and calyces blunting, cortical and medullary atrophy, tubular dilation, tubular epithelial cell apoptosis/necrosis, inflammatory cell infiltration, and diffuse interstitial fibrosis in UUO kidney. (e and f) Sirius red staining. Representative images taken from n = 6∼9 animal/group. Scale bar, 100 μm. (B) Increased newly synthesized collagen in UUO kidneys as measured by 2H-water labeling and proteomic analyses. Collagen 1A1 fragment GAAGPPGATGFPGAAGR was shown. Left panel, newly synthesized; right panel, relative abundance. Mean ± SEM (time point: day 0, n = 3/group; days 7 and 9, and 14, n = 4 for Sham, and n = 7 for UUO). ∗p < 0.05, ∗∗∗p < 0.005, Student t test. (C) GO term enrichment analysis of the 5,031 genes shown in Figure S2C, using the PANTHER enrichment test. Shown here are the top 12 biological process terms with metabolic-related terms highlighted in blue. n = 5 per treatment group or time point for RNA-seq analysis. (D) The protein expression of key fatty acid oxidation regulators by Sally Sue simple western. (D) Acylcarnitine profile of Sham (n = 6) versus UUO (n = 9) kidneys at day 10 following the surgery. Min to Max, ∗p < 0.05, ∗∗p < 0.01, Student t test.
Figure 3
Figure 3
Defective Metabolic Signature in Liver Fibrosis Models (A) Masson’s trichrome staining of mouse liver found significant collagen deposition around pericentral areas at week 7 following CCl4 treatment. (a and b) Lower magnification; (c and d), higher magnification. Scale bar, 100 μm. (B) Quantitative analysis of trichrome positive area from whole-liver scan. Mean ± SEM, n = 5, ∗∗∗p < 0.005, Student t test. (C) Increased newly synthesized collagen in CCl4-treated liver as measured by 2H-water labeling and proteomic technology. Collagen 1A1 fragment DGLNGLpGPIGppGPR was shown. Mean ± SEM, n = 4∼5, ∗p < 0.05, ∗∗∗p < 0.005, Student t test. (D) RNA-seq analyses of livers from vehicle or CCl4-treated mice at week 5. GO term enrichment analysis revealed metabolic-related terms. n = 5 per treatment group. (E) Masson’s trichrome staining of rat liver found extensive peribiliary and interstitial collagen deposition at week 5. (a and b) lower magnification; (c and d) higher magnification. Scale bar, 100 μm. (F) Quantitative analysis of trichrome positive area from whole-liver scan. Mean ± SEM, n = 5, Student t test, ∗∗∗p < 0.005. (G) Increased newly synthesized collagen in bile duct-ligated liver as measured by 2H-water labeling and proteomic analyses. Collagen 1A1 fragment DGLNGLpGPIGppGPR was shown. Mean ± SEM, n = 5∼6, ∗∗∗p < 0.005, Student t test. (H) RNA-seq analyses of livers from sham-operated or bile duct-ligated rats at week 4. GO term enrichment analysis revealed metabolic-related terms. n = 5 per treatment group.
Figure 4
Figure 4
Reverse Fibrosis by Metabolic Modulators (A) Fibroblast phenotypic screen identified targets highly enriched in metabolic regulation. For αSMA imaging, representative stitched images of four views per well are shown. αSMA immunofluorescence staining, green; Hoechst 33342 nuclear staining, blue. (B) Inhibition of 3H-proline incorporation in normal human lung fibroblasts by MRL-24 (PPARγ agonist), GW501506 (PPARδ agonist), and MK-8722 (pan-AMPK activator) in a 3-point dose titration study. 3 independent replicates were obtained. (C) The effect of AMPK activator (MK-8722) on fibrotic marker gene expression in lung fibroblasts. 3 independent replicates were obtained. (D) The effect of MK-8722 and MK-4074 (ACC inhibitor) on pro-collagen I production in RPTECs. 3 independent replicates were obtained. (E) MK-8722, MK-4074, and Telmisartan reduced liver fibrosis in STAM mouse NASH model. Top panel, liver triglyceride (TG) content; bottom panel, fibrosis as determined by Sirius red staining positive area in the liver. Mean ± SEM, n = 6∼8, ∗p < 0.05, ∗∗p < 0.01, ∗∗∗p < 0.005, one-way ANOVA followed by Tukey’s test.

References

    1. WHO . World Health Organization; 2014. Global Status Report on Noncommunicable Diseases 2014.
    1. Krumholz H.M. Treatment of Cholesterol in 2017. JAMA. 2017;318:417–418. - PubMed
    1. Coffman T.M. The inextricable role of the kidney in hypertension. J. Clin. Invest. 2014;124:2341–2347. - PMC - PubMed
    1. Jellinger P.S., Handelsman Y., Rosenblit P.D., Bloomgarden Z.T., Fonseca V.A., Garber A.J., Grunberger G., Guerin C.K., Bell D.S.H., Mechanick J.I. American Association of Clinical Endocrinologists and American College of Endocrinology Guidelines for Management of Dyslipidemia And Prevention of Cardiovascular Disease - Executive SUMMARY Complete Appendix to Guidelines available at. Endocr. Pract. 2017;23:479–497. http://journals.aace.com - PubMed
    1. American Diabetes Association Pharmacologic Approaches to Glycemic Treatment: Standards of Medical Care in Diabetes-2018. Diabetes Care. 2018;41(Suppl 1):S73–S85. - PubMed

MeSH terms