. 2020 Oct 20;1(7):100127.
doi: 10.1016/j.xcrm.2020.100127.

CD103+CD8+ TRM Cells Accumulate in Tumors of Anti-PD-1-Responder Lung Cancer Patients and Are Tumor-Reactive Lymphocytes Enriched with Tc17

Affiliations

CD103+CD8+ TRM Cells Accumulate in Tumors of Anti-PD-1-Responder Lung Cancer Patients and Are Tumor-Reactive Lymphocytes Enriched with Tc17

Stéphanie Corgnac et al. Cell Rep Med. .

Abstract

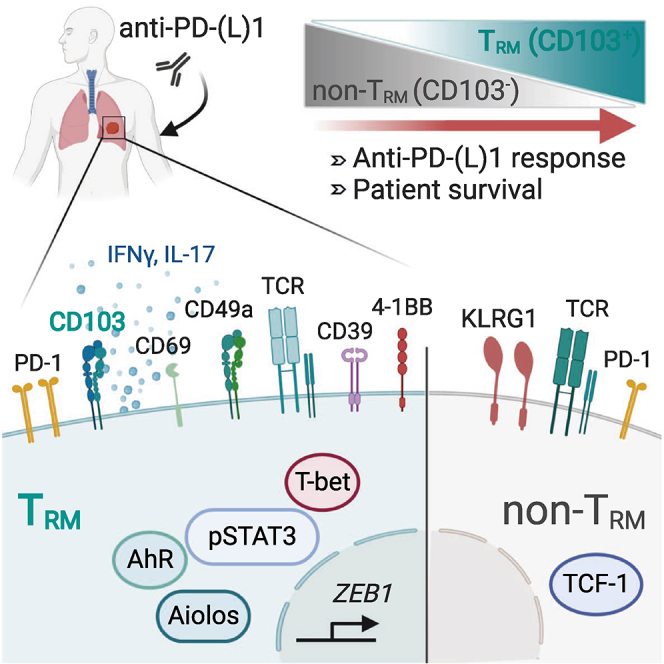
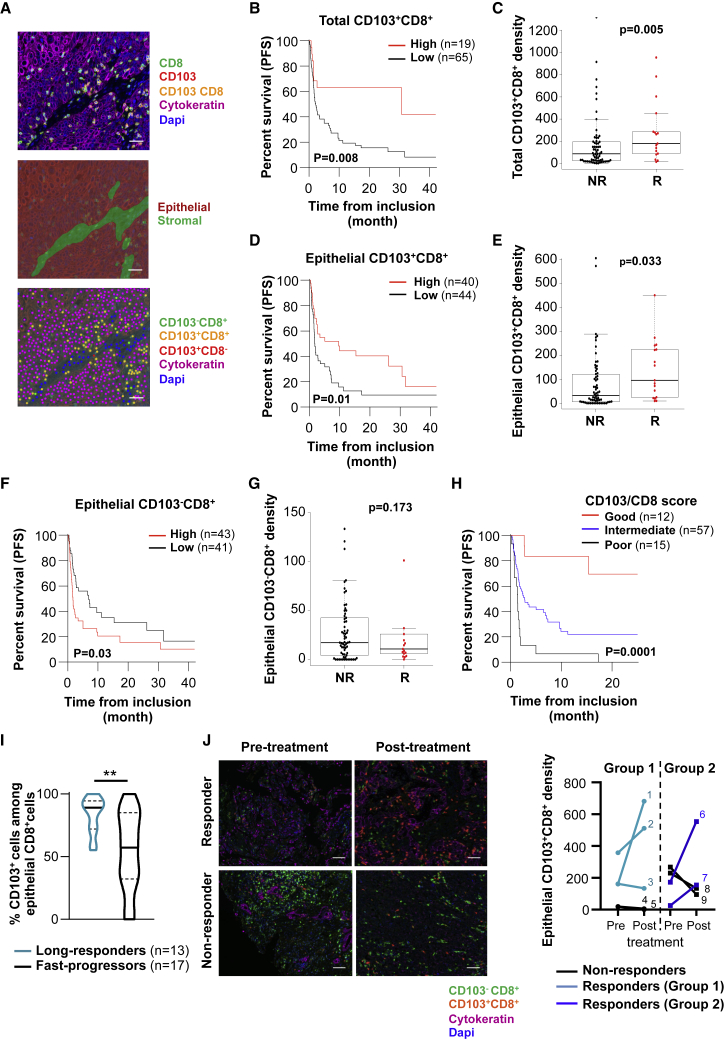
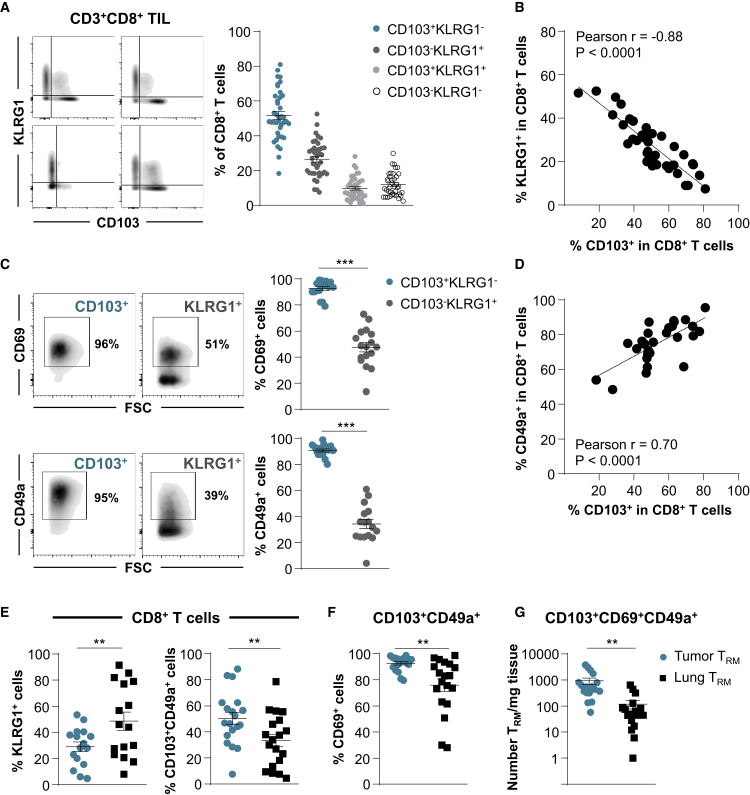
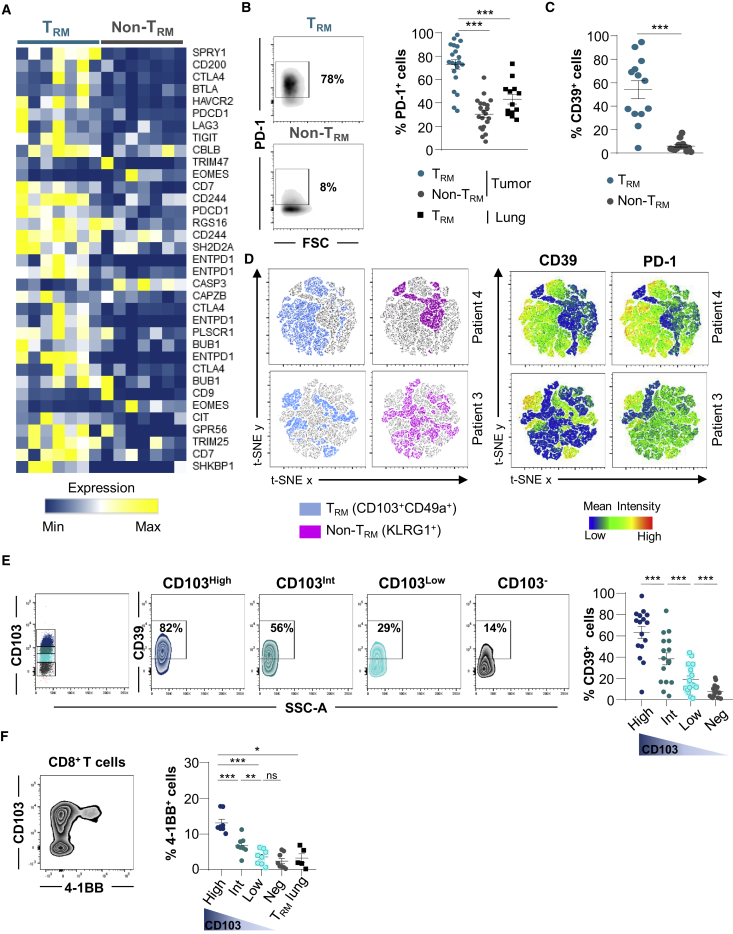
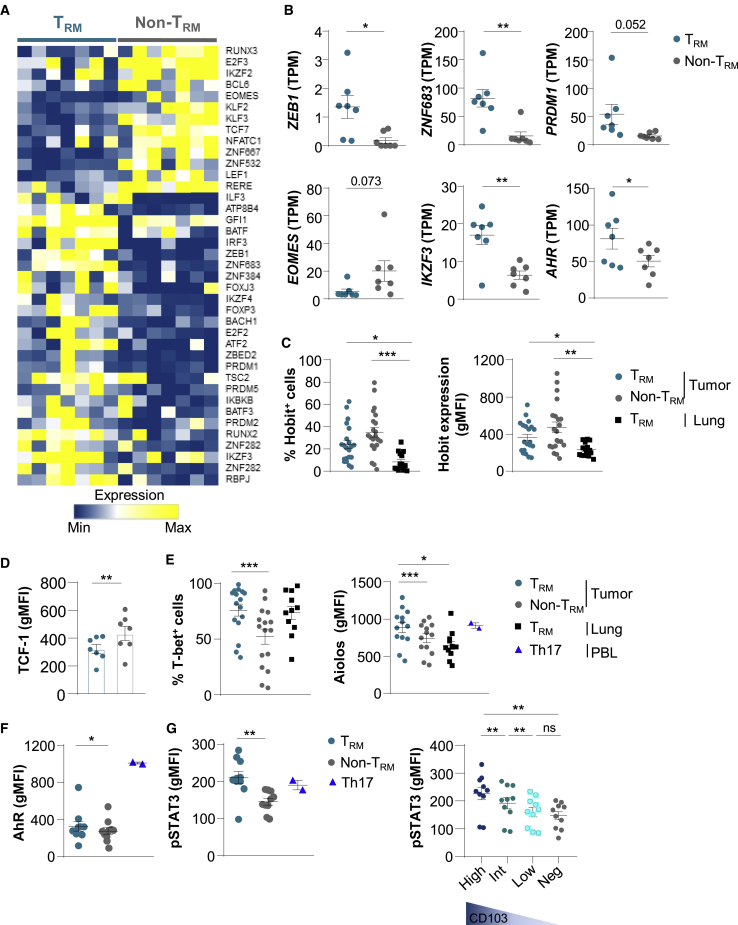
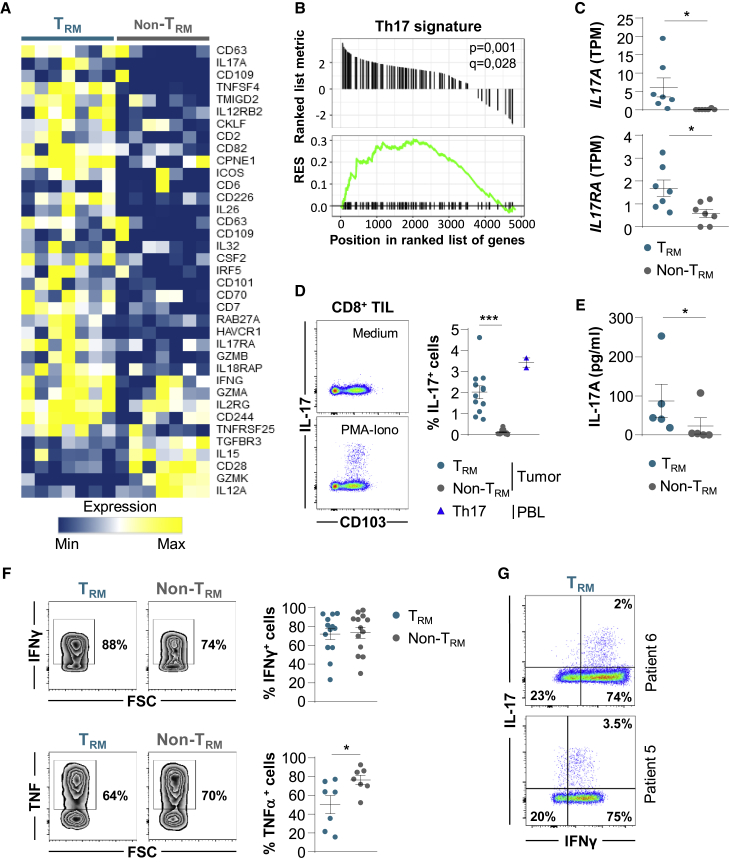
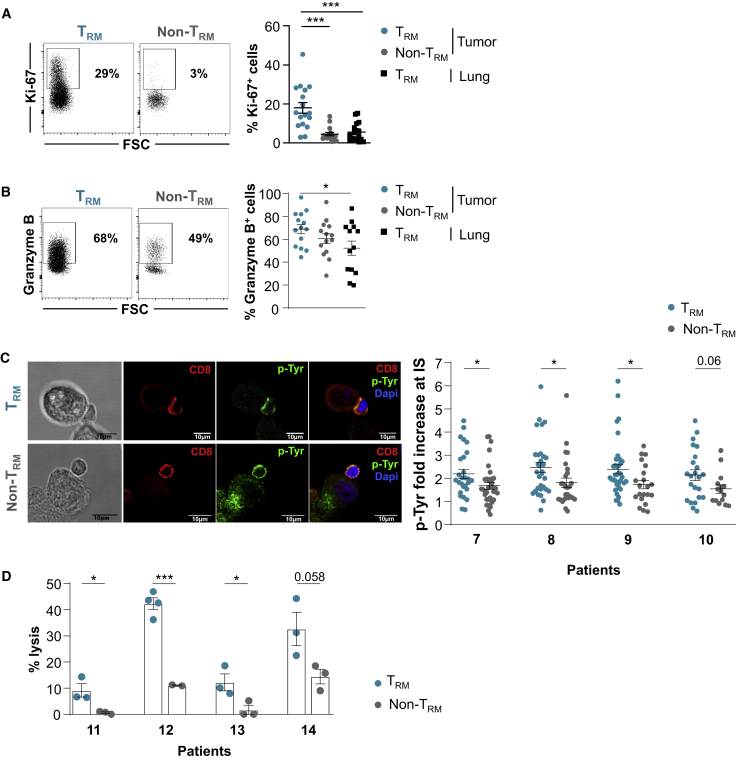
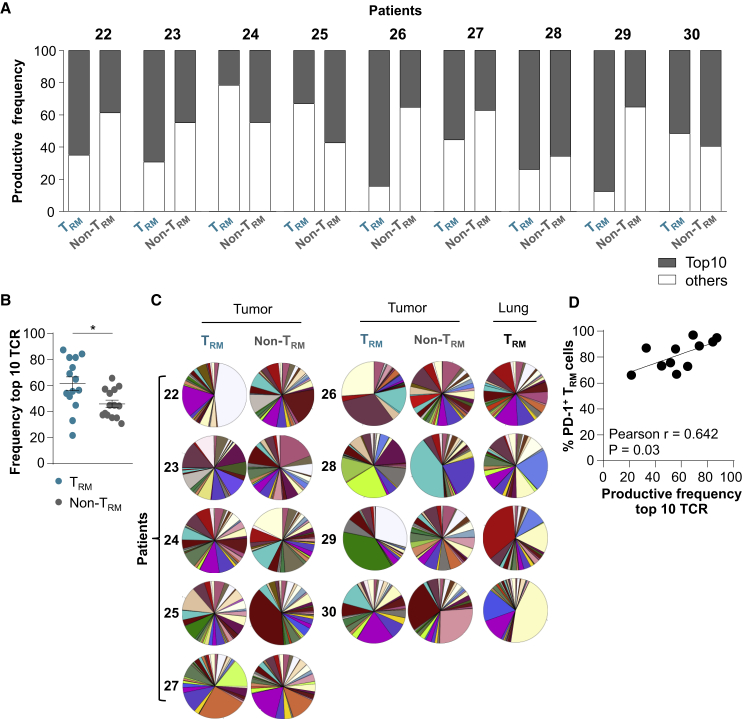
Accumulation of CD103+CD8+ resident memory T (TRM) cells in human lung tumors has been associated with a favorable prognosis. However, the contribution of TRM to anti-tumor immunity and to the response to immune checkpoint blockade has not been clearly established. Using quantitative multiplex immunofluorescence on cohorts of non-small cell lung cancer patients treated with anti-PD-(L)1, we show that an increased density of CD103+CD8+ lymphocytes in immunotherapy-naive tumors is associated with greatly improved outcomes. The density of CD103+CD8+ cells increases during immunotherapy in most responder, but not in non-responder, patients. CD103+CD8+ cells co-express CD49a and CD69 and display a molecular profile characterized by the expression of PD-1 and CD39. CD103+CD8+ tumor TRM, but not CD103-CD8+ tumor-infiltrating counterparts, express Aiolos, phosphorylated STAT-3, and IL-17; demonstrate enhanced proliferation and cytotoxicity toward autologous cancer cells; and frequently display oligoclonal expansion of TCR-β clonotypes. These results explain why CD103+CD8+ TRM are associated with better outcomes in anti-PD-(L)1-treated patients.

Keywords: Aiolos, AhR, and T-bet transcription factors; CD103 integrin; CD8 TRM cells; CTL; ICB response biomarkers; TCR repertoire; Tc17; anti-PD-1 immunotherapy; lung cancer; tumor-infiltrating lymphocytes.


Conflict of interest statement

B.B.’s sponsored research at Gustave Roussy Cancer Center consists of the following: Abbvie, Amgen, AstraZeneca, BeiGene, Blueprint Medicines, BMS, Boehringer Ingelheim, Celgene, Cristal Therapeutics, Daiichi-Sankyo, Eli Lilly, GSK, Ignyta, IPSEN, Inivata, Janssen, Merck KGaA, MSD, Nektar, Onxeo, OSE Immunotherapeutics, Pfizer, Pharma Mar, Roche-Genentech, Sanofi, Servier, Spectrum Pharmaceuticals, Takeda, Tiziana Pharma, and Tolero Pharmaceuticals.

Figures

None
Graphical abstract
Figure 1
Figure 1
Increased CD103+CD8+ TILs Are Associated with Improved Outcomes of Anti-PD-1-Treated NSCLC (A) Fluorescent IHC image of CD8, CD103, cytokeratin, and DAPI staining in lung tumor section (top). Digital markup image shows epithelial and stromal zones of the tumor section defined by cytokeratin staining (center). Digital markup image shows CD103+CD8+ (yellow), CD103CD8+ (green), CD103+CD8 (red), and cytokeratin+ (pink) cells in lung tumors (bottom). Scale bar, 2 cm. (B) Kaplan-Meier curve shows iPFS of anti-PD-1-treated patients with tumors harboring high (>252/mm2) (n = 19) or low (<252/mm2) (n = 65) densities of CD103+CD8+ cells (n = 84). (C) Density of total CD103+CD8+ cells in tumors depending on iORRs of non-responders (NR) (n = 65) and responders (R) (n = 17) patients to PD-1 blockade. (D) Kaplan-Meier curve shows iPFS of anti-PD-1-treated patients with tumor epithelial regions harboring a high (>48/mm2) (n = 40) or low (<48/mm2) (n = 44) density of CD103+CD8+ cells (n = 84). (E) Density of CD103+CD8+ cells in epithelial tumor regions depending on iORRs of NR (n = 65) and R (n = 17) patients to anti-PD-1. (F) Kaplan-Meier curve shows iPFS of PD-1 blockade-treated patients with epithelial regions of tumors harboring a high (>17/mm2) (n = 43) or low (<17/mm2) (n = 41) density of CD103CD8+ cells. (G) Density of CD103CD8+ cells in epithelial tumor regions depending on iORRs of NR (n = 65) and R patients (n = 17) to PD-1 blockade. (H) Kaplan-Meier curve shows iPFS of anti-PD-1-treated patients with tumors harboring a satisfactory (CD103+CD8+high/CD103CD8+low, red, n = 12), intermediate (CD103+CD8+high or CD103CD8+low, blue, n = 57), or poor (CD103+CD8+low/CD103CD8+high, black, n = 15) CD103/CD8 score. (I) Percentages of CD103+ cells among CD8+ TILs in epithelial tumor areas of anti-PD-1-treated patients undergoing a long-response (PFS > 6 months and OS > 12 months; n = 13) or a fast-progression (OS < 12 weeks; n = 17). ∗∗p < 0.01. (J) Fluorescent IHC images show CD103+CD8+ (orange), CD103CD8+ (green), cytokeratin+ (pink), and DAPI+ (blue) cells in tumors from responder and non-responder patients before and after administration of anti-PD-1. Scale bar, 1 cm. Right, density of CD103+CD8+ cells in epithelial tumor regions of tumors before and after the administration of anti-PD-(L)1 in responder (n = 5) or non-responder (n = 4) patients. Each symbol represents an individual patient; horizontal lines correspond to mean ± standard deviation (SD) (C, E, and G). p value was determined by log-rank test (B, D, F, and H), Chi-square test (C, E, and G) or unpaired t test (I). See also Figures S1 and S2, and Tables S1–S6.
Figure 2
Figure 2
Expression of CD103, CD49a, and CD69 on CD8 T Cells Infiltrating Treatment-Naive NSCLC and Healthy Lung Tissues (A) Freshly resected NSCLC tumors were dissociated and the CD8+ T cell subset was analyzed for CD103 and KLRG1 expression. Representative dot plots from 4 different TIL samples are included (bi-exponential scale). Right, percentages of CD103+KLRG1, CD103KLRG1+, CD103+KLRG1+, and CD103KLRG1 TIL subsets among CD3+CD8+ cells (n = 39). (B) Inverse correlation between percentage of CD103+ and KLRG1+ cells among CD8+ TILs (n = 40). The r value indicates Pearson correlation coefficient. (C) Expression of CD69 and CD49a on CD103+ and KLRG1+ CD8+ TILs. Representative dot plot from 1 TIL sample is shown. Right, percentages of CD69+ and CD49a+ cells among CD103+ and KLRG1+ CD8 TILs are presented (n = 17 and n = 16, respectively). (D) Correlation between percentage of CD103+ and CD49a+ cells among CD8+ TIL (n = 27). The r value indicates Pearson correlation coefficient. (E) Percentages of KLRG1+ (n = 16) and CD103+CD49+ cells (n = 19) among CD8+ T cells infiltrating tumors or autologous healthy lung tissues. (F) Percentages of CD69+ cells among CD103+CD49a+ CD8 T cells from tumor or healthy lung tissues (n = 19). (G) Total numbers of CD103+CD69+CD49a+ CD8 (TRM) cells per milligram of tumor tissues and paired normal lung tissues (n = 18). Each symbol represents individual TILs or lung sample; horizontal lines correspond to means ± standard errors of the mean (SEM). ∗∗p < 0.01, ∗∗∗p < 0.001 (paired t test). See also Figure S3 and Table S7.
Figure 3
Figure 3
Expression of T Cell Exhaustion Hallmark in TRM Cells from NSCLC Tumors (A) Heatmap of transcripts involved in T cell exhaustion differentially expressed in CD103+ and KLRG1+ CD8+ TILs (n = 7). Different expression patterns correspond to different isoforms of the same gene. (B) Expression of PD-1 on CD103+ and KLRG1+ CD8+ TILs. Dot plots of 1 representative patient. Right, percentages of PD-1+ cells among TRM and non-TRM (n = 21) and paired TRM from healthy lung (n = 13). (C) Percentages of CD39+ cells in paired TRM and non-TRM from NSCLCs (n = 13). (D) t-SNE map of CD103+CD49a+ (blue) and KLRG1+ (pink) cells among CD8+ TILs. Right, t-SNE analysis of CD39 and PD-1 expression on CD103+CD49a+ (TRM) and KLRG1+ (non-TRM). The data are from 2 representative TIL samples (patients 3 and 4). (E) Dot plots of CD39 expression on CD103+CD8+ TRM, displaying high (CD103high), intermediate (CD103int), and low (CD103low) CD103 phenotypes, and CD103CD8+ TIL from 1 representative tumor. Right, percentages of CD39+ cells among TRM expressing high, intermediate, and low levels of CD103 and CD103CD8+ TIL (n = 16). (F) Dot plot of 4-1BB expression on CD103+CD8+ TILs from 1 representative tumor. Right, percentages of 4-1BB+ cells among TRM displaying high, intermediate, and low CD103 profiles. CD103CD8+ TIL (n = 7) and CD103+CD8+ TRM from autologous normal lungs (n = 4) are included. CD103 intensity is shown by a gradient color code. Symbols represent individual TILs or lung samples; horizontal lines correspond to means ± SEMs. ∗p < 0.05, ∗∗p < 0.01, and ∗∗∗p < 0.001 (paired t test or ANOVA with Bonferroni post hoc test); ns, not significant. See also Figures S3 and S4 and Table S8.
Figure 4
Figure 4
Transcription Factor Profiles of TRM and non-TRM from NSCLCs (A) Heatmap of transcripts encoding transcription factors differentially expressed in CD103+ and KLRG1+ CD8+ TIL (n = 7) (p < 0.05). (B) Expression of ZEB1, ZNF683 (HOBIT), PRDM1 (BLIMP1), IKZF3 (AIOLOS), EOMES, and AHR genes in TRM and non-TRM from NSCLCs (n = 7). Values are transcripts per milion (TPM). (C) Percentages of Hobit+ cells among TRM and non-TRM cells from NSCLCs (n = 21) and among healthy lung TRM cells (n = 15). Right, expression of Hobit (gMFI) in TRM and non-TRM cells from NSCLCs (n = 21) and in healthy lung TRM cells (n = 15). (D) Expression of TCF-1 (gMFI) in tumor TRM and non-TRM cells (n = 7). (E) Percentages of T-bet+ cells among tumor TRM and non-TRM cells (n = 21) and among healthy lung TRM cells (n = 11). Right, expression of Aiolos (gMFI) among tumor TRM and non-TRM and paired healthy lung TRM (n = 13). Heathy donor Th17 control cells are included (n = 2). (F) Expression of AhR (gMFI) in tumor TRM and non-TRM (n = 10), and in Th17+ control cells (n = 2). (G) Expression of pSTAT3 (gMFI) in tumor TRM and non-TRM cells (n = 10), and in Th17+ controls (n = 2). Right, expression of pSTAT3 (gMFI) in tumor TRM cells displaying CD103high (High), CD103int (Int), and CD103low (Low) phenotype, and in CD103CD8+ TILs (Neg) (n = 10). Each symbol represents an individual donor; horizontal lines are means ± SEM. ∗p < 0.05, ∗∗p < 0.01, and ∗∗∗p < 0.001 (paired t test or ANOVA with Bonferroni post hoc test). gMFI, geometric mean fluorescence intensity; ns: not significant. See also Figure S5 and Tables S8 and S9
Figure 5
Figure 5
A Subset of Tumor CD103+CD8+ TRM Cells Displays a Tc17-Polarized Pattern (A) Heatmap of activation gene signature differentially expressed in paired CD103+ and KLRG1+ CD8+ TIL (n = 7) (p < 0.05). (B) GSEA of gene set from the Th17 signature in the transcriptome of CD103+CD8+ TILs relative to KLRG1+CD8+ TILs (n = 7). Running enrichment score (RES) for the gene set as the analysis “walks down” the ranked list of genes; the position of gene set members (black vertical lines) in the ranked list of genes and the value of ranking metric are shown. (C) Expression of IL17A and IL17RA transcripts encoding IL-17 and IL-17R, respectively, in tumor TRM and non-TRM cells (n = 7). TPMs are shown. (D) Intracellular expression of IL-17 in CD8+ TILs stimulated for 4 h with PMA plus ionomycin. One representative dot plot is shown. Right, percentages of IL-17+ cells among TRM and non-TRM cells from tumors (n = 12). Healthy donor Th17+ control cells are included (n = 2). (E) Production of IL-17 measured by ELISA in supernatant of tumor TRM and non-TRM cells stimulated overnight with PMA plus ionomycin. The data are concentrations of IL-17 in picograms per milliliter per 100,000 cells (n = 5). (F) Intracellular expression of IFN-γ and TNF-α in CD8+ TILs stimulated with PMA plus ionomycin. The dot plots from 1 representative patient are shown. Right, percentages of IFN-γ+ (n = 13) and TNF-α+ (n = 7) cells among TRM and non-TRM cells from tumors. (G) Intracellular co-expression of IL-17 and IFN-γ in tumor TRM cells stimulated with PMA plus ionomycin. Two representative patients are shown. Symbols represent individual TILs or lung samples; horizontal lines are means ± SEMs (C, D, E, and F). ∗p < 0.05 and ∗∗∗ p < 0.001 (paired t test or ANOVA with Bonferroni post hoc test). See also Figure S5 and Table S8.
Figure 6
Figure 6
TRM Cells Are Tumor-Specific CD8+ T Cells (A) Intracellular expression of Ki67 in TRM and non-TRM cells from NSCLCs. The dot plot of 1 representative patient is shown. Right, percentages of Ki67+ cells in paired TRM and non-TRM cells from tumors and paired TRM cells from healthy lung (n = 18). (B) Intracellular expression of granzyme B in tumor TRM and non-TRM cells. The dot plot of 1 representative patient is shown. Right, percentages of granzyme B+ cells in TRM and non-TRM cells from tumors and paired TRM cells from healthy lung (n = 14). (C) Conjugates formed between freshly isolated CD8+ tumor TRM or non-TRM cells and autologous tumor cells were analyzed by confocal microscopy for p-Tyr (green fluorescence) accumulation in the contact area. T cells were labeled with anti-CD8 mAb (red). Scale bars, 10 μm. Right, quantification of pTyr fluorescence intensity fold increase in CD8 T cells at contact zone with cognate target cells. Four representative patients are included. Each symbol represents an individual synapse from 15 to 37 analyzed conjugates. (D) Cytotoxic activity of freshly isolated tumor TRM and non-TRM cells toward autologous cancer cells determined by a conventional 4 h chromium release assay at a 20:1 E:T ratio. The data correspond to 4 independent experiments with 4 different tumor samples. Horizontal lines are means ± SEMs from triplicate. Symbols represent individual TILs or lung samples; horizontal lines are means ± SEMs (A and B). ∗p < 0.05 and ∗∗∗p < 0.001 (paired t test or ANOVA with Bonferroni post hoc test).
Figure 7
Figure 7
Tumor CD8+ TRM Cells Display an Oligoclonal TCR Repertoire (A) Frequency of productive TCR sequences of the top 10 clonotypes (gray) and all other clonotypes (white) in paired NSCLC TRM and non-TRM cells from each patient sample (patients 22–30). TCR-β CDR3 region in tumor TRM and non-TRM cells were analyzed by TCR-seq (n = 9). (B) Frequency of the top 10 TCR sequences in tumor TRM and non-TRM cells from both TCR-seq and RNA-seq (n = 14). (C) Pie charts illustrating distribution of TCRV-β families in TRM and non-TRM cells from tumors (n = 9) and autologous TRM cells from healthy lungs (n = 4). (D) Correlation between productive frequency of the top 10 TCR clonotypes and the percentage of PD-1+ cells in tumor TRMs (n = 11). Horizontal lines correspond to means ± SEMs. ∗p < 0.05 paired t test; ns, not significant. The r value indicates the Pearson correlation coefficient. See also Figure S6.

References

    1. Tumeh P.C., Harview C.L., Yearley J.H., Shintaku I.P., Taylor E.J., Robert L., Chmielowski B., Spasic M., Henry G., Ciobanu V. PD-1 blockade induces responses by inhibiting adaptive immune resistance. Nature. 2014;515:568–571. - PMC - PubMed
    1. McGranahan N., Furness A.J., Rosenthal R., Ramskov S., Lyngaa R., Saini S.K., Jamal-Hanjani M., Wilson G.A., Birkbak N.J., Hiley C.T. Clonal neoantigens elicit T cell immunoreactivity and sensitivity to immune checkpoint blockade. Science. 2016;351:1463–1469. - PMC - PubMed
    1. Webb J.R., Milne K., Watson P., Deleeuw R.J., Nelson B.H. Tumor-infiltrating lymphocytes expressing the tissue resident memory marker CD103 are associated with increased survival in high-grade serous ovarian cancer. Clin. Cancer Res. 2014;20:434–444. - PubMed
    1. Djenidi F., Adam J., Goubar A., Durgeau A., Meurice G., de Montpréville V., Validire P., Besse B., Mami-Chouaib F. CD8+CD103+ tumor-infiltrating lymphocytes are tumor-specific tissue-resident memory T cells and a prognostic factor for survival in lung cancer patients. J. Immunol. 2015;194:3475–3486. - PubMed
    1. Ganesan A.P., Clarke J., Wood O., Garrido-Martin E.M., Chee S.J., Mellows T., Samaniego-Castruita D., Singh D., Seumois G., Alzetani A. Tissue-resident memory features are linked to the magnitude of cytotoxic T cell responses in human lung cancer. Nat. Immunol. 2017;18:940–950. - PMC - PubMed

Publication types

MeSH terms