. 2020 May 4;1(3):100035.
doi: 10.1016/j.patter.2020.100035. eCollection 2020 Jun 12.

A Random Matrix Theory Approach to Denoise Single-Cell Data

Affiliations

A Random Matrix Theory Approach to Denoise Single-Cell Data

Luis Aparicio et al. Patterns (N Y). .

Abstract

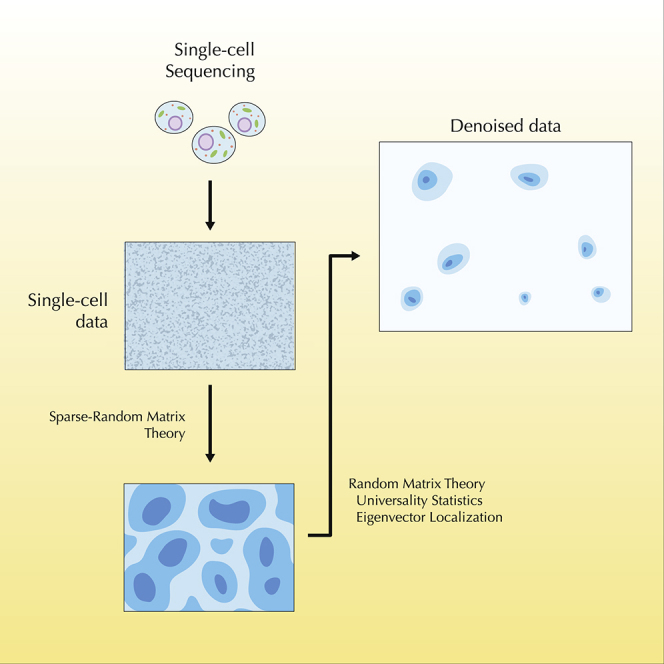
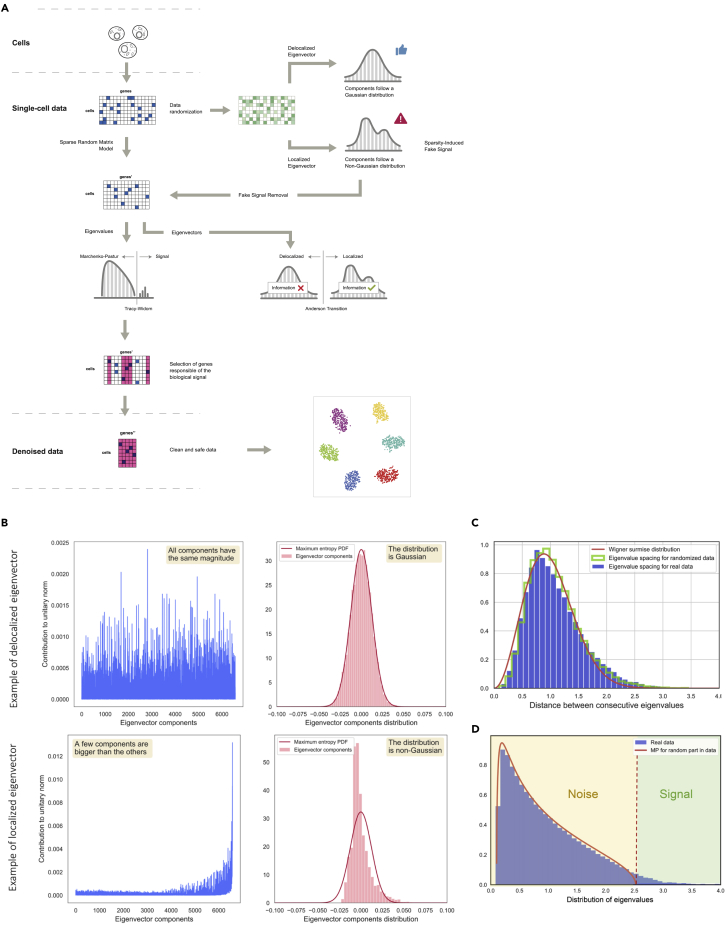
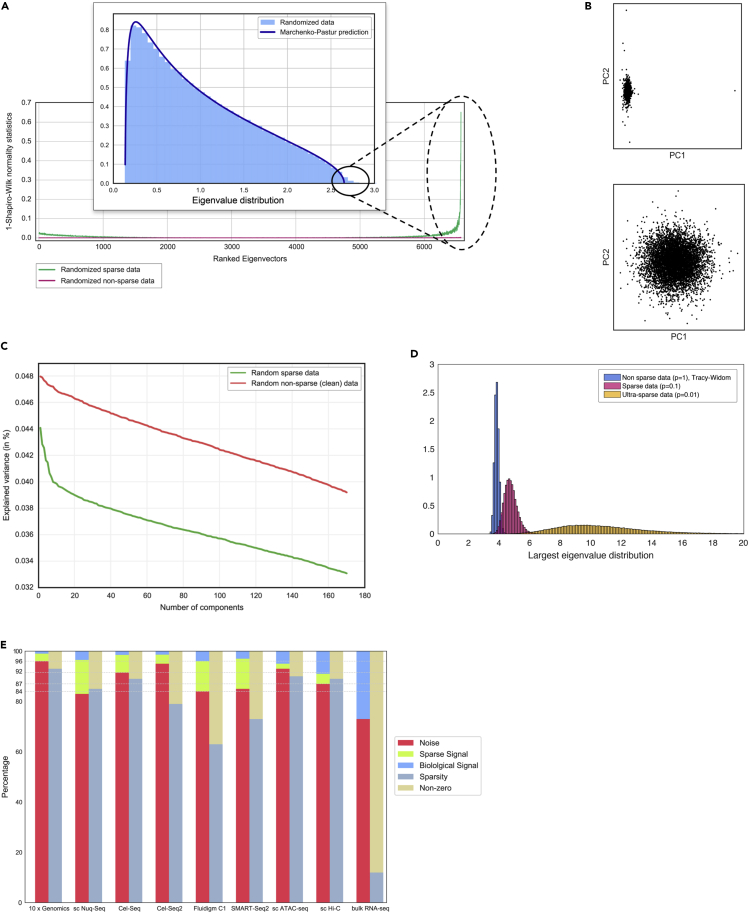
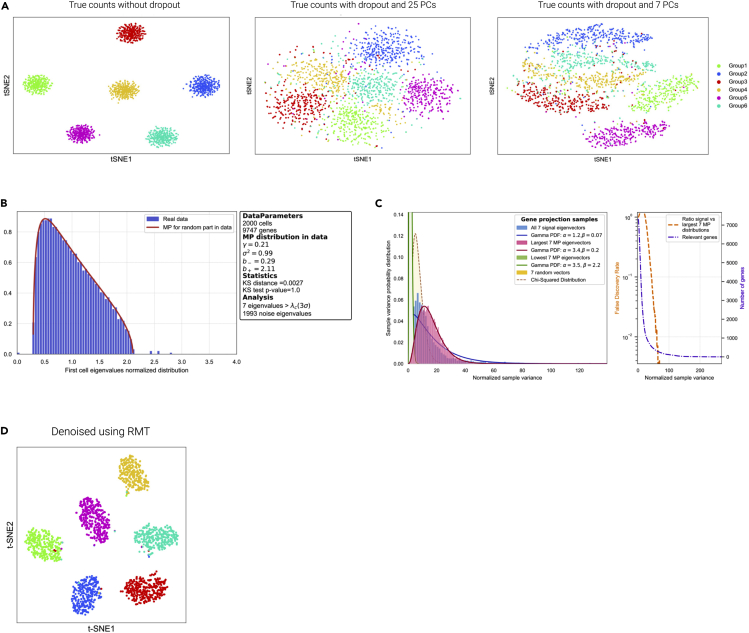
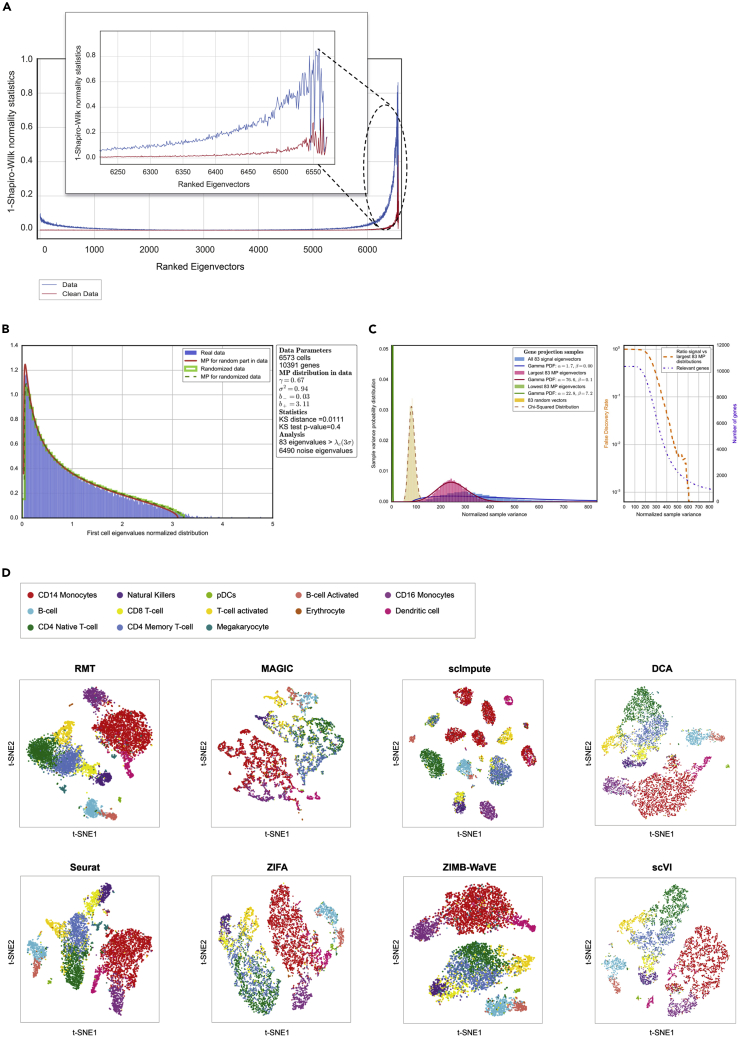
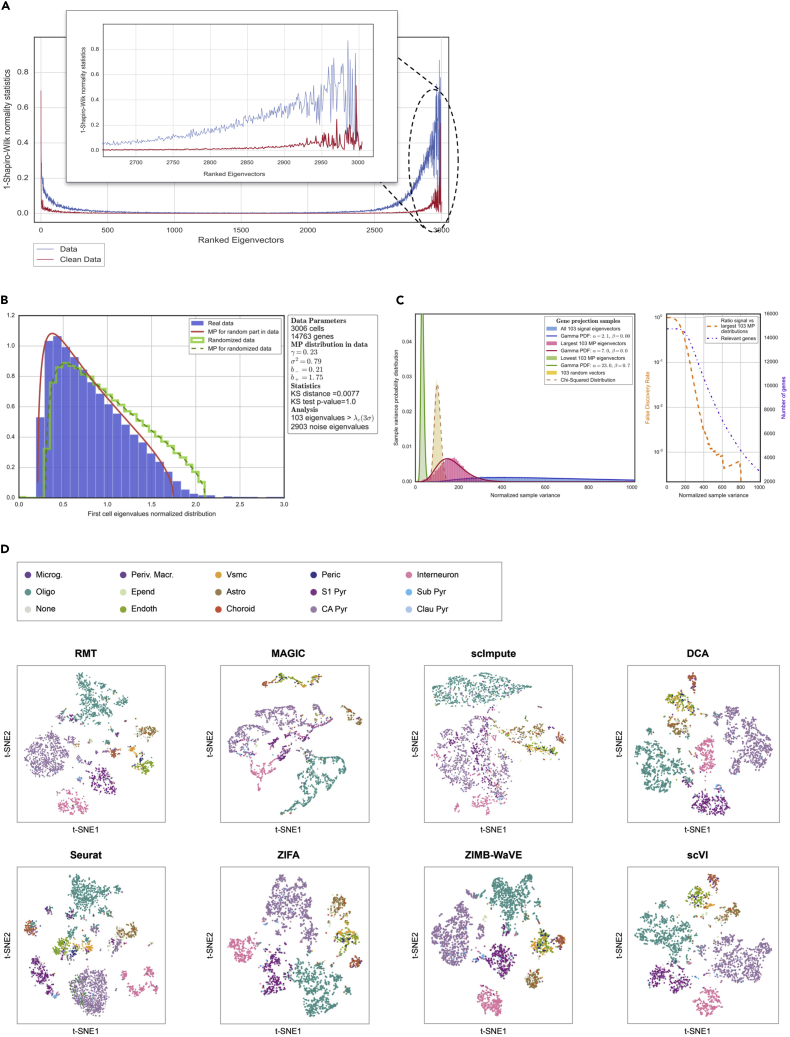
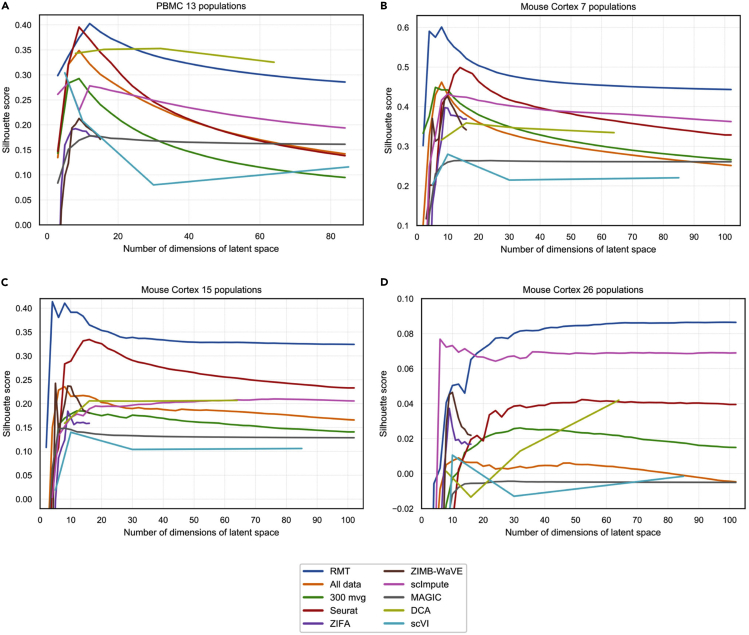
Single-cell technologies provide the opportunity to identify new cellular states. However, a major obstacle to the identification of biological signals is noise in single-cell data. In addition, single-cell data are very sparse. We propose a new method based on random matrix theory to analyze and denoise single-cell sequencing data. The method uses the universal distributions predicted by random matrix theory for the eigenvalues and eigenvectors of random covariance/Wishart matrices to distinguish noise from signal. In addition, we explain how sparsity can cause spurious eigenvector localization, falsely identifying meaningful directions in the data. We show that roughly 95% of the information in single-cell data is compatible with the predictions of random matrix theory, about 3% is spurious signal induced by sparsity, and only the last 2% reflects true biological signal. We demonstrate the effectiveness of our approach by comparing with alternative techniques in a variety of examples with marked cell populations.

Keywords: denoising; eigenvector localization; random matrix theory; single cell; sparsity; universality.


Conflict of interest statement

The authors declare no competing financial interests.

Figures

None
Graphical abstract
Figure 1
Figure 1
Random Matrix Theory Applications to Single-Cell Sequencing Data (A) Schematic of the analysis based on random matrix theory (RMT). Single-cell data can be modeled using sparse random matrix theory (sRMT), showing a 3-fold structure: a random matrix, a sparsity-induced signal, and a biological signal. The strategy proposed here is to identify the biological signal using the predictions from sRMT applied to the covariance matrix of the data. (B) Deviations from the Tracy-Widom (TW) distribution have been associated to the phenomenon of eigenvector localization. Delocalized eigenvectors are randomly distributed in an N sphere, whereas localized eigenvectors are localized along some directions in the N sphere. Localization can be identified as deviations in components of the eigenvectors from the expected distribution, which is approximately Gaussian in high dimensions. If we think of the components of the eigenvector as a random variable, its probability density function (PDF) (the Gaussian) corresponds to a maximum entropy PDF. (C) The Wigner surmise distribution captures the spacing between eigenvalues of Wishart matrix across single-cell RNA-sequencing experiments. (D) Departures from universal distributions predicted by RMT indicate interesting potential biological signals. In red is the non-parametric Marchenko-Pastur (MP) distribution. Deviations from universality can be found by analyzing the larger eigenvalues in relation to the expected TW distribution.
Figure 2
Figure 2
Sparse Random Matrices and Sparsity-Induced Eigenvector Localization (A) Randomized sparse dataset, corresponding to PBMCs in Kang et al., where there exist deviations from MP distribution at the eigenvalue level, and presence of localized eigenvectors. (B) The localization phenomenon due to sparsity can bias the lower-dimensional representations (up). Eliminating the genes that cause eigenvector localization in the randomized dataset generates a more homogeneous distribution in the lower-dimensional representation (down), reflecting the random nature of the data. (C) The effects of sparsity can also be appreciated in the classical elbow plots: sparsity can introduce an artifactual elbow in randomized data. (D) Deviations from TW distributions can be easily seen in sparse matrices. In this case, 100-by-100 random matrices are drawn a mixture of a normal and a Dirac-delta at zero. Similar results are obtained with other sparse distributions. (E) Departures from universality amount to near 5% of eigenvalues. However, most of these can be explained by the sparsity of data, suggesting that Sparse Random Matric Theory can provide a better model to understand single-cell sequencing data. Truly potential biological signal amounts to only ~2% of eigenvalues.
Figure 3
Figure 3
Application to Simulations of Single-Cell and Comparison with Standard PCA (A) t-SNE representation of a six-cell population single-cell simulation using Splatter for the cases with and without noise associated with dropout effects, and for different selection of principal components after applying a standard PCA technique. The colors correspond to the label of each group of cells simulated, and no clustering has been performed. (B) MP prediction and identification of the relevant components. (C) Selection of features (genes) responsible for signal. (D) t-SNE representation after results after processing through the RMT.
Figure 4
Figure 4
Application to PBMC Single-Cell Expression (A) Localization properties of the eigenvectors in a single-cell dataset of PBMCs. The blue line represents the system dominated by sparsity and the red line corresponds to the system after removing sparsity. This figure also shows how some eigenvectors corresponding to eigenvalues out of MP distribution are delocalized (red line) and therefore do not carry any information. (B) MP prediction and identification of relevant components. (C) Study of the chi-squared test for the variance (normalized sample variance) in signal and noise gene projections. In the left panel, the distributions correspond to a projection of genes into the 83 signal eigenvectors (corresponding to the 83 eigenvalues of A) and the projection into the 83 lowest and 83 largest MP eigenvectors. There is also a projection into 83 random vectors. Finally, the lines show how gamma functions can fit the distributions discussed. The right panel shows the number of relevant genes in terms of the test discussed above, together with a false discovery rate. Higher values for the chi-squared test for variance indicate that the genes are less responsible for the signal. (D) Comparison of the t-SNE representation for different public algorithms. This case corresponds to 13 different PBMC phenotypes sequenced in Kang et al. and described in Butler et al.
Figure 5
Figure 5
Application to Mouse Cortex Single-Cell Expression (A) Localization properties of the eigenvectors in a single-cell dataset of PBMCs. The blue line represents the system dominated by sparsity and the red line corresponds to the system after removing sparsity. This figure also shows how some eigenvectors corresponding to eigenvalues out of MP distribution are delocalized (red line) and therefore do not carry any information. (B) MP prediction and identification of relevant components. (C) Study of the chi-squared test for the variance (normalized sample variance) in signal and noise gene projections. In the left panel, the distributions correspond to a projection of genes into the 103 signal eigenvectors (corresponding to the 103 eigenvalues of A) and the projection into the 103 lowest and 103 largest MP eigenvectors. There is also a projection into 103 random vectors. Finally, the lines show how gamma functions can fit the distributions discussed. The right panel shows the number of relevant genes in terms of the test discussed above together with a false discovery rate. Higher values for the chi-squared test for variance indicate that the genes are less responsible for the signal. (D) Comparison of the t-SNE representation for different methods and algorithms. This case corresponds to 15 different mouse cortex cell phenotypes described in Zeisel et al.
Figure 6
Figure 6
Comparison of Alternative Approaches for Single-Cell Analysis (A) Mean silhouette score for different methods as a function of the number of dimensions of the latent space for the case of 13 PBMC cell phenotypes described in Butler et al. (B–D) Mean silhouette score for different methods as a function of the reduced space number of dimensions for the case of 7 (B), 15 (C), and 26 (D) mouse cortex cell phenotypes described in Zeisel et al.

References

    1. Patel A.P., Tirosh I., Trombetta J.J., Shalek A.K., Gillespie S.M., Wakimoto H., Cahill D.P., Nahed B.V., Curry W.T., Martuza R.L. Single-cell RNA-seq highlights intratumoral heterogeneity in primary glioblastoma. Science. 2014;344:1396–1401. - PMC - PubMed
    1. Bintu L., Yong J., Antebi Y.E., McCue K., Kazuki Y., Uno N., Oshimura M., Elowitz M.B. Dynamics of epigenetic regulation at the single-cell level. Science. 2016;351:720–724. - PMC - PubMed
    1. Cao J., Packer J.S., Ramani V., Cusanovich D.A., Huynh C., Daza R., Qiu X., Lee C., Furlan S.N., Steemers F.J. Comprehensive single-cell transcriptional profiling of a multicellular organism. Science. 2017;357:661–667. - PMC - PubMed
    1. Rizvi A.H., Camara P.G., Kandror E.K., Roberts T.J., Schieren I., Maniatis T., Rabadan R. Single-cell topological RNA-seq analysis reveals insights into cellular differentiation and development. Nat. Biotechnol. 2017;35:551–560. - PMC - PubMed
    1. Azizi E., Carr A.J., Plitas G., Cornish A.E., Konopacki C., Prabhakaran S., Nainys J., Wu K., Kiseliovas V., Setty M. Single-cell map of diverse immune phenotypes in the breast tumor microenvironment. Cell. 2018;174:1293–1308.e36. - PMC - PubMed

LinkOut - more resources