. 2020 Jul 31;1(6):100081.
doi: 10.1016/j.patter.2020.100081. eCollection 2020 Sep 11.

Spectral Jaccard Similarity: A New Approach to Estimating Pairwise Sequence Alignments

Affiliations

Spectral Jaccard Similarity: A New Approach to Estimating Pairwise Sequence Alignments

Tavor Z Baharav et al. Patterns (N Y). .

Abstract

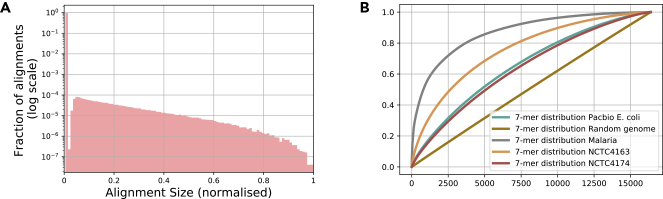
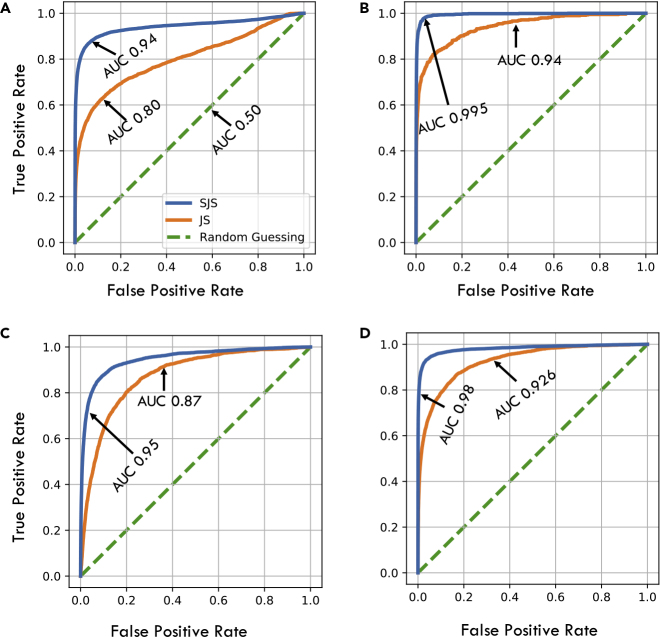
Pairwise sequence alignment is often a computational bottleneck in genomic analysis pipelines, particularly in the context of third-generation sequencing technologies. To speed up this process, the pairwise k-mer Jaccard similarity is sometimes used as a proxy for alignment size in order to filter pairs of reads, and min-hashes are employed to efficiently estimate these similarities. However, when the k-mer distribution of a dataset is significantly non-uniform (e.g., due to GC biases and repeats), Jaccard similarity is no longer a good proxy for alignment size. In this work, we introduce a min-hash-based approach for estimating alignment sizes called Spectral Jaccard Similarity, which naturally accounts for uneven k-mer distributions. The Spectral Jaccard Similarity is computed by performing a singular value decomposition on a min-hash collision matrix. We empirically show that this new metric provides significantly better estimates for alignment sizes, and we provide a computationally efficient estimator for these spectral similarity scores.

Keywords: DNA sequencing; Jaccard similarity; genome assembly; locality-sensitive hashing; min-hash; sequence alignment; singular value decomposition; spectral methods.


Conflict of interest statement

The authors declare no competing interests.

Figures

Figure 1
Figure 1
Overview of the Spectral Jaccard Similarity Computation
Figure 2
Figure 2
SJS Has Uniformly Higher Area under the ROC Curve for Experiments on 40 PacBio Bacterial Datasets from the NCTC Library In these experiments, SJS and Jaccard similarity were used to filter pairs of reads with an overlap of at least 30%. SJS was used with 1,000 hash functions while Jaccard similarity was computed exactly. By varying a second threshold determining which values of Jaccard similarity (or SJS) are selected, we can obtain ROC curves describing the performance of each filter, from which the AUC can be computed. (A) AUC values using Daligner alignments as ground truth. (B) The same results using Minimap2 alignments as ground truth.
Figure 3
Figure 3
The k-mer Jaccard Similarity Can Be Seen as a Proxy for the Alignment Size
Figure 4
Figure 4
Alignment Size Distribution for PacBio Datasets and k-mer Distribution for Several Bacterial Genomes (A) A histogram of the alignment size (measured in terms of fraction of shared sequence) detected by Daligner in reads of E. coli K-12 dataset of Pacific Biosciences. We note that more than 99.9% of pairs of reads have no alignment between them. We also note that practical aligners are not able to capture small overlaps, which are difficult to distinguish from spurious alignments generated by noise, creating the “notch” in the histogram. (B) Cumulative distribution function (CDF) of the k-mer distributions for various genomes. For each genome, we sort the k-mers in decreasing order of frequency to help with visualization. We see that the distributions deviate significantly from a uniform distribution (dark-yellow line). In particular, we remark that the CDFs for NCTC 4163 and NCTC 4174 have the largest and smallest deviation from the uniform distribution among the NCTC datasets analyzed in this paper.
Figure 5
Figure 5
Example of Comparison between Jaccard Similarity and SJS on a Small Matrix While the standard Jaccard similarity approach would assign the same value to rows 1 and 3, SJS takes into account the fact that columns 2 and 5 are seen as less reliable indicators of alignment.
Figure 6
Figure 6
Comparison between Alignment Estimates and True Alignments Linear regression fit to positive alignments found by Daligner to (A) Jaccard similarity between corresponding reads and (B) SJS between the reads, which provides a better fit.
Figure 7
Figure 7
Comparison of ROC Curves on Various Datasets ROC curves across different PacBio datasets and different θ thresholds using Daligner ground truth and 1,000 hashes. (A) ROC of E. coli (K-12 from PacBio website) for alignment threshold θ=0.3. (B) ROC of E. coli for alignment threshold θ=0.8. (C) ROC of NCTC 4174—the least repetitive dataset we consider —with alignment threshold θ=0.3. (D) ROC of NCTC 4163—the most repetitive dataset we consider—with alignment threshold θ=0.3. Figure S8 shows a similar plot with Minimap2 as ground truth. AUCs across a variety of datasets are shown in Figure 8.
Figure 8
Figure 8
Impact of the Dataset Collision Probability on the SJS Performance (A) The higher the min-hash collision probability is, the worse both methods perform, indicating a “harder” dataset. However, the performance of the SJS filter degrades less than that of the Jaccard similarity filter. (B) Ratio between the improvement of the SJS filter over random guessing and the improvement of the Jaccard similarity filter over random guessing, as a function of collision probability of the reads' k-mer distribution. The results in both plots were computed for θ=0.3 using 1,000 hashes. A similar plot with Minimap2 providing ground truth alignments can be found in Figure S5.
Figure 9
Figure 9
Approximating Right Singular Vector with Column Averages When most pi0, it is possible to approximate the SVD by a simple matrix-vector multiplication as described in Equation 11. In particular, we verify empirically that (A) q¯q and that (B) the p obtained from Equation 11 is nearly the same as the one computed by SVD. If one instead tries to approximate p by considering row averages (C), the approximation is not as good.
Figure 10
Figure 10
Comparison between Collision Probability and Hash Unreliability Parameter For each hash function hj, we compared the collision probability on hash hj with the corresponding qj for (A) the E. coli dataset and (B) the K. pneumoniae dataset (NCTC 5047).

References

    1. Weirather Jason L., de Cesare Mariateresa, Wang Yunhao, Piazza Paolo, Sebastiano Vittorio, Wang Xiu-Jie, Buck David, Au Kin Fai. Comprehensive comparison of pacific biosciences and oxford nanopore technologies and their applications to transcriptome analysis. F1000Res. 2017;6 doi: 10.12688/f1000research.10571.2. - DOI - PMC - PubMed
    1. Needleman Saul B., Wunsch Christian D. A general method applicable to the search for similarities in the amino acid sequence of two proteins. J. Mol. Biol. 1970;48:443–453. - PubMed
    1. Smith Temple F., Waterman Michael S. Identification of common molecular subsequences. J. Mol. Biol. 1981;147:195–197. - PubMed
    1. Myers Eugene W. An O(nd) difference algorithm and its variations. Algorithmica. 1986;1:251–266.
    1. Vaser Robert, Sović Ivan, Nagarajan Niranjan, Šikić Mile. Fast and accurate de novo genome assembly from long uncorrected reads. Genome Res. 2017;27:737–746. - PMC - PubMed

LinkOut - more resources