

GigaSOM.jl: High-performance clustering and visualization of huge cytometry datasets
- PMID: 33205814
- PMCID: PMC7672468
- DOI: 10.1093/gigascience/giaa127
GigaSOM.jl: High-performance clustering and visualization of huge cytometry datasets
Abstract
Background: The amount of data generated in large clinical and phenotyping studies that use single-cell cytometry is constantly growing. Recent technological advances allow the easy generation of data with hundreds of millions of single-cell data points with >40 parameters, originating from thousands of individual samples. The analysis of that amount of high-dimensional data becomes demanding in both hardware and software of high-performance computational resources. Current software tools often do not scale to the datasets of such size; users are thus forced to downsample the data to bearable sizes, in turn losing accuracy and ability to detect many underlying complex phenomena.
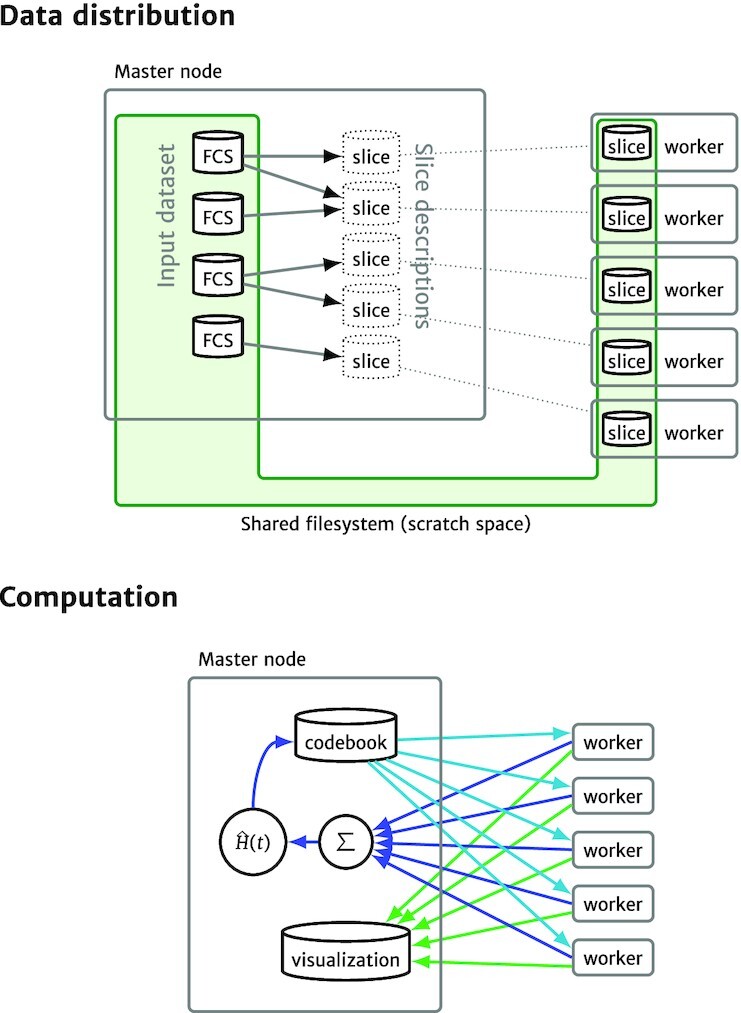
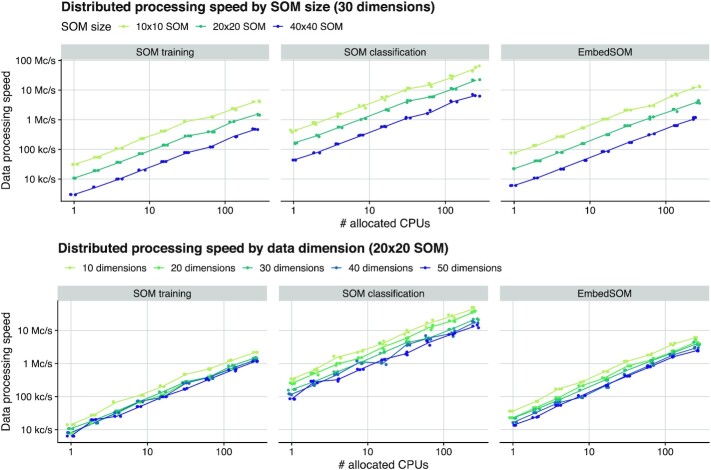
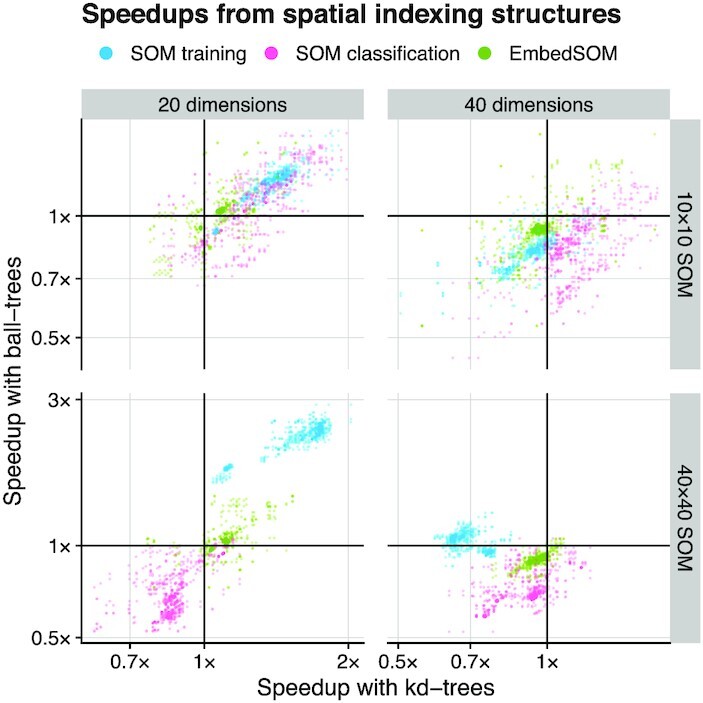
Results: We present GigaSOM.jl, a fast and scalable implementation of clustering and dimensionality reduction for flow and mass cytometry data. The implementation of GigaSOM.jl in the high-level and high-performance programming language Julia makes it accessible to the scientific community and allows for efficient handling and processing of datasets with billions of data points using distributed computing infrastructures. We describe the design of GigaSOM.jl, measure its performance and horizontal scaling capability, and showcase the functionality on a large dataset from a recent study.
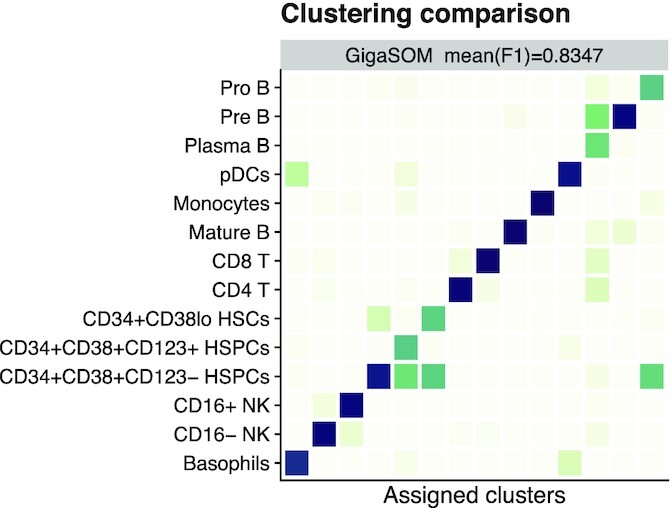
Conclusions: GigaSOM.jl facilitates the use of commonly available high-performance computing resources to process the largest available datasets within minutes, while producing results of the same quality as the current state-of-art software. Measurements indicate that the performance scales to much larger datasets. The example use on the data from a massive mouse phenotyping effort confirms the applicability of GigaSOM.jl to huge-scale studies.
Keywords: Julia; clustering; dimensionality reduction; high-performance computing; self-organizing maps; single-cell cytometry.
© The Author(s) 2020. Published by Oxford University Press GigaScience.
Conflict of interest statement
The authors declare that they have no competing interests.
Figures
References
-
- Bandura DR, Baranov VI, Ornatsky OI, et al. Mass cytometry: technique for real time single cell multitarget immunoassay based on inductively coupled plasma time-of-flight mass spectrometry. Anal Chem. 2009;81(16):6813–22. - PubMed
-
- Mair F, Hartmann FJ, Mrdjen D, et al. The end of gating? An introduction to automated analysis of high dimensional cytometry data. Eur J Immunol. 2016;46(1):34–43. - PubMed
Publication types
MeSH terms
LinkOut - more resources
Full Text Sources
Other Literature Sources
Molecular Biology Databases
