. 2021 Mar;78(6):2987-3003.
doi: 10.1007/s00018-020-03699-1. Epub 2020 Nov 18.

miR-146a regulates insulin sensitivity via NPR3

Affiliations

miR-146a regulates insulin sensitivity via NPR3

Julian Roos et al. Cell Mol Life Sci. 2021 Mar.

Abstract

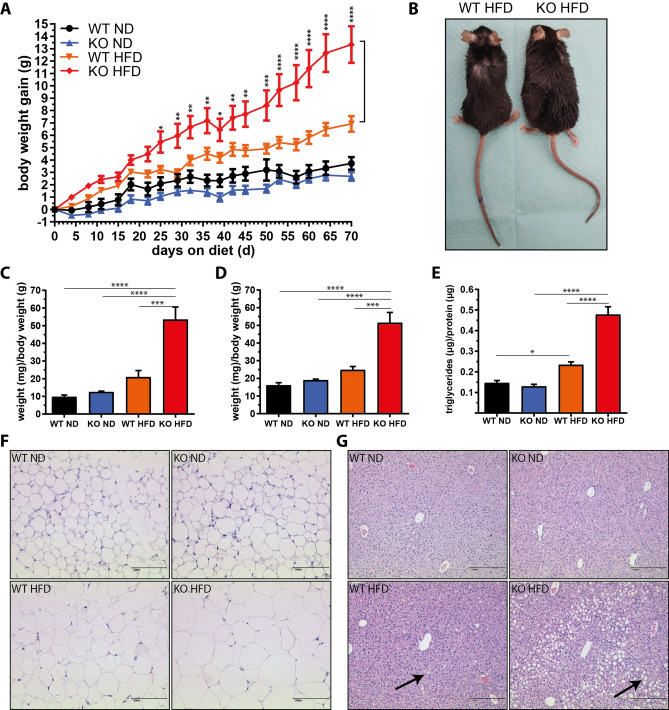
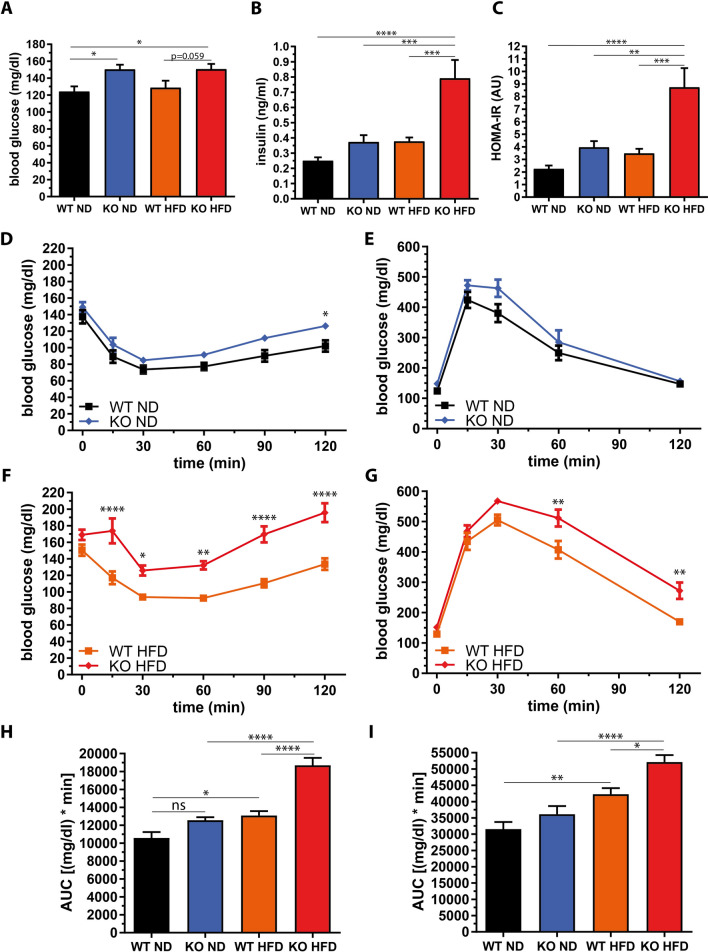
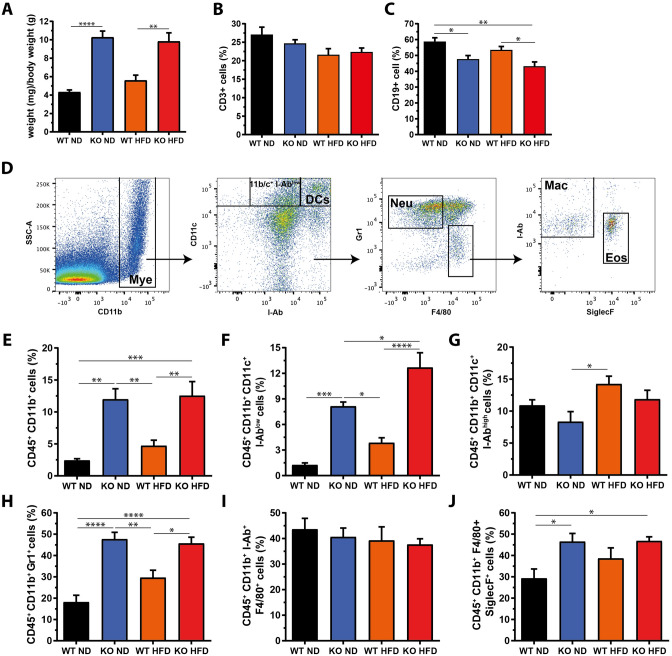
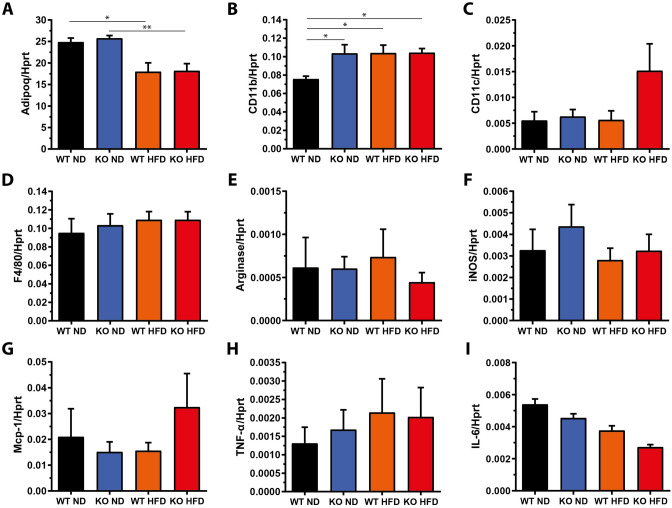
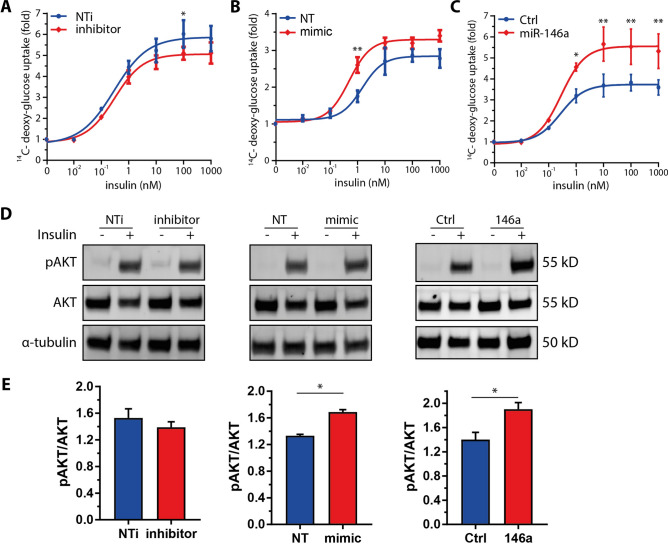
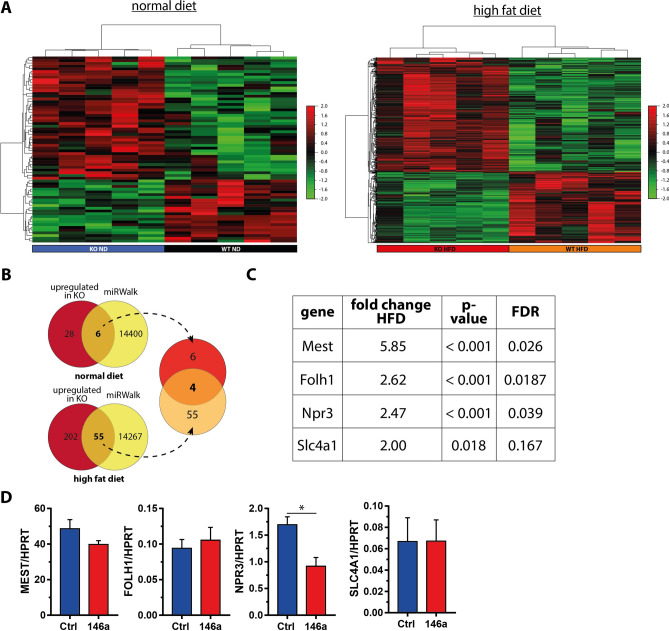
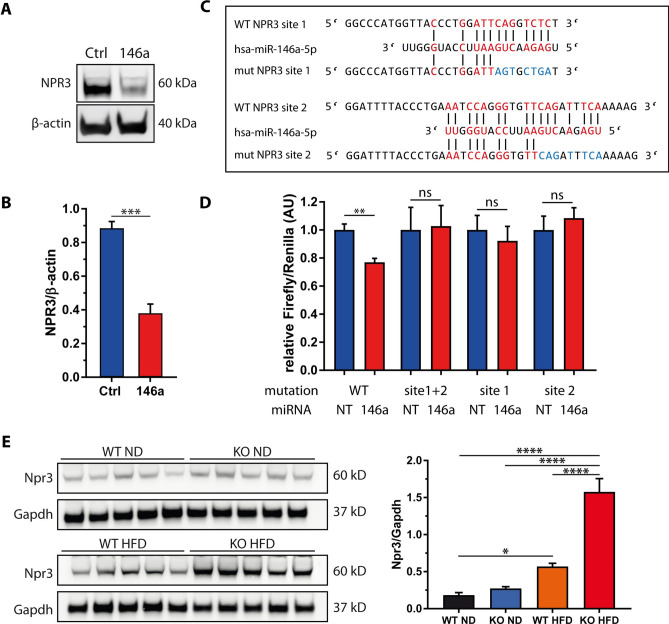
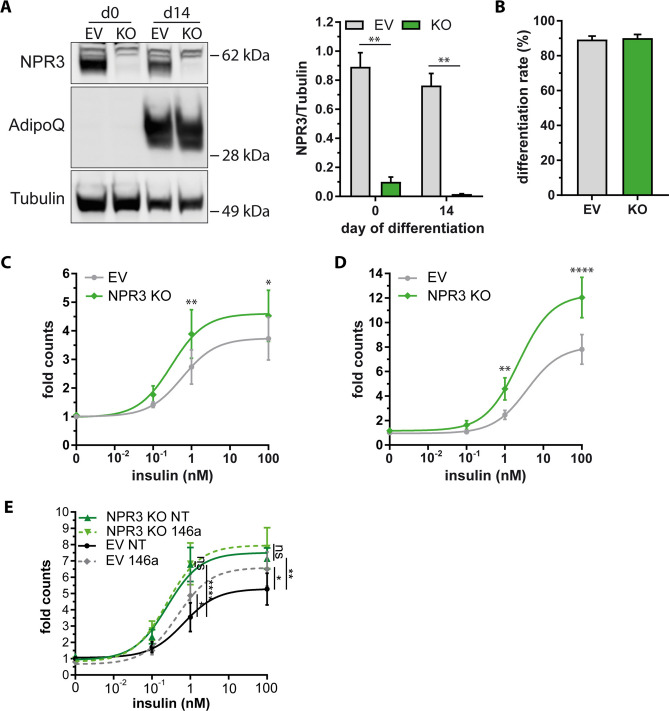
The pathogenesis of obesity-related metabolic diseases has been linked to the inflammation of white adipose tissue (WAT), but the molecular interconnections are still not fully understood. MiR-146a controls inflammatory processes by suppressing pro-inflammatory signaling pathways. The aim of this study was to characterize the role of miR-146a in obesity and insulin resistance. MiR-146a-/- mice were subjected to a high-fat diet followed by metabolic tests and WAT transcriptomics. Gain- and loss-of-function studies were performed using human Simpson-Golabi-Behmel syndrome (SGBS) adipocytes. Compared to controls, miR-146a-/- mice gained significantly more body weight on a high-fat diet with increased fat mass and adipocyte hypertrophy. This was accompanied by exacerbated liver steatosis, insulin resistance, and glucose intolerance. Likewise, adipocytes transfected with an inhibitor of miR-146a displayed a decrease in insulin-stimulated glucose uptake, while transfecting miR-146a mimics caused the opposite effect. Natriuretic peptide receptor 3 (NPR3) was identified as a direct target gene of miR-146a in adipocytes and CRISPR/Cas9-mediated knockout of NPR3 increased insulin-stimulated glucose uptake and enhanced de novo lipogenesis. In summary, miR-146a regulates systemic and adipocyte insulin sensitivity via downregulation of NPR3.

Keywords: Adipocyte; Insulin resistance; NPR3; microRNA.


Conflict of interest statement

The authors of this study have no conflict of interest.

Figures

Fig. 1
Fig. 1
Increased body weight, fat pad mass, and liver triglyceride accumulation in miR-146a−/− mice on a high-fat diet. Female miR-146a−/− (KO) and respective control mice (WT) at an age of 10 weeks were fed a high-fat (HFD) or respective normal diet (ND) for 10 weeks. a Body weight gain. b Representative photographs of WT and KO mice on HFD. c Gonadal WAT (gWAT) weight and (d) inguinal WAT (iWAT) weight relative to body weight. e Liver triglyceride content in relation to total protein. f and g Representative microphotographs of H&E stained gWAT and liver sections. Arrows indicate liver fat vacuoles. Data are displayed as mean and SEM of 10 (a) or 5 (ce) animals per group. Statistics: (a) two-way ANOVA with Bonferroni correction, (ce) one-way ANOVA with Tukey correction. *p < 0.05, **p < 0.01, ***p < 0.001, ****p < 0.0001
Fig. 2
Fig. 2
Decreased insulin sensitivity and glucose tolerance in miR-146a−/− mice on a high-fat diet. Blood samples of female miR-146a−/− (KO) and respective control mice (WT) were analyzed after 10 weeks of high-fat diet (HFD) or normal diet (ND) and the animals’ insulin and glucose metabolism were assessed. a Fasted blood glucose, b fasted plasma insulin, and c HOMA-IR. d and e Insulin tolerance test (ITT) and oral glucose tolerance test (OGTT) in mice fed a ND. f and g ITT and OGTT in mice fed an HFD. g Area under the curve (AUC) of ITT. h AUC of OGTT. Data are displayed as mean and SEM of 10 animals per group. Statistics: (a, b, c, h, i) one-way ANOVA with Tukey correction, (dg) two-way ANOVA with Bonferroni correction, ns not significant, *p < 0.05, **p < 0.01, ***p < 0.001, ****p < 0.0001
Fig. 3
Fig. 3
Myeloproliferation in miR-146a−/− mice is not affected by high-fat diet. After 10 weeks of high-fat diet (HFD) or respective normal diet (ND), miR-146a−/− (KO) or respective control mice (WT) were sacrificed and splenocytes were isolated and analysed by flow cytometry. a Spleen weight relative to body weight. b T cells (CD3+) and c B cells (CD19+). d Gating strategy for myeloid-derived subpopulations. e Myeloid cells (Mye), f CD11b+/c+ I-Ablow cells, g CD11b+/c+ dendritic cells (DCs), h neutrophils (Neu), i macrophages (Mac), and j eosinophils (Eos). Data are displayed as mean and SEM of 5 animals per group. Statistics: (ac, ej) one-way ANOVA with Tukey correction. *p < 0.05, **p < 0.01, ***p < 0.001
Fig. 4
Fig. 4
Markers for infiltrating immune cells and WAT inflammation are not increased in miR-146a−/− mice on a high-fat diet. After 10 weeks of high-fat (HFD) or normal diet (ND) feeding miR-146a−/− (KO) or respective control mice (WT) were sacrificed, gonadal fat pads (gWAT) were dissected and processed for qPCR. mRNA expression is given in relation to Hprt as reference gene (2−ΔCT). a Adiponectin (Adipoq), b cluster of differentiation 11b (Cd11b), c cluster of differentiation 11c (Cd11c), d EGF-like module-containing mucin-like hormone receptor-like 1 (F4/80), e arginase, f iNOS, g monocyte chemoattractant protein 1 (Mcp-1), h tumor necrosis factor α (Tnf-a), and i interleukin 6 (IL-6) expression. Data are displayed as mean and SEM of 5 animals per group. Statistics: One-way ANOVA with Tukey correction. *p < 0.05, **p < 0.01
Fig. 5
Fig. 5
miR-146a regulates insulin-stimulated glucose uptake in adipocytes. To assess the influence of miR-146a on insulin sensitivity in vitro, glucose uptake experiments were performed with SGBS adipocytes. The amount of glucose taken up by the cells was measured by scintillation counting and normalized to the basal glucose uptake (0 nM insulin) and phosphorylation of AKT was assessed. a miR-146a inhibitor (50 nm) or inhibitor control (NTi, 50 nM) transfected adipocytes. b miR-146a mimic (20 nM) or control (NT, 20 nM) transfected adipocytes. c Adipocytes stably overexpressing miR-146a or non-target control (Ctrl). d Representative Western blot for pAKT (Ser473) and AKT after 15 min stimulation with 0 nM and 10 nM insulin with α-tubulin as loading control. e Densitometric analysis of 4 independent experiments displayed as mean and SEM with phosphorylated AKT (Ser473) normalized to total AKT. Data are displayed as mean and SEM of 3 (a and c) or 4 (b) independent experiments. Statistics: (a, b, c) two-way ANOVA with Bonferroni correction and non-linear fit with four parameters, (e) paired t test, *p < 0.05, **p < 0.01
Fig. 6
Fig. 6
miR-146a target identification. a Hierarchical cluster analysis of genes differentially expressed between miR-146a−/− (KO) and control (WT) samples with 5 mice per group (average linkage clustering, 1-correlation). b Schematic illustration of miR-146a target identification with Affymetrix microArray-based transcriptome analysis and miRNA target prediction. RNA was isolated from gonadal WAT and processed for gene expression analysis. The upregulated genes in miR-146a−/− samples (red) in both diet groups were compared to the predicted targets of miR-146a in the database miRWalk (yellow). Regulated and predicted genes from both diets (normal diet: 6, high-fat diet: 55) were compared and 4 candidate genes, which are upregulated in miR-146a−/− mice and predicted as miR-146a targets, were identified. These genes are given in (c) with the fold change to wild-type mice. d Validation of the candidate genes in SGBS adipocytes overexpressing miR-146a. Data are displayed as mean and SEM of 4 independent experiments. Statistics: (d) paired t test, *p < 0.05
Fig. 7
Fig. 7
NPR3 is a target gene of miR-146a in human adipocytes and murine WAT. a Representative Western blot for NPR3 in SGBS adipocytes overexpressing miR-146a (146a) compared to control cells (Ctrl) with (b) densitometric analysis of 4 independent experiments in relation to β-actin. c Illustration of miR-146a binding sites in the NPR3 3′ UTR predicted by miRWalk 3.0. WT wild type, mut mutated. d Firefly luciferase signal normalized to Renilla luciferase signal of HEK293 cells co-transfected with miR-146a mimic or control (NT) and pmirGLO dual-luciferase plasmid carrying either the two predicted NPR3-miR-146a binding sites (WT), a plasmid with both target sites (site 1 + 2), or a plasmid with either binding site 1 (site 1) or binding site 2 (site 2) mutated. e Npr3 protein expression in gonadal fat pads of miR-146a−/− (KO) and control (WT) mice after 10 weeks of high-fat diet (HFD) or normal diet (ND) with densitometric analysis of 5 animals per group displayed as mean and SEM. Statistics: (b and d) paired t test, e one-way ANOVA with Tukey correction *p < 0.05, **p < 0.01, ***p < 0.001, ****p < 0.0001
Fig. 8
Fig. 8
CRISPR/Cas9-mediated NPR3 ablation increases insulin-stimulated glucose uptake and de novo lipogenesis. a Representative Western blot for NPR3 (60 kD) and adiponectin (AdipoQ) in SGBS pre-adipocytes (d0) and adipocytes (d14) in control cells (EV) and NPR3 KO cells with densitometric analysis displayed as mean and SEM of 4 independent experiments in relation to tubulin. b Differentiation rates of adipocyte cultures (adipocytes/total cells). c Insulin-dependent glucose uptake was measured by scintillation counting and normalized to the basal rate of control cells (0 nM insulin). d Insulin-dependent de novo lipogenesis was measured by scintillation counting and normalized to the basal rate of control cells (0 nM insulin). e Insulin-dependent glucose uptake in control (EV) and NPR3 KO cells transfected with non-targeting (NT) or miR-146a mimic was measured by scintillation counting and normalized to the basal rate of EV cells (0 nM insulin). Data are displayed as mean and SEM of 5 (c) and 4 (d) independent experiments. Statistics: (a) two-way ANOVA with Bonferroni correction (c and d) two-way ANOVA with Bonferroni correction and non-linear fit with three parameters. *p < 0.05, **p < 0.01, ****p < 0.0001

References

    1. Crewe C, An YA, Scherer PE. The ominous triad of adipose tissue dysfunction: inflammation, fibrosis, and impaired angiogenesis. J Clin Invest. 2017;127(1):74–82. doi: 10.1172/JCI88883. - DOI - PMC - PubMed
    1. Kusminski CM, Bickel PE, Scherer PE. Targeting adipose tissue in the treatment of obesity-associated diabetes. Nat Rev Drug Discov. 2016;15(9):639–660. doi: 10.1038/nrd.2016.75. - DOI - PubMed
    1. Goody D, Pfeifer A. MicroRNAs in brown and beige fat. Biochim Biophys Acta Mol Cell Biol Lipids. 2018 doi: 10.1016/j.bbalip.2018.05.003. - DOI - PubMed
    1. Murri M, El Azzouzi H. MicroRNAs as regulators of mitochondrial dysfunction and obesity. Am J Physiol Heart Circ Physiol. 2018;315(2):H291–H302. doi: 10.1152/ajpheart.00691.2017. - DOI - PubMed
    1. Koh E-H, et al. miR-30a remodels subcutaneous adipose tissue inflammation to improve insulin sensitivity in obesity. Diabetes. 2018 doi: 10.2337/db17-1378. - DOI - PMC - PubMed

MeSH terms