. 2020 Nov 18;16(11):e1009175.
doi: 10.1371/journal.pgen.1009175. eCollection 2020 Nov.

Stability of SARS-CoV-2 phylogenies

Affiliations

Stability of SARS-CoV-2 phylogenies

Yatish Turakhia et al. PLoS Genet. .

Abstract

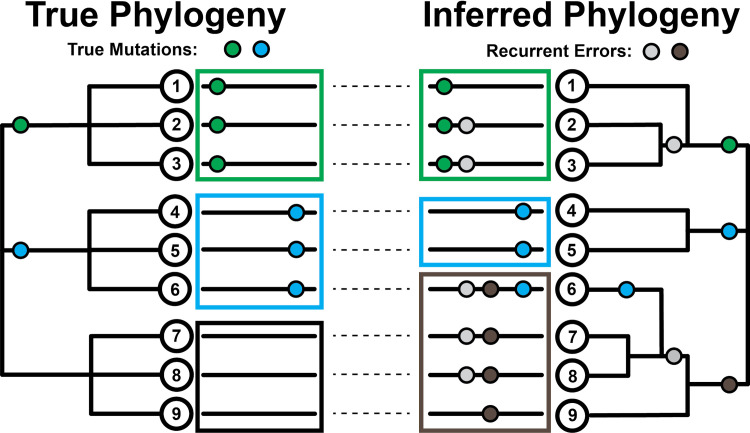
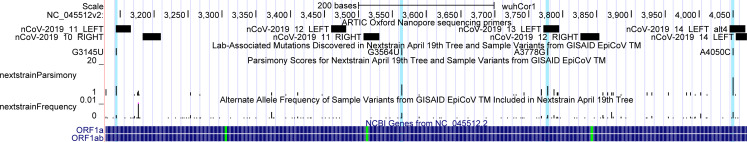
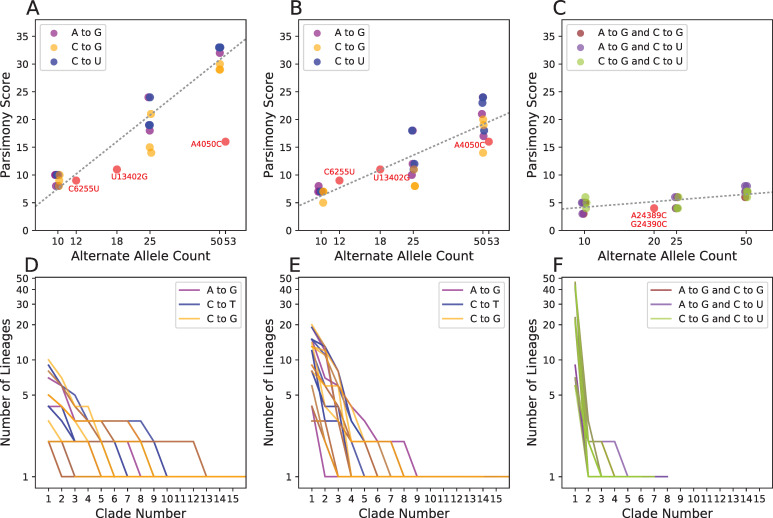
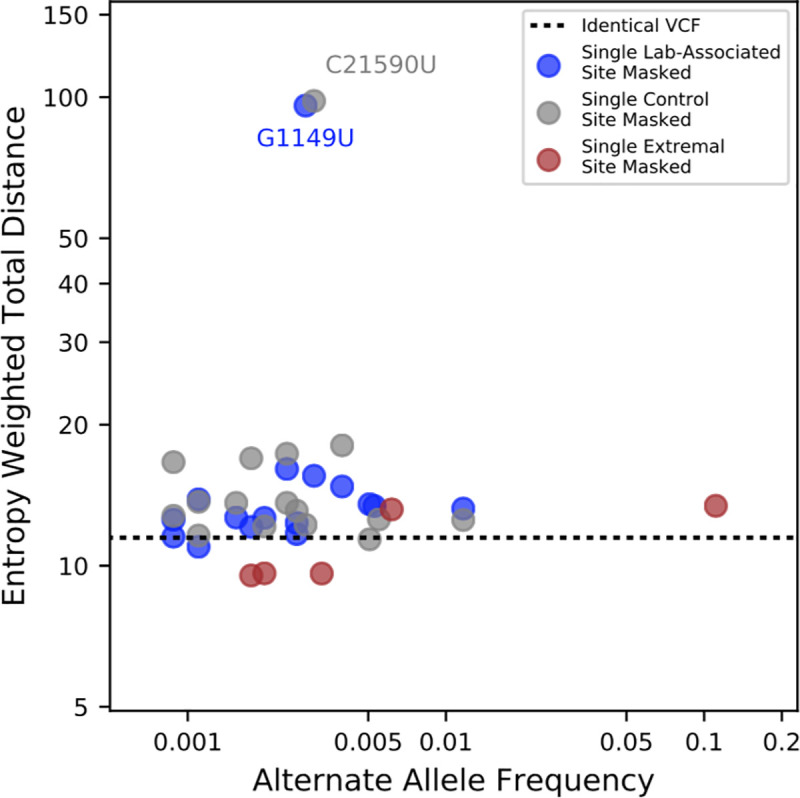
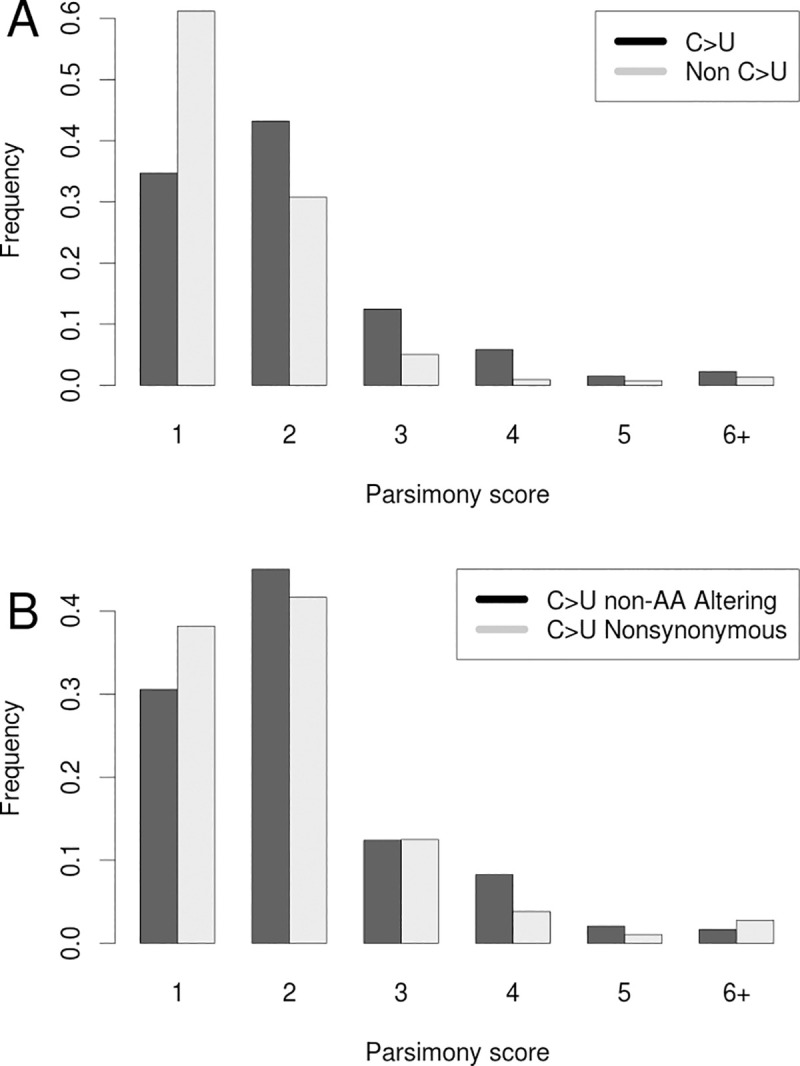
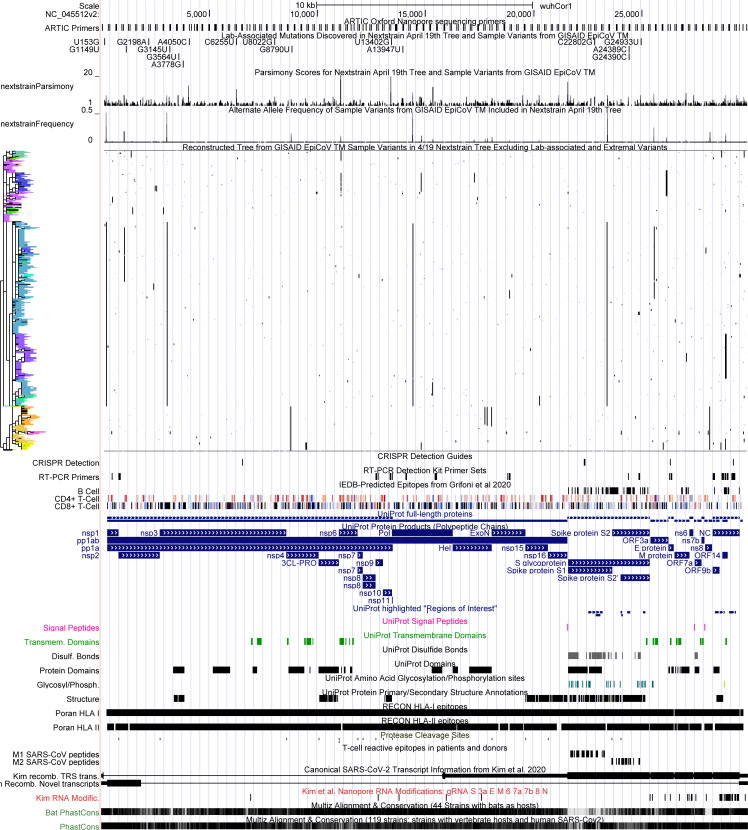
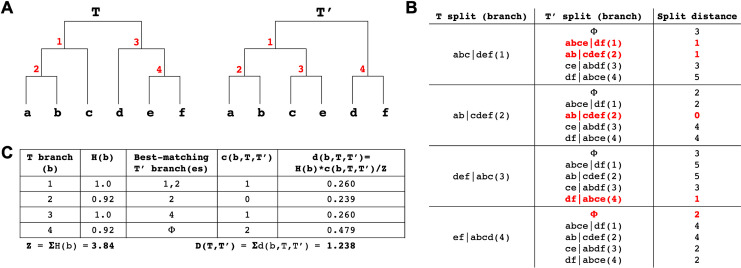
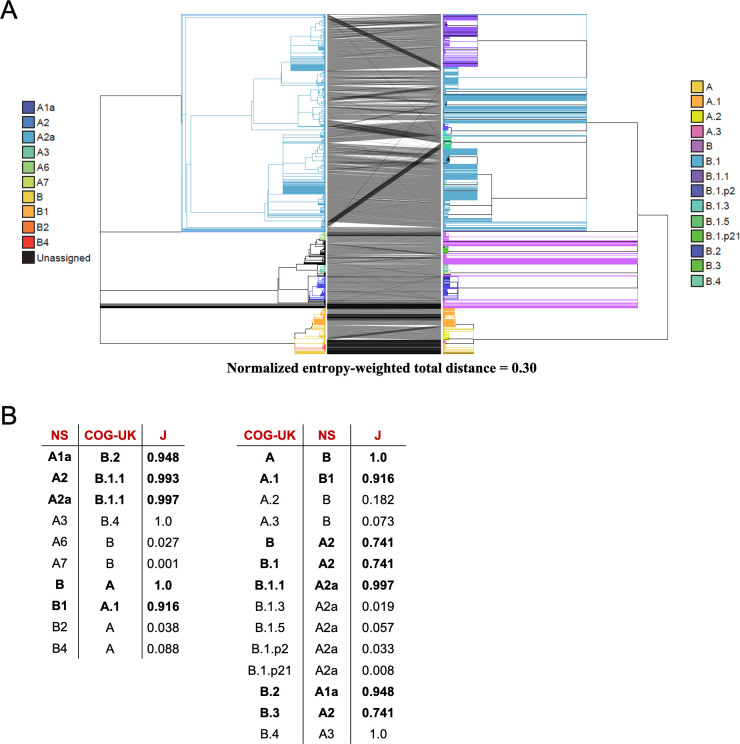
The SARS-CoV-2 pandemic has led to unprecedented, nearly real-time genetic tracing due to the rapid community sequencing response. Researchers immediately leveraged these data to infer the evolutionary relationships among viral samples and to study key biological questions, including whether host viral genome editing and recombination are features of SARS-CoV-2 evolution. This global sequencing effort is inherently decentralized and must rely on data collected by many labs using a wide variety of molecular and bioinformatic techniques. There is thus a strong possibility that systematic errors associated with lab-or protocol-specific practices affect some sequences in the repositories. We find that some recurrent mutations in reported SARS-CoV-2 genome sequences have been observed predominantly or exclusively by single labs, co-localize with commonly used primer binding sites and are more likely to affect the protein-coding sequences than other similarly recurrent mutations. We show that their inclusion can affect phylogenetic inference on scales relevant to local lineage tracing, and make it appear as though there has been an excess of recurrent mutation or recombination among viral lineages. We suggest how samples can be screened and problematic variants removed, and we plan to regularly inform the scientific community with our updated results as more SARS-CoV-2 genome sequences are shared (https://virological.org/t/issues-with-sars-cov-2-sequencing-data/473 and https://virological.org/t/masking-strategies-for-sars-cov-2-alignments/480). We also develop tools for comparing and visualizing differences among very large phylogenies and we show that consistent clade- and tree-based comparisons can be made between phylogenies produced by different groups. These will facilitate evolutionary inferences and comparisons among phylogenies produced for a wide array of purposes. Building on the SARS-CoV-2 Genome Browser at UCSC, we present a toolkit to compare, analyze and combine SARS-CoV-2 phylogenies, find and remove potential sequencing errors and establish a widely shared, stable clade structure for a more accurate scientific inference and discourse.


Conflict of interest statement

Conflict of interest statement. A.S.H. and D.H. receive royalties from the sale of UCSC Genome Browser source code, LiftOver, GBiB, and GBiC licenses to commercial entities. RL works as an advisor to GISAID.

Figures

Fig 1
Fig 1. Effect of recurrent sequencing errors on phylogenetic inferences.
(Left) Pictorial representation of how the evolutionary histories of viral sequences (long black lines adjacent to tree nodes) can be traced on a phylogenetic tree using mutational events (green and blue circles). In this case, each mutation occurs once independently. (Right) The introduction of recurrent errors (gray and brown circles) can obscure the true evolutionary relationship between sequences leading to the inference of artifactual subgroups/clades (green-gray, leaves 2 & 3, and gray-brown, leaves 7 & 8) and even the incorrect assignment of viral sequences to subgroups (leaf 6 no longer correctly groups with the blue subgroup containing leaves 4 & 5). Large boxes group together subgroups based on inferred first mutation. Note that systematic errors must be non-heritable and their inferred placement on internal branches reflects their impacts on phylogenetic inference. We display this example as ‘clock-like’ for additional clarity.
Fig 2
Fig 2
(A) The relationship between alternate allele count and parsimony score. Point radius indicates how many sites share a single parsimony score and alternate allele count. Several noteworthy recurrent mutations are labelled. Note that the X-axis is log-scaled. (B) The sizes of independent clades for the same alternate allele arranged in descending order. The number of lineages per clade is shown on logarithmic scale facilitating comparison with Panel (A). These indicate that when alternate allele clade sizes for a given site are sorted in decreasing order, their sizes are reduced going from left to right by a multiplicative factor at each step, consistent with the log-linear relationship displayed in Panel (A). Variants with remarkably high recurrence are shown with color reflecting their properties: lab-associated (red), recurrent and associated with a poly-U stretch (blue), and high frequency with many forward and backward mutations (purple). Grey lines in the background are the same values but for all other variants with parsimony score 4 or greater. The values in parentheses in the variant names indicate the number of unique clades associated with the alternate allele. Note that in some cases, this extends beyond the limit of the X-axis and that the Y-axis is log-scaled for visibility. (C) An example of the observed patterns of evolution at one highly recurrent site with reference allele U and alternate allele G, site 13402 and parsimony score 14, where 14 alternate allele clades (in red) each represent an apparently independent incidence of the mutation substituting the alternate allele.
Fig 3
Fig 3. UCSC Genome Browser display of lab-associated variants and ARTIC primers.
Bases 3130 to 4070 of the SARS-CoV-2 genome are displayed, containing four lab-associated variants highlighted in light blue. G3145U, A3778G and A4050C overlap ARTIC primer bind sites. An interactive view of this figure is available from http://genome.ucsc.edu/s/SARS_CoV2/labAssocMuts.
Fig 4
Fig 4. Parsimony scores at sites with introduced systematic errors.
We added artificial errors to 10, 25, and 50 Australian (A) and early-March French (B) samples at the sites A11991G (purple), C22214G (blue), and C10029U (orange) in three replicates, then produced phylogenies and computed the parsimony score at each site. (C) We also introduced errors to the early-March French samples two at a time per sequence rather than individually. For comparison, we also show the values for three lab-associated variants (C6255U, U13402G, A4050C; A, B) and for pair of linked lab-associated variants (A24389C and G24390C; C). Each panel (A–C) contains a best-fit line (as in Fig 2A), for the relationship between log2 alternate allele count and parsimony in simulated error data (slopes = 10.0, 5.55, and 1.0). (D–F) Corresponding clade sizes arranged in descending order for error simulations in (A–C, respectively, as in Fig 2B).
Fig 5
Fig 5. Lab-associated variants impact phylogenetic inferences.
Part of the tree we obtained from the 4/19/2020 Nextstrain tree (left) compared to the corresponding part of tree after removal of sites with lab-associated variants (right). Lab-associated variants (red) can affect the inferred phylogeny and are associated with apparent back-mutation to the ancestral allele (grey in column 14408, left) at other sites (white). When lab-associated variants are removed, the resulting tree (right) shows no evidence for back-mutation at those sites (now white in column 14408), though several independent forward mutations remain evident.
Fig 6
Fig 6. The relationship between alternate allele frequencies of lab-associated variants and effect of masking on inferred tree topology.
Entropy-weighted total distances relative to the reference maximum likelihood phylogeny are shown for phylogenies constructed after masking individual sites. Blue points correspond to sites with lab-specific alternate alleles, grey points correspond to control sites with parsimony scores of 1 and similar alternate allele frequencies to the sites with lab-specific alternate alleles, and brown points correspond to non-lab-specific extremal sites. The black horizontal line indicates the entropy-weighted total distance value for a maximum likelihood phylogeny constructed from an alignment identical to that of the reference phylogeny. Two outliers, C21590U (control) and G1149U (lab-associated), have outsize effects on inferred tree topology.
Fig 7
Fig 7. Recurrence of mutations during SARS-CoV-2 evolution.
(A) Frequencies of parsimony scores for C>U (Black) vs all other mutation types (Grey). (B) Frequencies of parsimony scores for C>U mutations that do affect amino acid sequences (non-synonymous; Grey), and those that do not affect amino acid sequences (synonymous; Black).
Fig 8
Fig 8. UCSC Genome Browser view of all lab-associated variants in the context of parsimony scores, alternate allele frequencies, the full genetic variation dataset with phylogenetic tree constructed after removing lab-associated and extremal variants.
This genetic variation data can be cross-referenced against many other diverse datasets available in the UCSC SARS-CoV-2 Genome Browser. Interactive view: http://genome.ucsc.edu/s/SARS_CoV2/labAssocMutsAll.
Fig 9
Fig 9. Entropy-weighted distance statistic.
(A) Example trees (T and T’) for this comparison with identical sets of leaves but different topologies. Internal branches are labelled in red. (B) The split distance statistic for each T node (see Methods for notation). Split distance of each T split (branch) from all T’ splits plus a “garbage node” (ɸ) containing a null set of leaves, with the matching split distance and its corresponding T’ split (branch) for each T split (branch) highlighted in red. Multiple T’ splits can match a T split but the garbage node is given precedence (as is the case in T branch 4). (C) Table showing the entropy, best-matching T’ branch(es), matching split distance and entropy-weighted matching split distance for each branch in T, as well as the entropy-weighted total distance D(T,T’) between T and T’.
Fig 10
Fig 10. Comparisons of Nextstrain trees over time.
(A) Multidimensional scaling of normalized entropy-weighted total distances among phylogenetic trees produced by Nextstrain from March and April. Each topology is labelled with its date and dates are depicted in a color gradient from 3/23 (red) to 4/30 (blue). Coordinates 1 and 2 are plotted here and each contributes 34% and 15% of the total variance explained, respectively. (B) Relationships between Nextstrain phylogenies are shown in a tree-of-trees, “meta-tree” [67] we constructed, which displays the distances among topologies of the constitutive trees.
Fig 11
Fig 11. Comparison of Nextstrain and COG-UK trees.
(A) A tanglegram of the Nextstrain tree from 4/19 (left) with the COG-UK tree from 4/24 (right). Each tree has 4167 samples. (B) The COG-UK clades (which they term “lineages”) having the highest Jaccard similarity coefficient (J) with each Nextstrain (NS) named clade and vice versa, where the Jaccard similarity coefficient is computed using the set of samples from the root of that clade. Clades with more than 200 samples are shown in bold font and called “big”, the others “small”. While the naming schemes differ, for each big Nexstrain clade there is a closely corresponding COG-UK clade, and vice-versa.
Fig 12
Fig 12. Comparison of Nextstrain and the COG-UK trees.
(A) A tanglegram of our Nextstrain consensus tree (left) and COG-UK tree from 4/24 (right). Each tree has 422 samples. (B) The COG-UK lineages having the highest Jaccard similarity coefficient (J) with each Nextstrain consensus (NS) named clade and vice versa. Big clades defined in Fig 11 (those containing 200 or more samples in the Fig 11A trees) are in bold. Lineages in ‘N/A’ (B.1.3, B.1.p2 and B.1.p21) were pruned out as a result of restricting the trees to common samples. (C) A tanglegram of our tree produced after masking all lab-associated and extremal variants except 11083 (left) and COG-UK tree from 4/24 (right). Each tree has 4172 samples and the samples (branches) have been colored based on COG-UK lineage labels.

References

    1. NCBI Staff. NCBI Insights: INSDC Statement on SARS-CoV-2 sequence data sharing during COVID-19. 17 Aug 2020 [cited 26 Aug 2020]. Available: https://ncbiinsights.ncbi.nlm.nih.gov/2020/08/17/insdc-covid-data-sharing/
    1. Maurano MT, Ramaswami S, Westby G, Zappile P, Dimartino D, Shen G, et al. Sequencing identifies multiple, early introductions of SARS-CoV2 to New York City Region. 10.1101/2020.04.15.20064931 - DOI - PMC - PubMed
    1. Deng X, Gu W, Federman S, Du Plessis L, Pybus O, Faria N, et al. A Genomic Survey of SARS-CoV-2 Reveals Multiple Introductions into Northern California without a Predominant Lineage. 10.1101/2020.03.27.20044925 - DOI - PMC - PubMed
    1. Zhang Y-Z, Holmes EC. A Genomic Perspective on the Origin and Emergence of SARS-CoV-2. Cell. 2020;181:223–227. 10.1016/j.cell.2020.03.035 - DOI - PMC - PubMed
    1. Bal A, Destras G, Gaymard A, Bouscambert-Duchamp M, Valette M, Escuret V, et al. Molecular characterization of SARS-CoV-2 in the first COVID-19 cluster in France reveals an amino-acid deletion in nsp2 (Asp268Del). 10.1016/j.cmi.2020.03.020 - DOI - PMC - PubMed

Publication types