Clinical Trial
. 2021 May 20;137(20):2800-2816.
doi: 10.1182/blood.2020005650.

Genomic and transcriptomic correlates of Richter transformation in chronic lymphocytic leukemia

Affiliations
Clinical Trial

Genomic and transcriptomic correlates of Richter transformation in chronic lymphocytic leukemia

Jenny Klintman et al. Blood. .

Abstract

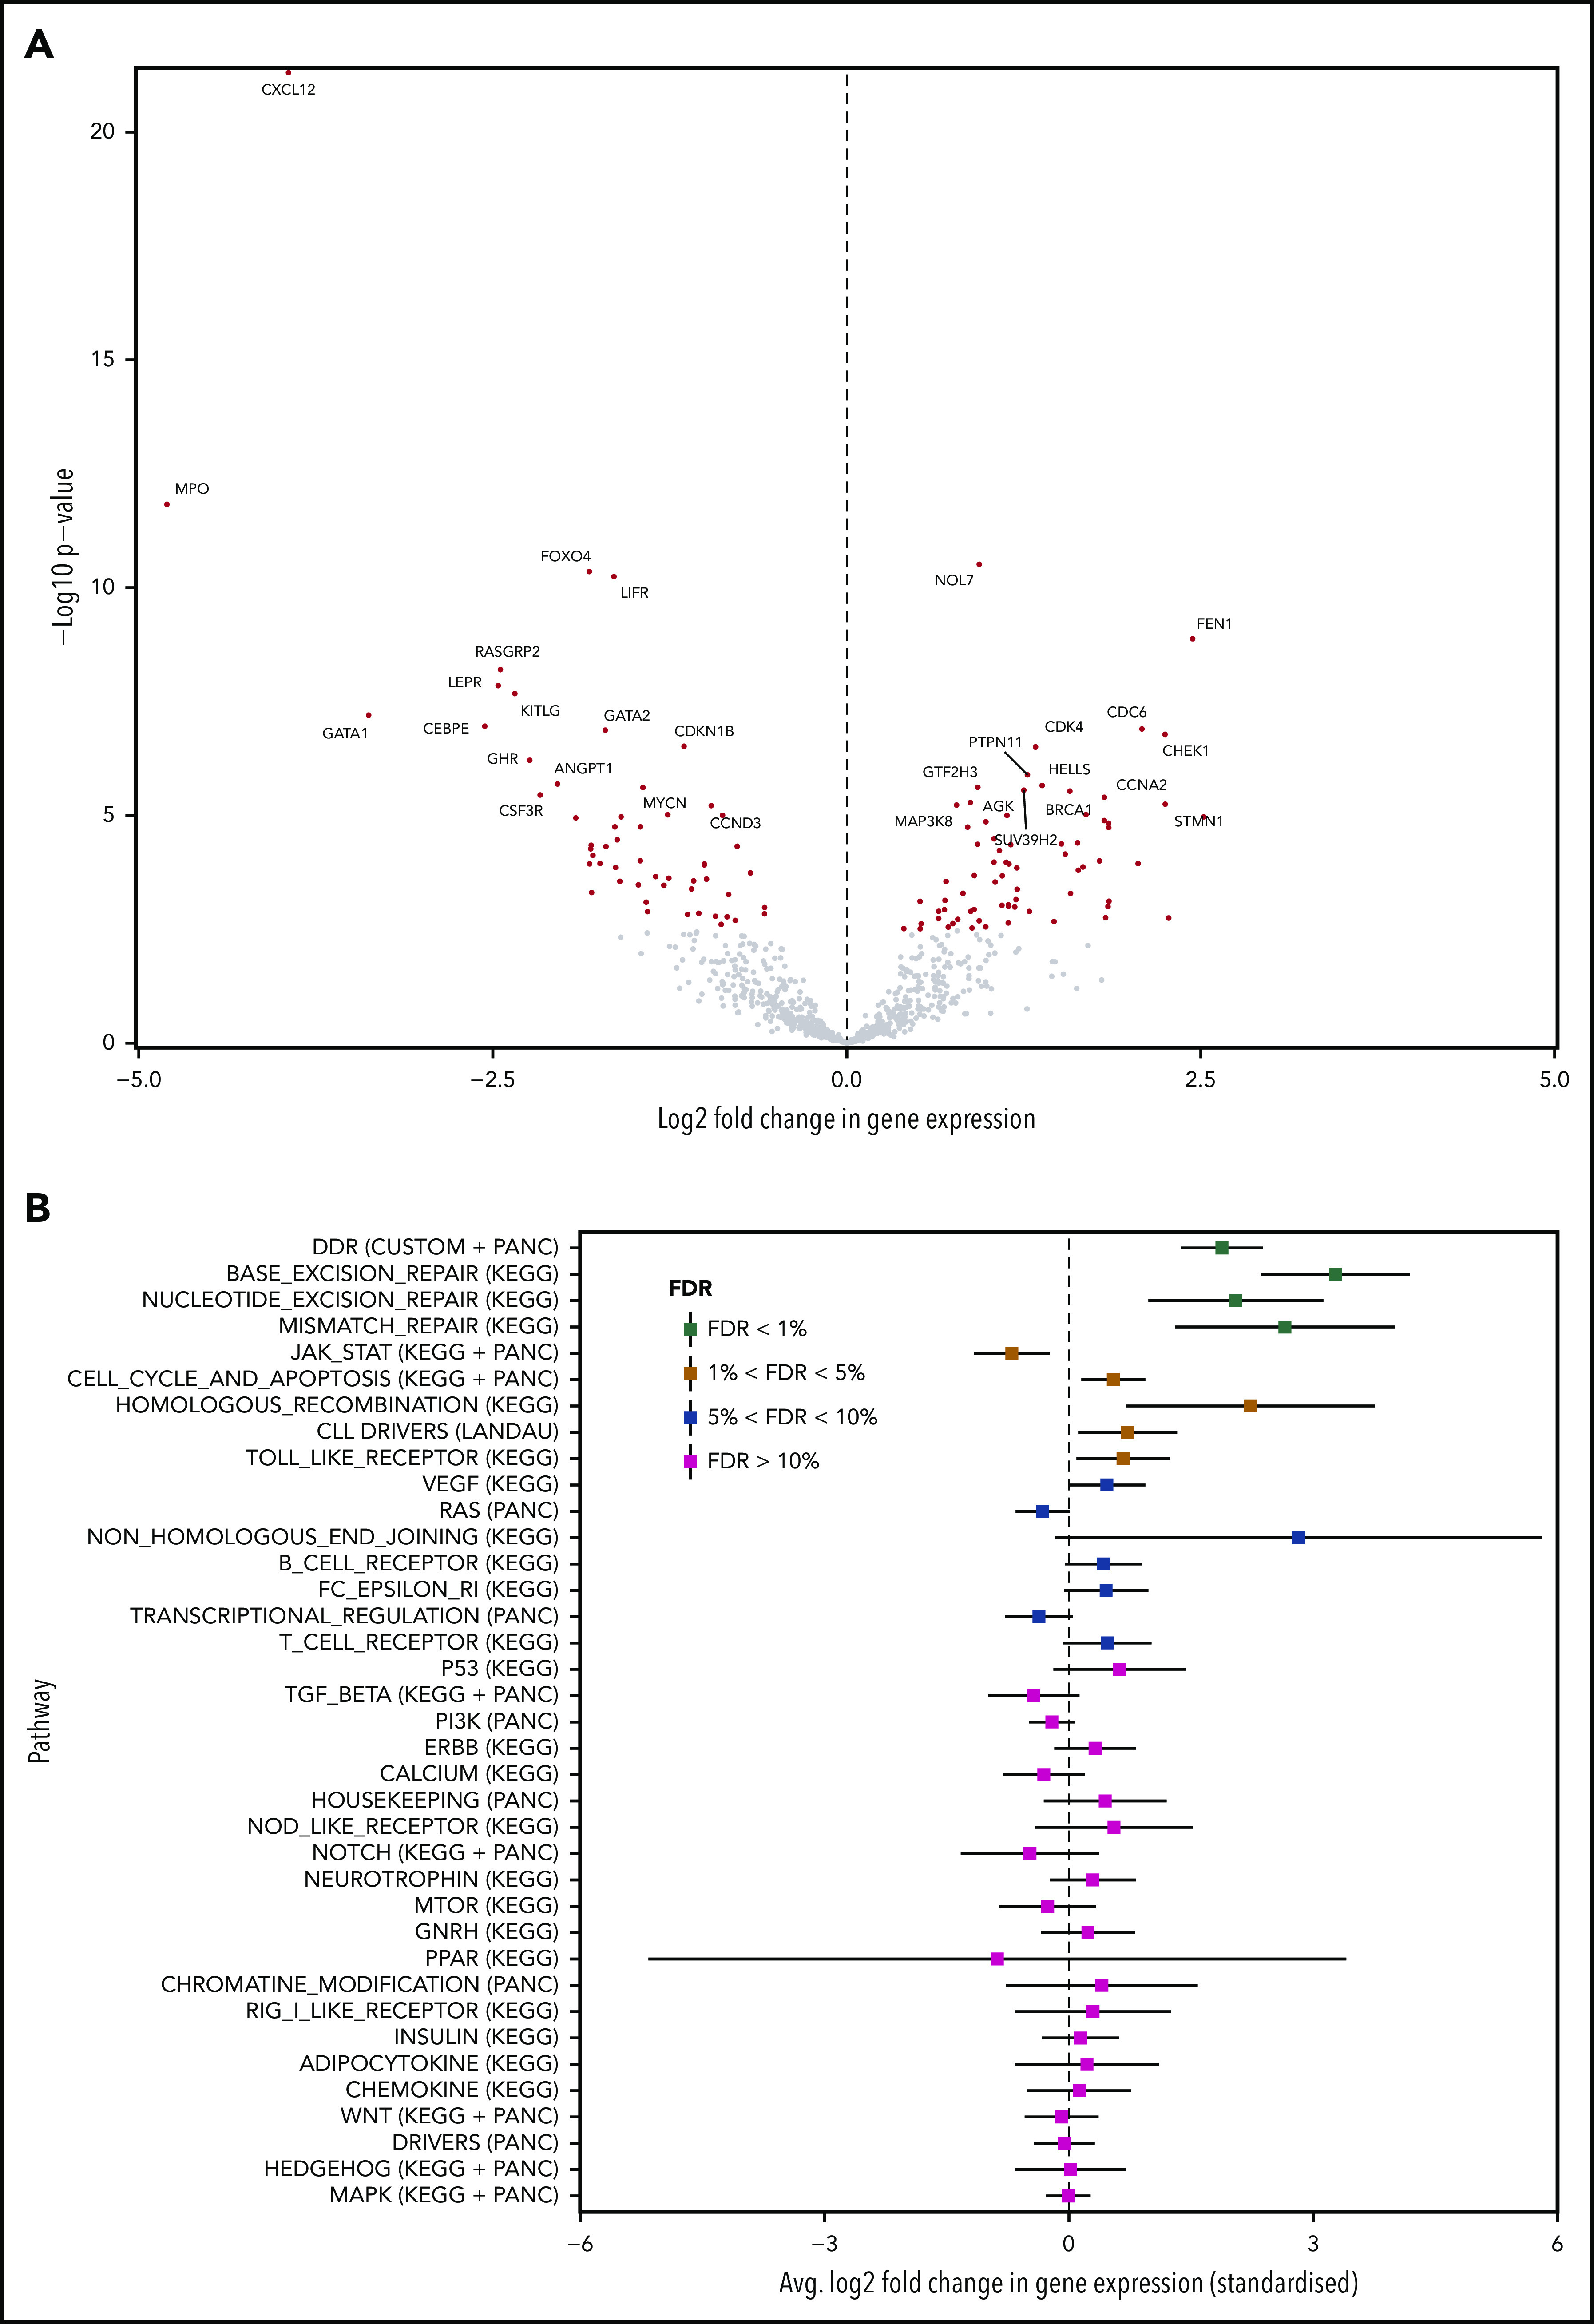
The transformation of chronic lymphocytic leukemia (CLL) to high-grade B-cell lymphoma is known as Richter syndrome (RS), a rare event with dismal prognosis. In this study, we conducted whole-genome sequencing (WGS) of paired circulating CLL (PB-CLL) and RS biopsies (tissue-RS) from 17 patients recruited into a clinical trial (CHOP-O). We found that tissue-RS was enriched for mutations in poor-risk CLL drivers and genes in the DNA damage response (DDR) pathway. In addition, we identified genomic aberrations not previously implicated in RS, including the protein tyrosine phosphatase receptor (PTPRD) and tumor necrosis factor receptor-associated factor 3 (TRAF3). In the noncoding genome, we discovered activation-induced cytidine deaminase-related and unrelated kataegis in tissue-RS affecting regulatory regions of key immune-regulatory genes. These include BTG2, CXCR4, NFATC1, PAX5, NOTCH-1, SLC44A5, FCRL3, SELL, TNIP2, and TRIM13. Furthermore, differences between the global mutation signatures of pairs of PB-CLL and tissue-RS samples implicate DDR as the dominant mechanism driving transformation. Pathway-based clonal deconvolution analysis showed that genes in the MAPK and DDR pathways demonstrate high clonal-expansion probability. Direct comparison of nodal-CLL and tissue-RS pairs from an independent cohort confirmed differential expression of the same pathways by RNA expression profiling. Our integrated analysis of WGS and RNA expression data significantly extends previous targeted approaches, which were limited by the lack of germline samples, and it facilitates the identification of novel genomic correlates implicated in RS transformation, which could be targeted therapeutically. Our results inform the future selection of investigative agents for a UK clinical platform study. This trial was registered at www.clinicaltrials.gov as #NCT03899337.


Conflict of interest statement

Conflict-of-interest disclosure: A.S. received honoraria from Gilead, Janssen, Roche, and AbbVie, and received nonrestricted educational grants from Gilead and Janssen. T.A.E. received honoraria from Roche, Janssen, AbbVie, Gilead, and AstraZeneca, and received travel fees to scientific conferences from Takeda. N.A. received speaker fees from Gilead. The remaining authors declare no competing financial interests.

Figures

None
Graphical abstract
Figure 1.
Figure 1.
Overview of the study. (A) Discovery cohort (CHOP-O study). Paired PB-CLL (FF) and RS (FFPE) samples. (B) Validation cohort (patients with RS). Paired nodal CLL (FFPE) and RS (FFPE) samples. SNVs, InDels, and CNAs were identified in pairs of peripheral blood CLL (PB-CLL) and Richter diagnostic biopsies (tissue-RS) (from 17 CHOP-O patients) using whole-genome sequencing. Based on these data, we conducted integrated analysis of mutational burden, analysis of clonal structure, and analysis of noncoding mutations. We validated our findings through differential gene expression and gene-set enrichment analysis on transcriptomic data from an independent cohort of 12 subjects with RS.
Figure 2.
Figure 2.
SNVs, InDels, and CNAs in the cohort of 17 patients with R. (A) Number of SNVs and InDels in the PB-CLL versus the tissue-RS in each of the 17 patients. CH1003, CH1009 and CH1019 (indicated with asterisk) appear as outliers due to an increased mutational burden and were excluded from downstream analysis. (B-D) Number of genes per sample harboring a SNV/InDel or CNA in the PB-CLL compared with the tissue-RS. Three groups of genes are illustrated: CLL drivers (B), DDR (C), and recurrent (D) genes. Statistics are as follows: (B) 2-sided Wilcoxon signed-rank test with continuity correction (P = .022; Δm = 2.5; 95% CI, 1.5-5.0); 2-sided paired Student t test after applying a Blom transformation (P = .010; Δm = 0.46; 95% CI, 0.13-0.80); (C) 2-sided Wilcoxon signed-rank test with continuity correction (P = .022; Δm = 3.0; 95% CI, 1.5-12.0); 2-sided paired Student t test after applying a Blom transformation (P = .018; Δm = 0.56; 95% CI, 0.12-1.00); (D) 2-sided Wilcoxon signed-rank test with continuity correction (P = .0025; Δm = 5.5; 95% CI, 2.5-12.5); 2-sided paired Student t test after applying a Blom transformation (P = .0030; Δm = 0.64; 95% CI, 0.26-1.00). (E) Recurrent genes carrying a SNV or InDel in at least 2 RS patients. Genes not previously implicated in the transformation to RS are in red.
Figure 3.
Figure 3.
Distribution of SNVs, InDels, and CNAs across patients and samples. Genes that were recurrent in the tissue-RS (A) and total number of mutated samples per recurrent gene and by DNA source (B). Recurrent genes were those harboring (1) an SNV/InDel in ≥ 2 tissue-RS samples or (2) an SNV/InDel or CNA ≥2 tissue-RS samples and constituted any of 46 cancer pathways or CLL drivers or DDR genes. Red gene labels in panel A indicate CLL drivers and orange labels indicate DDR genes. Gray dots indicate cases with MYC overexpression in the tissue-RS.
Figure 4.
Figure 4.
Transitions in the values of CCFs of somatic mutations during transformation from CLL to RS in each CHOP-O patient. We observe clonal expansions (ie, cancer cell fractions [CCF] values increase from PB-CLL to tissue-RS), clonal contractions (ie, CCF values decrease from PB-CLL to tissue-RS) or clonal stability (ie, CCF values remain roughly the same between PB-CLL and tissue-RS). Each gray line indicates the transition of a single SNV/InDel from PB-CLL to tissue-RS. If a variant is absent in 1 phase, no transition line is shown.
Figure 5.
Figure 5.
Pathway-based clonal analysis. (A) For each pathway, we give the mean and 95% credible intervals of the ratio (P1(1 − P2)) / ((1 − P1) P2) (in log2 scale), where P1 is the probability given the data that the pathway harbors a mutation that clonally expands (ie, its CCF shows a significant increase) in the transition from PB-CLL to tissue-RS. Similarly, P2 is the probability given the data that the pathway harbors a mutation that clonally contracts in the transition to RS. Pathways with FDR < 5%, are highly likely to harbor clonally expanding (rather than contracting) mutations during transformation to RS. (B) Clonal transition events in the gene sets with FDR < 1%, that is, DDR genes and the MAPK-signaling pathway. Each line corresponds to a single SNV or InDel. The color encodes the gene harboring the corresponding mutation (shown at the bottom of the graph).
Figure 6.
Figure 6.
Differential expression and enrichment analysis. (A) Volcano plot indicating upregulated and downregulated genes in tissue-RS compared with the PB-CLL. A positive/negative change in expression indicates upregulation/downregulation. Red dots indicate significantly upregulated or downregulated genes at FDR < 1%. (B) Summary of the pathway enrichment analysis. For each pathway, we give the average change in gene expression and 95% confidence intervals. Positive/negative average values indicate a concerted upregulation/downregulation of genes in the pathway upon transformation. FDR values of <5% indicate that the average change in expression is significant.
Figure 7.
Figure 7.
Summary of kataegis regions identified through analysis of promotor/enhancer regions. (A) Total kataegis per sample, where Kataegis were independently derived per sample. (B) Number of samples with mutations within the kataegis region when considering the pooled Kataegis in either the CLL or RS phase data. (C) Genes linked to Kataegis regions by proximity (promotors) or TAD data (enhancers). The remaining genes are divided into Ig-1:Ig-6 for immunoglobulin genes and E1:E22 for unknown enhancers. The corresponding number of samples mutated in each Kataegis are listed. An asterisk (*) indicates that >20% of mutations were at AID sites (see supplemental Methods). (D) Patient-specific regulation of gene expression in 5 of the genes in panel C in 8 patients for which we had RNA expression data. A red/blue triangle indicates upregulation/downregulation in the RS phase, when compared with CLL. No triangle means equivalent expression between the 2 phases.

Comment in

References

    1. Tsimberidou AM, Keating MJ. Richter’s transformation in chronic lymphocytic leukemia. Semin Oncol. 2006;33(2):250-256. - PubMed
    1. Rossi D, Spina V, Deambrogi C, et al. . The genetics of Richter syndrome reveals disease heterogeneity and predicts survival after transformation. Blood. 2011;117(12):3391-3401. - PubMed
    1. Rossi D, Spina V, Gaidano G. Biology and treatment of Richter syndrome. Blood. 2018;131(25):2761-2772. - PubMed
    1. Maddocks KJ, Ruppert AS, Lozanski G, et al. . Etiology of ibrutinib therapy discontinuation and outcomes in patients with chronic lymphocytic leukemia. JAMA Oncol. 2015;1(1):80-87. - PMC - PubMed
    1. Li J, Smith A, Crouch S, Oliver S, Roman E. Estimating the prevalence of hematological malignancies and precursor conditions using data from Haematological Malignancy Research Network (HMRN). Cancer Causes Control. 2016;27(8):1019-1026. - PMC - PubMed

MeSH terms

Supplementary concepts

Associated data