. 2020 Dec 1;143(12):3653-3671.
doi: 10.1093/brain/awaa326.

Evolution of neuroinflammation across the lifespan of individuals with Down syndrome

Affiliations

Evolution of neuroinflammation across the lifespan of individuals with Down syndrome

Lisi Flores-Aguilar et al. Brain. .

Abstract

Epidemiological and experimental studies suggest that a disease-aggravating neuroinflammatory process is present at preclinical stages of Alzheimer's disease. Given that individuals with Down syndrome are at increased genetic risk of Alzheimer's disease and therefore develop the spectrum of Alzheimer's neuropathology in a uniform manner, they constitute an important population to study the evolution of neuroinflammation across the Alzheimer's continuum. Therefore, in this cross-sectional study, we characterized the brain inflammatory profile across the lifespan of individuals with Down syndrome. Microglial morphology and inflammatory cytokine expression were analysed by immunohistochemistry and electrochemiluminescent-based immunoassays in the frontal cortex from foetuses to adults with Down syndrome and control subjects (16 gestational weeks to 64 years), totalling 127 cases. Cytokine expression in mixed foetal primary cultures and hippocampus of adults with Down syndrome, as well as the effects of sex on cytokine expression were also analysed. A higher microglial soma size-to-process length ratio was observed in the frontal cortex of children and young adults with Down syndrome before the development of full-blown Alzheimer's pathology. Moreover, young adults with Down syndrome also displayed increased numbers of rod-like microglia. Increased levels of interleukin-8 and interleukin-10 were observed in children with Down syndrome (1-10 years; Down syndrome n = 5, controls n = 10) and higher levels of interleukin-1β, interleukin-1α, interleukin-6, interleukin-8, interleukin-10, interleukin-15, eotaxin-3, interferon gamma-induced protein 10, macrophage-derived chemokine, and macrophage inflammatory protein-beta, were found in young adults with Down syndrome compared to euploid cases (13-25 years, Down syndrome n = 6, controls n = 24). Increased cytokine expression was also found in the conditioned media of mixed cortical primary cultures from second trimester foetuses with Down syndrome (Down syndrome n = 7, controls n = 7). Older adults with Down syndrome (39-68 years, Down syndrome n = 22, controls n = 16) displayed reduced levels of interleukin-10, interleukin-12p40, interferon-gamma and tumour necrosis factor-alpha. Microglia displayed larger somas and shorter processes. Moreover, an increase in dystrophic microglia and rod-like microglia aligning to neurons harbouring tau pathology were also observed. Sex stratification analyses revealed that females with Down syndrome had increased interleukin-6 and interleukin-8 levels compared to males with Down syndrome. Finally, multivariate projection methods identified specific cytokine patterns among individuals with Down syndrome. Our findings indicate the presence of an early and evolving neuroinflammatory phenotype across the lifespan in Down syndrome, a knowledge that is relevant for the discovery of stage-specific targets and for the design of possible anti-inflammatory trials against Alzheimer's disease in this population.

Keywords: Alzheimer’s disease; Down syndrome; beta-amyloid; inflammation; microglia.


Figures

Figure 1
Figure 1
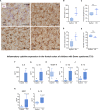
Microglial morphological changes and increased inflammatory cytokine expression in the frontal cortex of children with Down syndrome.Top: (AE) Microglial cells from children (1–10 years) were detected by immunohistochemistry against the monocytic marker Iba-1 (brown). Cresyl violet (CV) staining was used to identify cortical laminae. (A) Representative micrographs of control (euploid) and Down syndrome (T21) cases (1–10 years old). Control microglia displayed thin and ramified processes which are indicative of a physiological surveying state. Down syndrome microglia displayed a reactive phenotype reflective of intermediate activation. (B) Microglia from children with Down syndrome displayed an increase in soma size, t(6) = 4.15, P = 0.006. (C) Microglial process length did not differ between control and Down syndrome cases, t(6) = 1.82, P = 0.11. (D) An increase in the soma size-to-cell ratio was found in children with Down syndrome compared to controls, t(6) = 3.40, P = 0.01. (E) No significant differences were found in the number of microglia in children with Down syndrome compared to controls, t(6) = 1.50; P = 0.18. Euploid n =6, T21 n =3. Bottom: Increased levels (pg/ml) of (F) IL-8 (U = 0, P = 0.002) and (G) IL-10 (U = 4, P = 0.03) and decreased levels of (H) VEGF-A, t(12) = 3.764, P = 0.002, were observed in the frontal cortex of children with Down syndrome (1–13 years old), as examined by a multiplex protein electrochemiluminescent assay. A trend towards an increase of (I) IL-1β; U = 6; P = 0.05 (J) IL-13; t(12) = 2.02, P =0.06; (K) MDC; U = 9, P =0.06 and (L) IL-15; t(13) = 1.97, P = 0.07, was also noted in the Down syndrome group. Euploid n =10, T21 n =5. (BG, I and K) Two-tailed Mann-Whitney test and (H, J and L), two-tailed unpaired Student's t-test. Data are displayed in box plots where the box represents the interquartile interval in which the upper and bottom ends of the box represent the third and the first quartile, respectively. The horizontal line in the box represents the median. The vertical lines or whiskers extending from the box represent the minimum and maximum values in the dataset. Full circles represent outliers according to Tukey’s rule. Scale bar = 50 μm. *P < 0.05, **P < 0.01. n.s. = not significant.
Figure 2
Figure 2
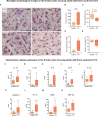
The frontal cortex of young adults with Down syndrome displays an exacerbated inflammatory profile.Top: (A) Microglial cells from young individuals (15–25 years old) as revealed by immunohistochemistry against Iba-1 and cresyl violet (CV) counterstain. (B) Microglial soma size did not differ between Down syndrome and control groups, t(8) = 1.843, P = 0.10; however, half of Down syndrome cases displayed an increase in soma size. (C) A trend towards a smaller process length was observed in young individuals with Down syndrome compared to controls, t(8) = 2.23, P = 0.05. (D) Young adults with Down syndrome display an increase in their soma size-to-process length ratio, t(8) = 2.373, P = 0.04. (E) The number of microglial cells remained unchanged at this age, t(8) = 0.94, P = 0.37). CF = counting frame. Euploid n =7, T21 n =4. Bottom: Multiplex protein electrochemiluminescent assays revealed that young adults with Down syndrome (13–27 years old) display an upregulation of inflammatory markers (pg/ml) before the development of a full-blown Alzheimer’s disease pathology (FN). (F) U = 29, P = 0.03; (G) U = 24, P = 0.01; (H) U = 25, P = 0.02; (I) t(24) = 3.13, P = 0.004; (J) t(27) = 2.49, P = 0.01; (K) t(28) = 3.22, P = 0.003; (L) t(27) = 4.51, P = 0.0001, (M) U = 25, P = 0.01; (N) U = 25, P = 0.02. Euploid n =24, T21 n =6. (BE and IL) Two-tailed unpaired Student's t-test; (FH, M and N) two-tailed Mann-Whitney test. Data are displayed in box plots where the box represents the interquartile interval in which the upper and bottom ends of the box represent the third and the first quartile, respectively. The horizontal line in the box represents the median. The vertical lines or whiskers extending from the box represent the minimum and maximum values in the dataset. Full circles represent outliers according to Tukey’s rule. Scale bar = 50 μm. *P < 0.05, **P < 0.01, ***P < 0.001. n.s. = not significant.
Figure 3
Figure 3
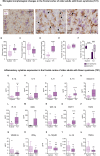
Dystrophic microglia and waning of neuroinflammation in older adults with Down syndrome.Top: (A) Representative photomicrographs of euploid and Down syndrome microglia (30–64 years old) as revealed by immunohistochemical assessment of Iba-1, cresyl violet (CV) was used as counterstain. (A) Dystrophic microglia from Down syndrome cases (middle and right micrographs) display spheroidal swellings and process beading (arrowheads), and fragmentation (arrows). (B) An increase in microglial soma size was noted in the Down syndrome cases, t(15) = 2.83, P = 0.01. (C) Down syndrome microglia displayed a decreased process length, t(15) = 2.60, P = 0.01. (D) The soma size-to-process length ratio was increased in microglia from adults with Down syndrome, t(15) = 5.40, P < 0.0001. (E) Total microglial cell number did not differ between Down syndrome and control groups, t(15) = 1.79, P = 0.09. (F) An increase of dystrophic microglia compared to non-dystrophic cells was observed in the Down syndrome group Accompanied by a decrease in non-dystrophic microglia compared to controls. Two-way ANOVA, effect of karyotype, F(1,30) = 0.42, P = 0.51, effect of morphology, F(1,30) = 6.22, P = 0.01, karyotype × morphology interaction, F (1,30) = 79.33 P < 0.0001 followed by Tukey’s post hoc test (T21 non-dystrophic versus T21 dystrophic, P =0.0007; Euploid non-dystrophic versus T21 non-dystrophic, P < 0.0001). Euploid n =10, T21 n =8. Bottom: (GU) Analysis of frontal cortex homogenates by multiplex protein electrochemiluminescent assays revealed an increase in inflammatory expression (pg/ml) in (GP), along with a decrease of inflammatory mediators in adults with Down syndrome (39–68 years old) (QU). (G) U = 35, P < 0.0001; (H) U = 82, P = 0.01; (I) U = 72, P = 0.005; (J) t(37) = 4.73, P < 0.0001; (K) U = 70, P = 0.008; (L) t(34) = 3.48, P = 0.001; (M) U = 51.5, P = 0.0004; (N) U = 117, P = 0.04; (O) U = 34, P < 0.0001; (P) U = 57, P = 0.0005; (Q) U = 63.5, P = 0.0004; (R) t(36) = 2.59, P = 0.01; (S) U = 74, P = 0.001; (T) t(36) = 2.87, P < 0.006; (U) t(35) = 2.72, P = 0.009. (AE, J, L, R, T and U) Two-tailed unpaired Student's t-test; (GI, K, MP and R) two-tailed Mann Whitney tests. Euploid n =16, T21 n =22. Data are displayed in box plots where the box represents the interquartile interval in which the upper and bottom ends of the box represent the third and the first quartile, respectively. The horizontal line in the box represents the median. The vertical lines or whiskers extending from the box represent the minimum and maximum values in the dataset. Full circles represent outliers according to Tukey’s rule. Scale bar = 50 μm. *P < 0.05, **P < 0.01, ***P < 0.001, ****P < 0.0001. CF = counting frame.
Figure 4
Figure 4
Adult females with Down syndrome display a more pronounced cortical inflammatory profile than males with Down syndrome. (A) T21 females have higher IL-6 levels when compared to T21 males (39–68 years old). Two-way ANOVA, effect of karyotype, F(1,30) = 7.03, P = 0.01, effect of sex, F(1,30) = 7.79, P = 0.009, sex × karyotype interaction, F(1,30) = 8.13 P = 0.007 followed by Tukey’s post hoc test (T21 females versus T21 males, P = 0.0009; T21 females versus euploid males, P = 0.001; and T21 females versus euploid females, P = 0.005; euploid females versus euploid males, P > 0.9999). (B) A significant increase in IL-8 levels was found in T21 females when compared to T21 males. Two-way ANOVA, effect of karyotype, F(1,29) = 15, P = 0.0005, effect of sex, F(1,29) = 10, P = 0.003, sex × karyotype interaction, F(1,29) = 1.7, P = 0.20 followed by Tukey’s post hoc test (T21 females versus T21 males, P = 0.004; T21 females versus euploid males, P < 0.0001; and T21 females versus euploid females; P = 0.009). (C) T21 females had higher levels of eotaxin-3 when compared to female and male euploids. Two-way ANOVA, effect of karyotype, F(1,31) = 10.85, P = 0.002, effect of sex, F(1,31) = 4.34, P = 0.04, sex × karyotype interaction, F(1,31) = 0.99, P = 0.32 followed by Tukey’s post hoc test (T21 females versus euploid females, P = 0.02; T21 females versus euploid males, P = 0.003). Data are displayed in box plots where the box represents the interquartile interval in which the upper and bottom ends of the box represent the third and the first quartile, respectively. The horizontal line in the box represents the median. The vertical lines or whiskers extending from the box represent the minimum and maximum values in the dataset. Full circles represent outliers according to Tukey’s rule. Euploid males n =9, euploid females n =7, T21 males n =12, T21 females n =10. *P < 0.05, **P < 0.01, ***P < 0.001, ****P < 0.0001.
Figure 5
Figure 5
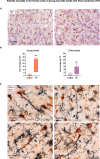
Rod shaped microglia in young and adult Down syndrome brains. (A) Micrographs depicting rod microglia (arrows) in the frontal cortex of a 19-year-old individual with Down syndrome (left) and a train of rod microglial cells (right) as revealed by immunohistochemistry (IHC) against the monocytic marker Iba-1 (brown). Cresyl violet (CV) was used as a counterstain. (B) Increased number of rod microglial cells in the brains of young adults [t(14) = 4.57; P = 0.0004, two-tailed unpaired Student's t-test] and older adults with Down syndrome (U = 36.50; P = 0.0002, two-tailed Mann Whitney t-test) as compared to euploid controls. Euploid young adults n =12; T21 young adults n =4; euploid adults n =17; T21 adults n =16. (C) IHC against Iba-1 (blue) and pathological tau as revealed by PHF-1 (brown) in the frontal cortex of a 53-year-old (top) and a 57-year-old (bottom) individual with Down syndrome. Note the close alignment of rod microglia to PHF+ neurons. Data are displayed in box plots where the box represents the interquartile interval in which the upper and bottom ends of the box represent the third and the first quartile, respectively. The horizontal line in the box represents the median. The vertical lines or whiskers extending from the box represent the minimum and maximum values in the dataset. PHF = paired helical filament. Scale bar = 50 μm. ***P < 0.001.
Figure 6
Figure 6
Neuroinflammation is exacerbated before the development of overt Alzheimer’s disease pathology in Down syndrome. (A) IL-6 levels where significantly higher in young adults (13–27 years old) with Down syndrome than in older adults with Down syndrome (39–68 years old). One-way ANOVA, F(2,27) = 4.34, P = 0.02, followed by Tukey’s post hoc test (young Down syndrome adults versus Down syndrome adults, P = 0.01). (B) The Down syndrome adult group showed higher levels of MCP-1 when compared to children with Down syndrome (1–10 years old). Kruskal-Wallis test, MCP-1 H = 8.74, P = 0.01 followed by Dunn’s post hoc test (T21 children versus T21 adults, P = 0.009). (CE) IL-10, TNFα and IFNγ expression levels were higher in children with Down syndrome than in the Down syndrome adult group. Kruskal-Wallis test followed by Dunn’s post hoc test, IL-10 H = 10.64, P = 0.004; T21 children versus T21 adults, P = 0.004; TNFα H = 9.01, P = 0.01; T21 children versus T21 adults, P = 0.01; IFNγ H = 6.84, P = 0.03; T21 children versus T21 adults, P = 0.02. Data are displayed in box plots where the box represents the interquartile interval in which the upper and bottom ends of the box represent the third and the first quartile, respectively. The horizontal line in the box represents the median. The vertical lines or whiskers extending from the box represent the minimum and maximum values in the data. Full circles represent outliers according to Tukey’s rule. The fold change was calculated by normalizing each age group to its own age-matched control. Dotted line represents age-matched control levels. A = adults; C = children; YA = young adults. T21 children, n =4; T21 young adults, n =6; T21 adults, n =20. *P < 0.05, **P < 0.01.
Figure 7
Figure 7
PLS-DA for cytokine expression in individuals with Down syndrome and age-matched controls. The plots display cytokine data after PLS-DA in (A) children, (B) young adults, and (C) older adults with Down syndrome and their age-matched controls. Left: Scores plots representing the scores for each observation on principal component (PC)1 and PC2 (t1 and t2). Scores plots are useful to determine whether there is clustering of observations. The Hotelling ellipse represents the 95% confidence interval for the model. Right: The loadings for each cytokine representing the contribution of each cytokine to PC1 and PC2 (p1 and p2). The cytokines contributing most to the model (three extreme values) are displayed in black while those with a minimal contribution are highlighted in grey. Blue circles: euploids or controls; brown triangles: T21 or Down syndrome.
Figure 8
Figure 8
Schematic representation of the evolution of brain inflammation across the lifespan in Down syndrome. Early microglial morphological changes such as increased soma size as well as increases in rod microglia, accompanied by a heightened neuroinflammatory profile, were observed in children and young individuals with Down syndrome (as represented by the schematic illustrations), at stages when limited or no Alzheimer’s disease pathology is present. The late inflammatory process in Down syndrome is characterized by microglial activation (increased soma size, shortened processes) and an increase in dystrophic microglia and chronic neuroinflammation along with a decrease in inflammatory marker expression possibly reflecting cell exhaustion and degeneration. Aβ = amyloid-β; AD = Alzheimer’s disease; NFT = neurofibrillary tangle. Modified image from Lott and Head (2019), with permission from SpringerNature.

References

    1. Abrahamson EE, Head E, Lott IT, Handen BL, Mufson EJ, Christian BT, et al.Neuropathological correlates of amyloid PET imaging in Down syndrome. Dev Neurobiol 2019; 79: 750–66. - PMC - PubMed
    1. Adaikkan C, Middleton SJ, Marco A, Pao PC, Mathys H, Kim DN, et al.Gamma entrainment binds higher-order brain regions and offers neuroprotection. Neuron 2019; 102: 929–43 e8. - PMC - PubMed
    1. Akiyama H, Barger S, Barnum S, Bradt B, Bauer J, Cole GM, et al.Inflammation and Alzheimer's disease. Neurobiol Aging 2000; 21: 383–421. - PMC - PubMed
    1. Arron JR, Winslow MM, Polleri A, Chang CP, Wu H, Gao X, et al.NFAT dysregulation by increased dosage of DSCR1 and DYRK1A on chromosome 21. Nature 2006; 441: 595–600. - PubMed
    1. Au NPB, Ma CHE.. Recent advances in the study of bipolar/rod-shaped microglia and their roles in neurodegeneration. Front Aging Neurosci 2017; 9: 310–25. - PMC - PubMed

Publication types

MeSH terms