

Impact of policy changes on the provision of naloxone by pharmacies in Ontario, Canada: a population-based time-series analysis
- PMID: 33207025
- PMCID: PMC8247272
- DOI: 10.1111/add.15324
Impact of policy changes on the provision of naloxone by pharmacies in Ontario, Canada: a population-based time-series analysis
Abstract
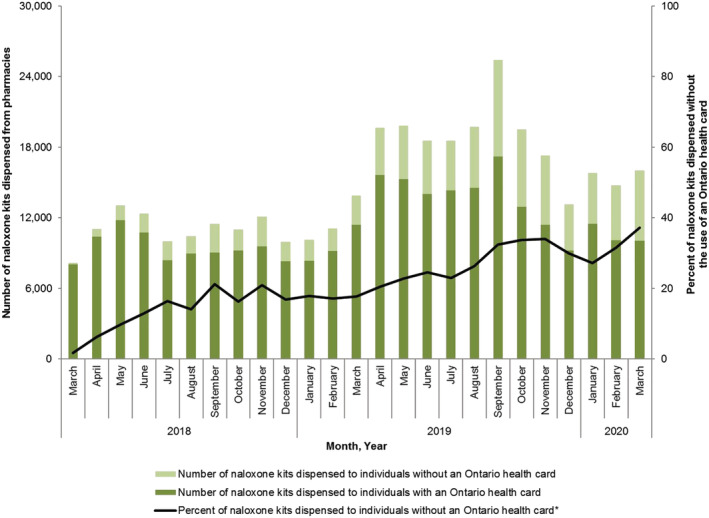
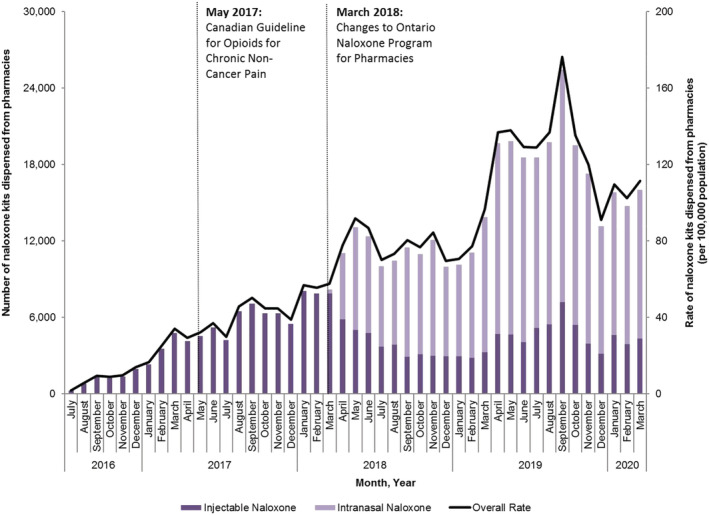
Background and aims: In June 2016, the Ontario, Canada government implemented the Ontario Naloxone Program for Pharmacies (ONPP), authorizing pharmacists to provide injectable naloxone kits at no charge to all Ontario residents. In March 2018, the program was amended to include intranasal naloxone and remove the requirement to present a government health card to the dispensing pharmacist. We examined whether these changes increased naloxone dispensing through the ONPP.
Design: Population-based time-series analysis using interventional autoregressive integrated moving average models.
Setting: Ontario, Canada.
Participants: All Ontario residents between 1 July 2016 and 31 March 2020.
Measurements: Monthly rates of pharmacy naloxone dispensing.
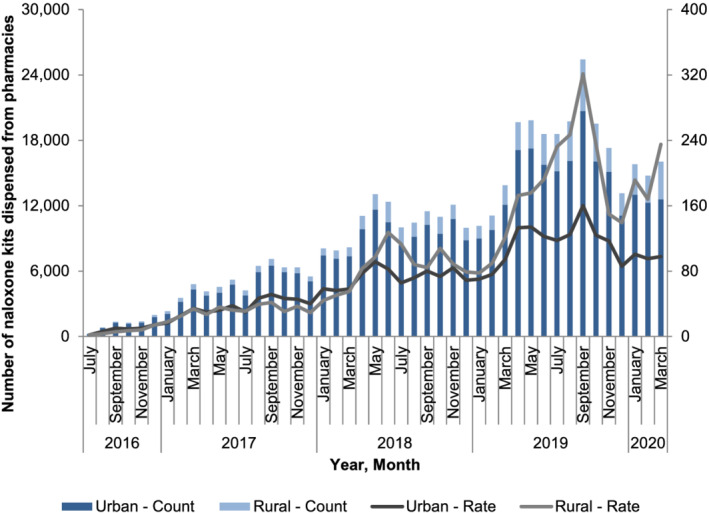
Findings: Overall, 199 484 individuals were dispensed a naloxone kit during the study period. In the main analysis, the rate of pharmacy naloxone dispensing increased by 65.1% following program changes (55.6-91.8 kits per 100 000 population between February 2018 and May 2018; P = 0.01). In subgroup analyses, naloxone dispensing increased among individuals receiving opioid agonist therapy (OAT) (3374.9-7264.2 kits per 100 000 OAT recipients; P = 0.04) among individuals receiving other prescription opioids (192.8-381.8 kits per 100 000 population prescribed opioids; P < 0.01), among individuals with past opioid exposure (134.7-205.6 kits per 100 000 population with past opioid exposure; P < 0.01) and in urban centers (56.2-91.4 kits per 100 000 population; P < 0.01). We did not observe a clear impact on pharmacy-dispensed naloxone to individuals with no or unknown opioid exposure (34.4-39.3 kits per 100 000 population with no/unknown opioid exposure; P = 0.42) and in rural regions (50.4-97.2 kits per 100 000 population; P = 0.09).
Conclusions: Changes to the Ontario Naloxone Program for Pharmacies to add intranasal naloxone and remove the requirement to present a government health card appeared to increase pharmacy-based naloxone dispensing uptake in Ontario, Canada, particularly among individuals at high risk of inadvertent opioid overdose.
Keywords: Drug policy; harm reduction; health services research; naloxone; opioid; policy evaluation.
© 2020 Her Majesty the Queen in Right of Canada. Addiction published by John Wiley & Sons Ltd on behalf of the Society for the Study of Addiction.
Figures

References
-
- Centers for Disease Control and Prevention . Provisional Drug Overdose Death Counts. Available at: https://www.cdc.gov/nchs/nvss/vsrr/drug‐overdose‐data.htm (accessed 20 January 2020).
-
- Government of Canada . Apparent Opioid‐Related Deaths: Surveillance of Opioid‐related Harms in Canada. Available at: https://health‐infobase.canada.ca/substance‐related‐harms/opioids/graphs... (accessed 17 August 2020).
-
- Gomes T., Juurlink D. N. Understanding the implications of a shifting opioid landscape in Ontario. Healthcare Q 2019; 22: 6–11. - PubMed
-
- Ontario Agency for Health Protection and Promotion (Public Health Ontario), Office of the Chief Coroner Ontario Forensic Pathology Service, Ontario Drug Policy Research Network . Opioid mortality surveillance report: analysis of opioid‐related deaths in Ontario July 2017–June 2018. Toronto, Ontario: Public Health Ontario; 2019.
Publication types
MeSH terms
Substances
Grants and funding
LinkOut - more resources
Full Text Sources
Other Literature Sources
Medical
Miscellaneous
