

Characterization of Regional Poison Center Utilization Through Geospatial Mapping
- PMID: 33207173
- PMCID: PMC7673882
- DOI: 10.5811/westjem.2020.7.46385
Characterization of Regional Poison Center Utilization Through Geospatial Mapping
Abstract
Introduction: Penetrance is the annual rate of human exposure calls per 1000 persons, a measure that historically describes poison center (PC) utilization. Penetrance varies by sociodemographic characteristics and by geography. Our goal in this study was to characterize the geospatial distribution of PC calls and describe the contribution of geospatial mapping to the understanding of PC utilization.
Methods: This was a single-center, retrospective study of closed, human, non-healthcare facility exposure calls to a regional PC over a five-year period. Exposure substance, gender, age, and zone improvement plan (ZIP) Code were geocoded to 2010 US Census data (household income, educational attainment, age, primary language) and spatially apportioned to US census tracts, and then analyzed with linear regression. Penetrance was geospatially mapped and qualitatively analyzed.
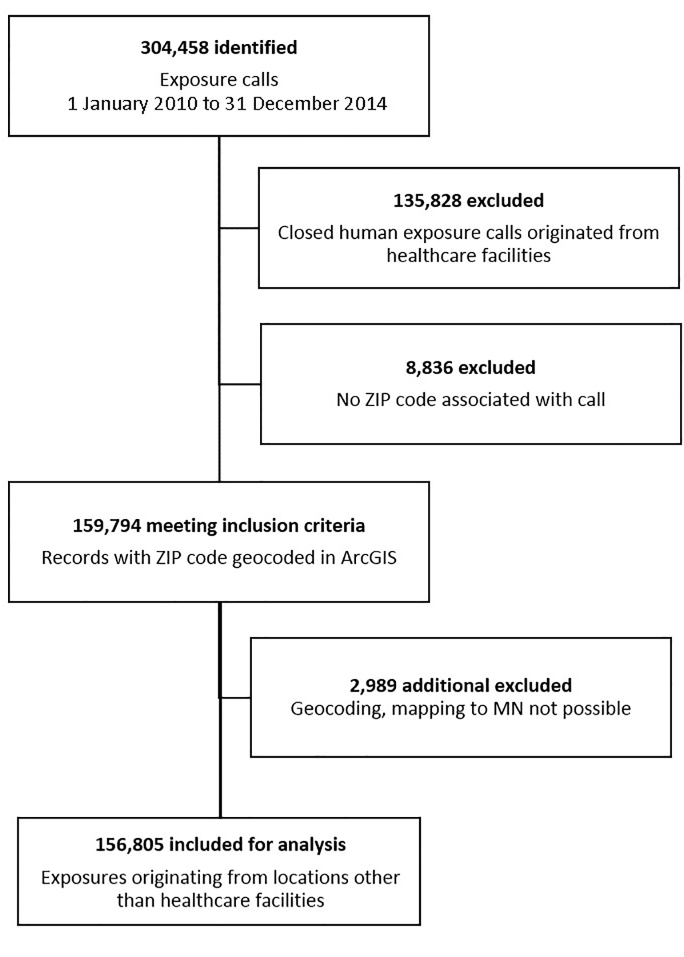
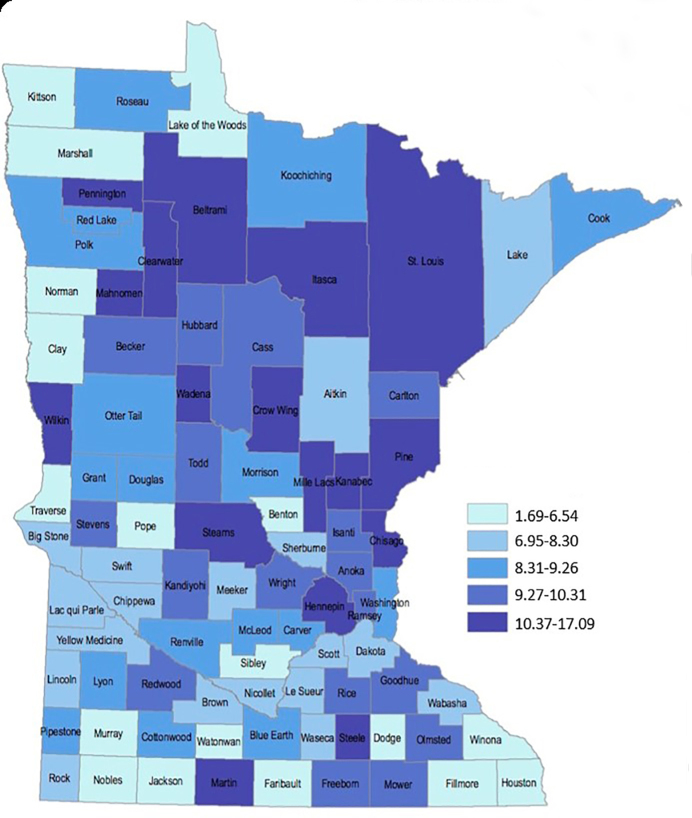
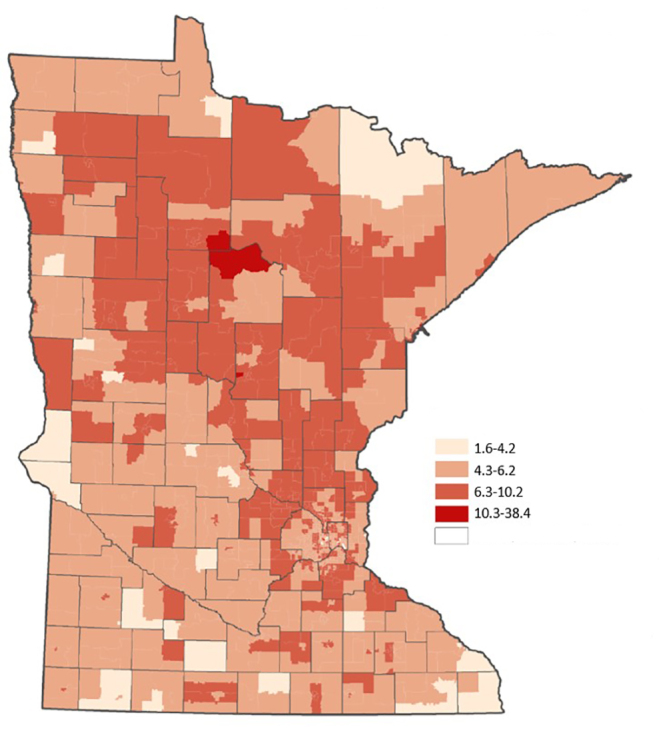
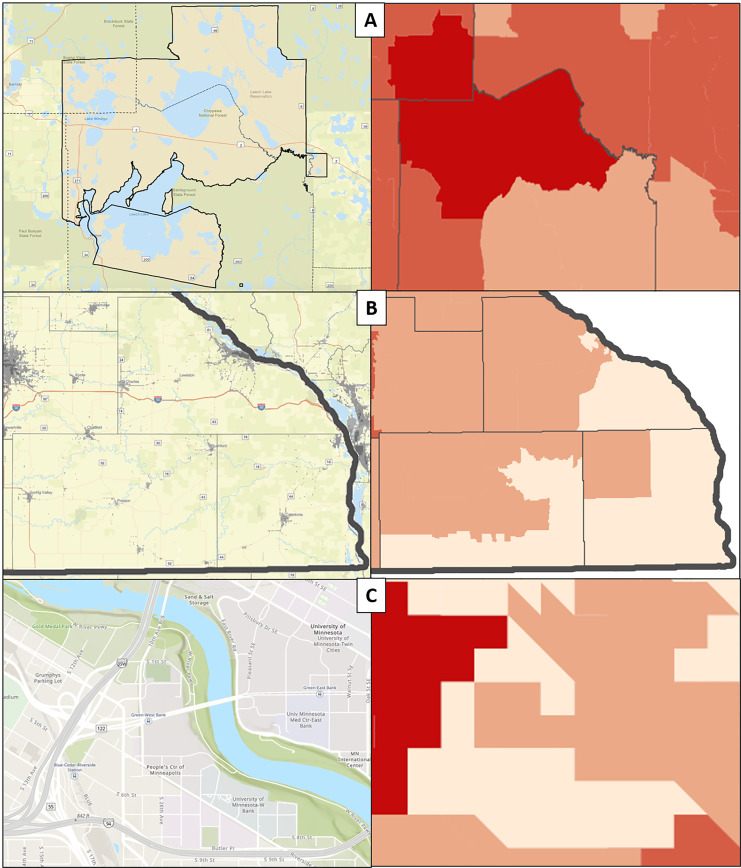
Results: From a total of 304,458 exposure calls during the study period, we identified 168,630 non-healthcare exposure calls. Of those records, 159,794 included ZIP Codes. After exclusions, we analyzed 156,805 records. Penetrance ranged from 0.081 - 38.47 calls/1000 population/year (median 5.74 calls/1000 persons/year). Regression revealed positive associations between >eighth-grade educational attainment (β = 5.05, p = 0.008), non-Hispanic Black (β = 1.18, p = 0.032) and American Indian (β = 3.10, p = 0.000) populations, suggesting that regions with higher proportions of these groups would display greater PC penetrance. Variability explained by regression modelling was low (R2 = 0.054), as anticipated. Geospatial mapping identified previously undocumented penetrance variability that was not evident in regression modeling.
Conclusion: PC calls vary substantially across sociodemographic strata. Higher proportions of non-Hispanic Black or American Indian residents and >eighth-grade educational attainment were associated with higher PC call penetrance. Geospatial mapping identified novel variations in penetrance that were not identified by regression modelling. Coupled with sociodemographic correlates, geospatial mapping may reveal disparities in PC access, identifying communities at which PC resources may be appropriately directed. Although the use of penetrance to describe PC utilization has fallen away, it may yet provide an important measure of disparity in healthcare access when coupled with geospatial mapping.
Conflict of interest statement
Figures
References
-
- Gummin DD, Mowry JB, Spyker DA, et al. 2016 Annual Report of the American Association of Poison Control Centers’ National Poison Data System (NPDS): 34th Annual Report. Clin Toxicol (Phila) 2017;55(10):1072–252. - PubMed
-
- Miller TR, Lestina DC. Costs of poisoning in the United States and savings from poison control centers: a benefit-cost analysis. Ann Emerg Med. 1997;29(2):239–45. - PubMed
-
- Friedman LS, Krajewski A, Vannoy E, et al. The association between U.S. poison center assistance and length of stay and hospital charges. Clin Toxicol. 2014;42(3):198–206. - PubMed
-
- Litovitz T, Benson BE, Youniss J, et al. Determinants of U.S. poison center utilization. Clin Toxicol. 2010;48(5):449–57. - PubMed
Publication types
MeSH terms
LinkOut - more resources
Full Text Sources
Medical
Miscellaneous