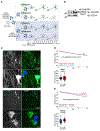
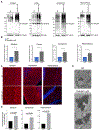
. 2020 Dec 3;80(5):779-795.e10.
doi: 10.1016/j.molcel.2020.10.041. Epub 2020 Nov 17.

Loss of TAX1BP1-Directed Autophagy Results in Protein Aggregate Accumulation in the Brain

Affiliations

Loss of TAX1BP1-Directed Autophagy Results in Protein Aggregate Accumulation in the Brain

Shireen A Sarraf et al. Mol Cell. .

Erratum in

Abstract

Protein aggregates disrupt cellular homeostasis, causing toxicity linked to neurodegeneration. Selective autophagic elimination of aggregates is critical to protein quality control, but how aggregates are selectively targeted for degradation is unclear. We compared the requirements for autophagy receptor proteins: OPTN, NBR1, p62, NDP52, and TAX1BP1 in clearance of proteotoxic aggregates. Endogenous TAX1BP1 is recruited to and required for the clearance of stress-induced aggregates, whereas ectopic expression of TAX1BP1 increases clearance through autophagy, promoting viability of human induced pluripotent stem cell-derived neurons. In contrast, TAX1BP1 depletion sensitizes cells to several forms of aggregate-induced proteotoxicity. Furthermore, TAX1BP1 is more specifically expressed in the brain compared to other autophagy receptor proteins. In vivo, loss of TAX1BP1 results in accumulation of high molecular weight ubiquitin conjugates and premature lipofuscin accumulation in brains of young TAX1BP1 knockout mice. TAX1BP1 mediates clearance of a broad range of cytotoxic proteins indicating therapeutic potential in neurodegenerative diseases.

Keywords: Huntington’s disease; OPTN; aggregate; aggrephagy; autophagy receptor; p62; proteostasis; proteotoxic stress; selective autophagy; ubiquitin.


Conflict of interest statement

Declaration of Interests The authors declare no competing interests.

Figures

Figure 1.
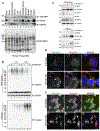
Figure 1.. TAX1BP1 Depletion Impairs Clearance of Protein Aggregates
(A) Validation of knockout cell lines. (B) Experimental outline for assessing aggregate formation and clearance. (C) WT or individual knockouts for p62, NBR1, NDP52, OPTN, and TAX1BP1 cell lines exposed to 5 μg/mL puromycin for 2 h were either fixed for imaging or washed and followed for a further 3 h in full media as in (B); scale bar represents 10 μm. (D and F) Quantification of (C): percent of cells containing Ub-positive foci was assessed in ~200 cells per condition at 2 h puromycin (D) or 2 h puromycin followed by 3 h washout (F). Quantification displayed as mean ± SD from three independent experiments using one-way ANOVA test (**p < 0.01, ***p < 0.001, ****p < 0.0001) comparing all to WT and Tukey’s post hoc test. (E and G) WT-normalized comparisons of foci formation and clearance in autophagy receptor knockout cell lines. (H) WT or TAX1BP1 KO cells were exposed to 100 nM Bafilomycin A or 1 μM MG132 for 5 h then fixed for imaging. (I) Quantification of (H): percent of cells containing Ub-positive foci was assessed in ~200 cells per condition. Quantification displayed as mean ± SD from three independent experiments using one-way ANOVA test, (****p < 0.0001) comparing all to WT and Tukey’s post hoc test. (J) WT or TAX1BP1 KO cells pulsed with 5 μg/mL puromycin and 15 μM cycloheximide as indicated, then chased/harvested at the indicated time points and immunoblotted for puromycin or GAPDH (loading control). (K) Quantification of (J) determined by densitometry, normalized first to GAPDH and subsequently to untreated condition for each cell line. Quantification displayed as mean ± SD from three independent experiments using two-way ANOVA test (**p < 0.01, ***p < 0.001, ****p < 0.0001) and Tukey’s post hoc test. All blots and microscopy images are representative of at least three independent experiments.
Figure 2.
Figure 2.. TAX1BP1 Protein Responds to Proteotoxic Stress and Associates with Insoluble Protein in Neurons
(A) Human tissue panel probed for TAX1BP1, OPTN, or NDP52. (B) Primary rat cortical neurons were treated with the indicated amounts of MG132 for 8 or 18 h, fractionated into RIPA-soluble or -insoluble fractions, and immunoblotted for total Ub. (C) Fractionated primary rat cortical neurons treated as in (B) were blotted for the indicated proteins. (D) Primary rat cortical neurons were treated with 1 μM MG132 for18h, after which cells were fixed for imaging and stained with antibodies for TAX1BP1 and Ub; scale bar represents 5 μm. Larger fields of view in Figure S3D. (E) Neurons derived from human induced pluripotent stem cells (iPSCs) treated with 1 μM MG132 for 18 h, fixed and stained with antibodies targeting TAX1BP1 and Ub; scale bar represents 20 μm. All blots and images are representative of at least three independent experiments. Larger fields of view in Figure S3E.
Figure 3.
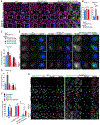
Figure 3.. TAX1BP1 Mediates Aggregate Clearance
(A) WT, TAX1BP1 KO, and TAX1BP1 KO stably expressing GFP-TAX1BP1 were exposed to 5 μg/mL puromycin for 2 h, then fixed for imaging or washed and followed for a further 3 h in full media; scale bar represents 10 μm. (B) Quantification of (A): percent of cells containing Ub-positive foci was assessed in ~200 cells per condition. Quantification displayed as mean ± SD from three independent experiments using one-way ANOVA test (****p < 0.0001) and Tukey’s post hoc test. (C and D) Stably expressing TAX1BP1 rescue lines were created with N-FLAG or C-FLAG tag at high (H) or low (L) expression levels (see Figures S4A and S4B) and exposed to 5 μg/mL puromycin for 2 h, then either fixed for imaging (C) or washed and followed for 3 h in full media (D) and quantified as in (B). Quantification displayed as mean ± SD from three independent experiments using one-way ANOVA test (***p < 0.001, ****p < 0.0001) comparing all to WT and Tukey’s post hoc test. (E) WT, TAX1BP1 KO, or TAX1BP1 KO + FLAG-TAX1BP1 (H) lines were exposed to 5 μg/mL puromycin in the presence or absence of 100 nM Bafilomycin A, then fixed for imaging or washed and followed for 3 h in full media or in media containing Bafilomycin A. Larger fields of view in Figure S4C. (F) Quantification of (E): percent of cells containing Ub-positive foci was assessed in ~200 cells per condition in three independent experiments. Quantification displayed as mean ± SD from three independent experiments using two-way ANOVA test, (****p < 0.0001). All images are representative of at least three independent experiments. (G) WT and TAX1BP1 KO cell lines stably expressing EGFP-LC3C were exposed to 5 μg/mL puromycin for 2 h in the presence or absence of 1 mM ULK1 inhibitor or 100 nM Bafilomycin A, after which cells were either fixed for imaging or washed and followed for 3 h in full media in the presence or absence of ULK1 inhibitor or Bafilomycin A; scale bar represents 10 μm.
Figure 4.
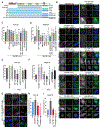
Figure 4.. Requirements for TAX1BP1 Domains in Aggrephagy
(A) TAX1BP1 truncation or point mutations used in this study. (B) i–x, TAX1BP1 KO and TAX1BP1 KO with stable expression of TAX1BP1 mutants exposed to 5 μg/mL for 2 h were either fixed for imaging or washed and followed for a further 3 h in full media; scale bar represents 10 μm. Larger fields of view in Figure S7A. (C and D) Quantification of Ub-foci formation (C) or clearance (D) observed in (B). (E and F) Quantification of Ub-foci formation (E) or clearance (F) observed in TKO (OPTN/NDP52/TAX1BP1) ceils treated as in (B). See Figure S7B for images. (G) WT cells stably expressing high levels of FLAG-TAX1BP1 exposed to 5 μg/mL puromycin for 2 h were either fixed for imaging or washed and followed for 3 h in full media; scale bar represents 10 μm. (H and I) Quantification of Ub-foci formation (H) or clearance (I) observed in (G) and in Figure S7C. All images are representative of at least three independent experiments in which percent of cells containing Ub-positive foci was assessed in ~200 cells per condition. All quantification displayed as mean ± SD from three independent experiments using one-way ANOVA test comparing to WT (*p < 0.05, **p < 0.01, ***p < 0.001, ****p < 0.0001) and Tukey’s post hoc test.
Figure 5.
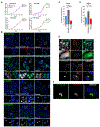
Figure 5.. TAX1BP1 Mediates Aggrephagy of Cytotoxic Aggregation-Prone Proteins
(A) WT, TAX1BP1 KO, or TAX1BP1 KO cells with stably expressed TAX1BP1 rescue were exposed to proteotoxic stressors as indicated on day 1 and followed for 6 days during which viability was measured by quantification of ATP production. Relative viability represents normalized luminescence displayed as mean ± SD from three independent experiments; significance was assessed using two-way ANOVA test (****p < 0.0001, ***p < 0.001, **p<0.01, *p< 0.05) with Tukey’s post hoc test. p values and normalized viability measurements shown on graphs are for day 6 comparisons. (B) WT, TAX1BP1 KO, or rescue cells uninfected or infected with viruses expressing HttQ23-EGFP, HttQ74-EGFP, or HttQ103-EGFP were assessed for aggregate count 4 days post-infection. (C) Quantification of HttQ74-EGFP aggregates observed in (B). Quantification is displayed as mean ± SD from three independent experiments using one-way ANOVA test (*p < 0.05, **p < 0.01, ****p < 0.0001) and Tukey’s post hoc test. (D) Quantification of HttQ103-EGFP aggregates observed in (B), percent of cells containing GFP-positive foci was assessed in ~200 cells per condition in three independent experiments. Quantified as in (C). (E) Immunofluorescence labeling of endogenous TAX1BP1 in cells infected with HttQ23-EGFP or HttQ103-EGFP. Maximum intensity projections shown. (F) A single 1-μm slice of immunofluorescence labeling of endogenous TAX1BP1 in cells infected with HttQ103-EGFP as in (E). Scale bars represent 10 μm. All images are representative of at least three independent experiments.
Figure 6.
Figure 6.. TAX1BP1 Overexpression Preserves Viability in iPSC-Derived Neurons Exposed to Cytotoxic Aggregation-Prone Proteins
(A) iPSCs were transduced with viruses encoding NLS-BFP, sorted, and transduced with viruses encoding HA-TAX1BP1, followed by puromycin selection. WTiPSCs expressing NLS-BFP with/without HA-TAX1BP1 were transduced with viruses encoding HttQ23-EGFP or HttQ103-EGFP for 24 h, allowed to recover for 24 h, then treated with doxycycline to induce differentiation. Viability was assessed daily for 14 days via imaging of NLS-BFP and quantification of total cell number per well. (B) Immunoblot confirming TAX1BP1 stable overexpression in iPSCs. (C) NLS-BFP-expressing WT or TAX1BP1-overexpressing iPSC-derived neurons infected with viruses expressing either HttQ23-EGFP or HttQ103-EGFP. (D and E) Graphs show line fitted to the number of BFP-positive nuclei counted daily for iPSC-derived neurons with/without stable TAX1BP1 overexpression infected with HttQ23-EGFP (D) or HttQ103-EGFP (E). Ribbon represents 95% confidence interval around the fitted line. Beeswarm boxplots compare survival scores determined by performing permutation analysis using the means of all slopes(center line = median, box limits = first to third quartile, whiskers = minimum and maximum).
Figure 7.
Figure 7.. TAX1BP1 KO Mice Accumulate Ubiquitin and Lipofuscin in Multiple Brain Regions
(A) Representative immunoblots of total Ub and loading controls in lysate from striatum, cerebellum, cortex, or hippocampus of 35–38-week-old WT and TAX1BP1 ΔZF mice. (B) Quantification of total Ub signal normalized to loading control displayed as mean ± SEM.; significance was assessed using two-tailed Welch’s t test (**p < 0.01, *p < 0.05). (C) Representative images of lipofuscin deposits (red puncta) in WT and TAX1BP1 ΔZF mouse striatum, cerebellum, or hippocampus sections imaged used 555 nm autofluorescence. Nuclei stained with DAPI. Scale bars represent 10 μm. (D) Quantification of normalized counts of lipofuscin punctae per 500 μm2 displayed as mean ± SEM; significance was assessed using two-tailed Welch’s t test (*p < 0.05). (E) Representative image of electron-dense storage material in postmortem cortical tissue from TAX1BP1 ΔZF mouse brain. Scale bars represent 200 nm.

Similar articles

Cited by

References

    1. Ashe KH, and Zahs KR (2010). Probing the biology of Alzheimer’s disease in mice. Neuron 66, 631–645. - PMC - PubMed
    1. Balchin D, Hayer-Hartl M, and Hartl FU (2016). In vivo aspects of protein folding and quality control. Science 353, aac4354. - PubMed
    1. Barmada SJ, Skibinski G, Korb E, Rao EJ, Wu JY, and Finkbeiner S (2010). Cytoplasmic mislocalization of TDP-43 is toxic to neurons and enhanced by a mutation associated with familial amyotrophic lateral sclerosis. J. Neurosci 30, 639–649. - PMC - PubMed
    1. Barmada SJ, Serio A, Arjun A, Bilican B, Daub A, Ando DM, Tsvetkov A, Pleiss M, Li X, Peisach D, et al. (2014). Autophagy induction enhances TDP43 turnover and survival in neuronal ALS models. Nat. Chem. Biol 10, 677–685. - PMC - PubMed
    1. Bennett EJ, Bence NF, Jayakumar R, and Kopito RR (2005). Global impairment of the ubiquitin-proteasome system by nuclear or cytoplasmic protein aggregates precedes inclusion body formation. Mol. Cell 17,351–365. - PubMed

Publication types

MeSH terms