. 2020 Nov 17;33(7):108381.
doi: 10.1016/j.celrep.2020.108381.

Inflammasomes within Hyperactive Murine Dendritic Cells Stimulate Long-Lived T Cell-Mediated Anti-tumor Immunity

Affiliations

Inflammasomes within Hyperactive Murine Dendritic Cells Stimulate Long-Lived T Cell-Mediated Anti-tumor Immunity

Dania Zhivaki et al. Cell Rep. .

Abstract

Central to anti-tumor immunity are dendritic cells (DCs), which stimulate long-lived protective T cell responses. Recent studies have demonstrated that DCs can achieve a state of hyperactivation, which is associated with inflammasome activities within living cells. Herein, we report that hyperactive DCs have an enhanced ability to migrate to draining lymph nodes and stimulate potent cytotoxic T lymphocyte (CTL) responses. This enhanced migratory activity is dependent on the chemokine receptor CCR7 and is associated with a unique transcriptional program that is not observed in conventionally activated or pyroptotic DCs. We show that hyperactivating stimuli are uniquely capable of inducing durable CTL-mediated anti-tumor immunity against tumors that are sensitive or resistant to PD-1 inhibition. These protective responses are intrinsic to the cDC1 subset of DCs, depend on the inflammasome-dependent cytokine IL-1β, and enable tumor lysates to serve as immunogens. If these activities are verified in humans, hyperactive DCs may impact immunotherapy.

Keywords: CD8+ T cells; IL-1β; anti-tumor immunity; dendritic cells; hyperactivation; inflammasomes; pyroptosis.


Conflict of interest statement

Declaration of Interests J.C.K. holds equity and consults for IFM Therapeutics, Quench Bio, and Corner Therapeutics. A.K.S. reports compensation for consulting and/or SAB membership from Merck, Honeycomb Biotechnologies, Cellarity, Repertoire Immune Medicines, Orche Bio, and Dahlia Biosciences. D.Z. holds equity and consults for Corner Therapeutics. Boston Children’s Hospital has filed patents related to the use of hyperactivating stimuli and hyperactive DCs in the treatment of disease. J.C.K. serves on the advisory board of Cell Reports.

Figures

Figure 1.
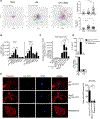
Figure 1.. Oxidized Phospholipids Induce a State of Hyperactivation in cDC1s and cDC2s
(A and B) BMDCs, cDC1s, or cDC2s (as indicated) were either left untreated (“None”) or treated with indicated stimuli. IL-1β and TNF-α release was monitored by ELISA. Cell death was measured by LDH release. Means and SDs from three replicates are shown, and data are representative of at least three independent experiments. (C) Immunofluorescence staining of phalloidin (green) and DAPI (blue) for cDC1s. Scale bars: 10 μm (upper panel) and 20 μm (lower panel). (D) cDC1s and cDC2s were either left untreated (“None”) or treated as indicated prior to RNA sequencing (n = 3 mice). Shown is the expression of mouse Gene Ontology modules. Color of dot represents the average relative increase or decrease of log-normalized expression from randomized modules of same number genes. Size of dot shows percent of module expressed by samples. p values of < 0.05 (*), < 0.01 (**), < 0.001 (***), or, ≤ 0.0001 (****) are indicated.
Figure 2.
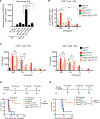
Figure 2.. Hyperactive cDCs Display a Hypermigratory Phenotype
(A) FLT3L-derived BMDCs were either left untreated or treated with indicated stimuli. Spider plots depict individual cell trajectories from an origin point (0;0) from four regions of interest. Each trajectory line represents one cell (n = 30–50 cells). Straightness index and mean velocity were calculated (right panels). (B) cDC1s or cDC2s were either left untreated or treated as indicated. The mean fluorescence intensity (MFI) of surface CCR7 (among CD11c+ live cells) was measured by flow cytometry. Means and SDs from three replicates are shown, and data are representative of at least three independent experiments. (C) The absolute number of CD45.2+ CFSE+ among CD11c+ live cells was calculated by flow cytometry. Means and SDs from five mice are shown, and data are representative of at least three independent experiments. (D and E) Hyperactive DCs that migrated to the skin dLN were sorted as CD11c+ CD45.2+ CFSE+ live cells. Alternatively, resident myeloid cells from the skin dLN were sorted as CD11c+ CD45.1+ CFSEneg live cells. (D) Cells were cultured in media for 24 h, and IL-1β and LDH release were measured. Means and SDs from three independent experiments are shown. (E) DCs were stained with the markers indicated and examined by confocal microscopy. Scale bar: 5 μm on representative images (left panel). Quantification of the percent of cells containing ASC specks (right panel). DCx: DC injection. In (C)–(E), BMDCs were either left untreated or treated with the stimuli indicated. Cells were stained with CFSE and injected subcutaneously into CD45.1 mice. At 15–18 h post-DC injection, skin dLNs were dissected. p values of < 0.05 (*), < 0.01 (**), < 0.001 (***), or ≤ 0.0001 (****) are indicated.
Figure 3.
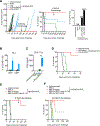
Figure 3.. Hyperactive DCs Potentiate CTL Responses in an Inflammasome-Dependent Manner
(A) FLT3L-DCs were either left untreated (DCNone) or treated as indicated. 1 × 10e6 live BMDCs were incubated with OVA protein and injected s.c. into mice. Seven days post-DC injection, the absolute number of SIINFEKL+ CD8+ T cells in the skin dLN was measured by flow cytometry. Means and SDs of five mice are shown. (B and C) WT mice were immunized with OVA protein. Seven days post-immunization, total CD8+ T cells were isolated from the spleen and co-cultured at a ratio of 10:1 with DCs pretreated with indicated stimuli. DCs were loaded with a serial dilution of OVA protein prior to co-culture. Five days post-coculture, supernatants were collected, and cells were stimulated with phorbol 12-myristate 13-acetate (PMA) and ionomycin in the presence of monensin for intracellular IFNγ staining. (B) The percentage of SIINFEKL+ IFNγ+ T cells was measured by flow cytometry. (C) IFNγ and IL-2 secretion was measured by ELISA. Means and SDs from three replicates are shown, and data are representative of at least two independent experiments. (D and E) Mice were injected s.c. on the upper right back with 3 × 10⁵ of B16OVA cells. Seven days post-tumor cell injection, 1 × 10⁶ of FLT3L-DCs of the genotypes indicated were treated as in (A) and incubated with B16OVA WTLs, then injected s.c. on the left flank into tumor-bearing recipient mice. Mice received two subsequent DC injections. The percentage of mice survival was measured (n = 5–6 mice per group, and n = 10 for WT DCLPS+PGPC). p values of < 0.05 (*), < 0.01 (**), < 0.001 (***), or ≤ 0.0001 (****) are indicated.
Figure 4.
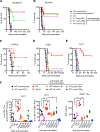
Figure 4.. Hyperactivating Stimuli Induce Robust CTL Responses
(A) Mice were injected s.c. on the right flank with OVA either alone or as indicated. Seven or 40 days post-immunization, T cells were isolated from the dLN. (A) The percentage of Teff cells as CD44lowCD62Llow, TEM cells as CD44hiCD62Llow, and TCM cells as CD44hiCD62Lhi are represented among CD3+ CD8+ live cells. (B and C) CD8+ T cells were sorted from the dLN 7 days post-immunization, then (B) treated either with PMA plus ionomycin, or co-cultured with B16OVA cells (target cells). CD8+ T cells degranulation was assessed by monitoring the percentage of CD107a+. (C) CD8+ T cells were cultured with BMDC loaded (or not) with a serial dilution of OVA protein starting from 1000 μg/ml. IFNγ secretion was measured by ELISA. Means and SDs of five mice are shown. (D) Seven days post-immunization, the percentage of Teff, TEM, TCM, and T naive cells in the skin dLN was measured by flow cytometry. (E) The percentage of SIINFEKL+ among CD8+ live T cells in the dLN (left panel) or in the spleen (right panel) was measured by flow cytometry. (F and G) Total CD8+ T cells were sorted from the dLN and (F) co-cultured with untreated BMDCs loaded (or not) with OVA for 7 days at a ratio of 1:10 (DC: T cell). IFNγ secretion was measured by ELISA. (G) CD8+ T cells were co-cultured with B16OVA cells (target cells) at ratio of 1:3 (effector: target). The percentage of LDH release was measured from B16OVA-CD8+ T cells co-culture and normalized to the LDH released from B16OVA cells or CD8+ T cells cultured separately. Means and SDs from five mice are shown. In (D)–(F), CD45.1 mice were irradiated then reconstituted with mixed BM of the genotypes indicated. Six weeks post-reconstitution, chimera mice were injected with DTx 3 times a week for a total of 9 DTx injections. Chimeric mice were then immunized s.c. on the right flank with OVA with LPS plus PGPC. p values of < 0.05 (*), < 0.01 (**), < 0.001 (***), or ≤ 0.0001 (****) are indicated.
Figure 5.
Figure 5.. Hyperactivating Stimuli Induce Durable Prophylactic Anti-tumor Immunity in an IL-1β-Dependent Manner
(A) Mice were injected s.c. on the right flank with PBS (unimmunized), with B16OVA cell WTLs alone (“None”), or with LPS, or B16OVA WTLs plus LPS and oxPAPC or PGPC. Fifteen days post-immunization, mice were challenged s.c. on the left upper back with 3 × 10⁵ of B16OVA cells. One hundred fifty days later, tumor-free mice were re-challenged s.c. with 5 × 10⁵ of B16OVA cells. (A) Tumor growth (left panel) and mice survival (middle panel) was monitored every 2 days. The percentage of tumor-free mice 300 days post-tumor inoculation is indicated (right panel) (n = 8–15 mice per group). (B and C) Tumors were harvested at the endpoint of tumor growth, and (B) the percentages of tumor infiltrating CD3+CD4+ and CD3+CD8+ T cells among CD45+ live cells were assessed by flow cytometry. (C) Tumor-infiltrating T cells were sorted then stimulated in the presence of anti-CD3 and anti-CD28 dynabeads. IFNγ release was measured by ELISA (n = 4 mice per group). (D) Mice were either left untreated (unimmunized) or were immunized s.c. on the right flank with B16OVA WTLs plus the stimuli indicated. Fifteen days post-immunization, mice were challenged with 3 × 10⁵ B16OVA cells s.c. on the left upper back. The percentage of survival is monitored every 2 days (n = 5 mice per group). (E and F) Mice were either left untreated (unimmunized) or were immunized s.c. on the right flank with B16OVA WTLs (E) or with (F) MC38OVA WTLs or OVA alone or in combination with the treatments indicated. Fifteen days post-immunization, mice were challenged with (E) 3 × 10⁵ of viable B16OVA cells or (F) 5 × 10⁵ MC38OVA cells s.c. on the left upper back. (E) Ninety days later, tumor-free mice were re-challenged with 5 × 10⁵ B16OVA cells s.c. on the back. (F) Fifty days later, tumor-free mice were re-challenged s.c. with 1 × 10⁶ MC38OVA cells. Survival was monitored every 2 days (n = 3–5 mice per group). P values of < 0.01 (**) is indicated.
Figure 6.
Figure 6.. Hyperactivating Stimuli Eradicate Established Tumors That Are Resistant to Checkpoint Inhibitors
Mice of the indicated genotypes were inoculated subcutaneously on the left upper back with (A) 5 × 10⁵ of MC38OVA cells, (B) 3 × 10⁵ B16OVA cells, (C) 3 × 10⁵ B16-F10 cells, (D) 3 × 10⁵ CT26 cells, or (E and F) 3 × 10⁵ LLC1 cells. In (A)–(E), when tumors reached 3–4 mm in size, mice were either left untreated (unimmunized) or were injected s.c. on the right flank with WTLs plus LPS and PGPC with or without neutralizing anti-IL-1β antibodies, anti-CD4, anti-CD8α antibodies, or (F) IL-RA. Mice received two boost injections with WTLs and LPS plus PGPC. In (B)–(E), alternatively, tumor-bearing mice were injected with anti-PD-1 antibody. The percentage of survival is indicated (n = 10–12 mice per group). In (F), LLC1 tumors were harvested at the endpoint of tumor growth. The percentage of CD8+ TILs (left panel) among CD3+CD45+ live cells and CD69+CD103+ TRM cells among CD8+ TILs (middle panel) were measured by flow cytometry. CD45+ live TILs were cultured for 48 h on anti-CD28 and anti-CD3 coated plates. IFNγ was measured by ELISA (right panel) (n = 5 mice per group). p values of < 0.05 (*), < 0.01 (**), < 0.001 (***), or ≤ 0.0001 (****) are indicated.
Figure 7.
Figure 7.. Hyperactive cDC1s Can Use Complex Antigen Sources to Stimulate T-Cell-Mediated Anti-tumor Immunity
(A) Zbtb46DTR mice were s.c. injected with B16OVA cells. Mice were either injected with DTx every other day for four consecutive injections, or mice were injected with PBS. Seven days post-tumor injection, all mice were immunized with B16OVA WTLs plus LPS and PGPC, followed by two boost injections. The percentage of mice survival is indicated (n = 10 mice per group). (B) CD45.1 mice were irradiated then reconstituted with mixed BM from Zbtb46DTR mice plus either WT or Nlrp3−/−, Casp1/11−/−, or Ccr7−/− mice. Six weeks post-reconstitution, mouse chimeras were injected s.c. with B61OVA cells, then all mice received DTx 3 times a week for a total of 12 consecutive injections. Seven days post-tumor inoculation, chimeric mice were immunized with B16OVA WTLs and LPS plus PGPC and received two boost injections. The percentage of mice survival is indicated (n = 5 mice per group). (C and D) WT or Batf3−/− mice were injected s.c with B16OVA cells. Seven days post-tumor inoculation, mice were either left untreated, or WT and Batf3−/− mice were immunized with B16OVA WTLs and LPS plus PGPC followed by two boost injections. (C) The percentage of mice survival is indicated (n = 10 mice per group). (D) Twenty-one days post-tumor inoculation, the percentage of OVA-specific CD8+ T cells and CD4+ T cells was assessed using tetramer staining (n = 5 mice per group). (E and F) Batf3−/− mice were injected s.c on the right flank with B16OVA cells. Seven days post-tumor inoculation, mice were left untreated (no cDC1 injection) or were injected s.c. on the left flank with FLT3-derived naive cDC1s or active cDC1s treated with LPS or with hyperactive cDC1s pretreated with LPS plus PGPC. All cDC1s were loaded with B16OVA WTLs for 1 h prior to their injection. (E) The percentage of mice survival is indicated (n = 5 mice per group). (F) Twenty-one days post-tumor inoculation, OVA-specific CD8+ T cells and CD4+ T cells were assessed using tetramer staining (n = 5 mice per group). p values of < 0.05 (*), < 0.01 (**), or < 0.001 (***) are indicated.

Similar articles

Cited by

References

    1. Aglietti RA, Estevez A, Gupta A, Gonzalez Ramirez M, Liu PS, Kayagaki N, Ciferri C, Dixit VM, and Dueber EC (2016). GsdmD p30 elicited by caspase-11 during pyroptosis forms pores in membranes. Proc. Natl. Acad. Sci. USA 113, 7858–7863. - PMC - PubMed
    1. Alvarez D, Vollmann EH, and von Andrian UH (2008). Mechanisms and Consequences of Dendritic Cell Migration. Immunity 29, 325–342. - PMC - PubMed
    1. Ben-Sasson SZ, Hu-Li J, Quiel J, Cauchetaux S, Ratner M, Shapira I, Dinarello CA, and Paul WE (2009). IL-1 acts directly on CD4 T cells to enhance their antigen-driven expansion and differentiation. Proc. Natl. Acad. Sci. USA 106, 7119–7124. - PMC - PubMed
    1. Ben-Sasson SZ, Hogg A, Hu-Li J, Wingfield P, Chen X, Crank M, Caucheteux S, Ratner-Hurevich M, Berzofsky JA, Nir-Paz R, and Paul WE (2013). IL-1 enhances expansion, effector function, tissue localization, and memory response of antigen-specific CD8 T cells. J. Exp. Med 210, 491–502. - PMC - PubMed
    1. Brubaker SW, Bonham KS, Zanoni I, and Kagan JC (2015). Innate immune pattern recognition: a cell biological perspective. Annu. Rev. Immunol 33, 257–290. - PMC - PubMed

Publication types