. 2020 Nov 17;33(7):108398.
doi: 10.1016/j.celrep.2020.108398.

Tau Pathology Drives Dementia Risk-Associated Gene Networks toward Chronic Inflammatory States and Immunosuppression

Affiliations

Tau Pathology Drives Dementia Risk-Associated Gene Networks toward Chronic Inflammatory States and Immunosuppression

Jessica E Rexach et al. Cell Rep. .

Abstract

To understand how neural-immune-associated genes and pathways contribute to neurodegenerative disease pathophysiology, we performed a systematic functional genomic analysis in purified microglia and bulk tissue from mouse and human AD, FTD, and PSP. We uncover a complex temporal trajectory of microglial-immune pathways involving the type 1 interferon response associated with tau pathology in the early stages, followed by later signatures of partial immune suppression and, subsequently, the type 2 interferon response. We find that genetic risk for dementias shows disease-specific patterns of pathway enrichment. We identify drivers of two gene co-expression modules conserved from mouse to human, representing competing arms of microglial-immune activation (NAct) and suppression (NSupp) in neurodegeneration. We validate our findings by using chemogenetics, experimental perturbation data, and single-cell sequencing in post-mortem brains. Our results refine the understanding of stage- and disease-specific microglial responses, implicate microglial viral defense pathways in dementia pathophysiology, and highlight therapeutic windows.

Keywords: chemical genomics; frontotemporal dementia; gene network; inflammasome; interferon; neurodegeneration; progressive supranuclear palsy; systems biology; transcriptomics.


Conflict of interest statement

Declaration of Interests D.H.G. has received research funding from Takeda Pharmaceuticals and Hoffman-LaRoche. D.M. is a full-time employee of F. Hoffmann-La Roche, Basel, Switzerland.

Figures

Figure 1.
Figure 1.. Purified Microglia-Brain Tissue Consensus Gene Co-expression Network Analysis
(A) Experimental schema, showing approach for microglia-tissue consensus WGCNA. (B) Module enrichment heatmap for (left) top 100 genes differentially expressed between progressive microglia single-cell states, as indicated, and (right) genes differentially expressed between microglia single-cell states identified from the prefrontal cortex of patients with Alzheimer’s disease (AD) and controls, as indicated; Mic0, Mic1 (AD-associated microglia subpopulation), Mic2, and Mic3, microglia subclusters as defined in Mathys et al. (2019); n = 7 modules with 4 comparisons per module. *FDR < 0.05, **FDR < 0.005, ***FDR < 0.001. Hom, homeostatic; DAM1, type 1 disease-associated microglia; DAM2, type 2 DAMs, as defined in Keren-Shaul et al. (2017). (C) Signed Pearson’s correlation of the module eigengene (ME) with transgenic condition calculated in the rTg4510 microglia gene expression dataset at each age; unpaired 2-tailed t test; n = 7 modules, n = 4 mice per genotype (P301L MAPT or wild type [WT]); *p < 0.05, **p < 0.01, ***p < 0.005. Graphed with theoretical zero plotted at time zero. (D) Module PPI network enrichment p value (STAR Methods). (E) Module annotation showing representative module hub genes (disease genes in red), enriched Gene Ontology terms (Z score > 2), transcription factors (TFs) with binding site enrichment (p < 0.05; STAR Methods), and module genes that function as receptors for pathogen- or damage-associated molecular patterns (“immune sensors”). TF labels are bold and italic if unique, and red if a module hub gene. (F) Scatterplot of gene-module connectivity (kME) (y axis) versus gene correlation with sample pT231 tau levels (x axis) in TPR50 mouse brain (n = 36; frontal cortex, 6 months of age, n = 18 per group of WT or P301S MAPT; p values from 2-sided test for Pearson correlation). (G) Module preservation in AD patient and control temporal cortex (control n = 74, AD n = 86), PSP patient and control temporal cortex (control n = 37, PSP n = 37) (Allen et al., 2016), and FTD patient and control frontal cortex (dataset 1 [Chen-Plotkin et al., 2008] control n = 8, FTD n = 10; dataset 2 [Swarup et al., 2019] control n = 14, FTD n = 16). The bottom line is at the lower cutoff for preservation (Zsummary = 2) and the upper line is at the cutoff for high preservation (Zsummary = 10) (Langfelder et al., 2011). See also Figure S1.
Figure 2.
Figure 2.. Microglia-Tissue Consensus Module Microglia Disease Time Course and Pathway Annotation
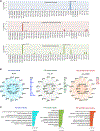
(A) Protein-protein interactions (PPIs) among the top 150 module genes (ranked by kME) with associated Gene Ontology pathway labeled, as shown (GO-Elite [Zambon et al., 2012], Z score > 2). (B) Model showing microglia transitions across progressive disease stages based on the annotation of microglia-tissue consensus modules (MNMs). See also Figure S2.
Figure 3.
Figure 3.. GWAS Variants for AD, FTD, or PSP Implicate Modules Associated with Viral Response in Causal Disease Biology
(A) Module enrichment for disease variants for AD (Lambert et al., 2013), FTD (Ferrari et al., 2014b), or PSP (Höglinger et al., 2011) (horizontal line: —log10(FDR) = 1; FDR corrected, competitive gene-set analysis p value from MAGMA [de Leeuw et al., 2015]). (B) Gene co-expression network plots of the top 25 genes, ranked by kME, from each module; with enriched TFs (bold, if unique) shown (“TFBS”; enrichment p < 0.05). (C) GO terms enrichment among corresponding module genes (Z score > 2). See also Figure S3.
Figure 4.
Figure 4.. Opposing Neuroimmune Activation and Suppression Modules Are Upregulated Early in Disease
(A) Experimental schema for identifying opposing regulatory networks among upregulated microglia module genes. (B) Signed Pearson’s correlation of the ME with transgenic trait calculated in the rTg4510 microglia gene expression dataset at each age (n = 7 modules, n = 4 mice per genotype [P301L MAPT or WT], ages = 2, 4, 6, and 8 months, *2-tailed p value of Pearson’s correlation < 0.005). (C) Scatterplot of gene-module connectivity scores (kME) with module A and module B calculated across rTg4510 purified microglia samples (n = 32 samples, n = 899 genes). (D) Bar plots showing CMAP connectivity scores between overexpression of a given gene (n = 2,161 genes) and NAct (pink) and NSupp (blue) modules, ordered from left to right by difference between NSupp and NAct module connectivity scores. The top 5 highest scoring module genes among 2,161 CMAP overexpressed genes shown for each module. (E) PPI maps with associated GO pathways highlighted for NAct. (F) Module preservation and trajectory of average module gene expression of the NAct and NSupp modules in cultured microglia treated with fibrillar Abeta42 or vehicle control (unpaired 2-sample Wilcoxon rank-sum test; n = 3 per group [Woodling et al., 2014]). Boxplot with center line at median and upper and lower lines at 75th and 25th percentiles. (G) Module assignment and module connectivity scores for components of NLRP3 inflammasome complex and type I IFN response. (H) PPI maps with associated GO pathways highlighted for NSupp. (I) Trajectory of NAct and NSupp MEs in mouse microglia purified from IFNAR knockout or WT mice infected with IFN-β expressing or control adeno-associated virus (AAV) (unpaired 2-sample Wilcoxon rank-sum test, WT control-virus n = 3, IFNAR knockout control-virus n = 7, WT IFN-β-virus n = 5, IFNAR knockout IFN-β-virus n = 7 [Deczkowska et al., 2017]). Boxplot with center line at median and upper and lower lines at 75th and 25th percentiles. See also Figure S4.
Figure 5.
Figure 5.. Microglial Immune Suppression Is Prominent in Disease
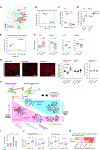
(A) PPI plot showing that Usp18 is a central NSupp module gene based on high PPI and ME connectivity (node color) in microglia purified from IFN-β and control treated mice (Deczkowska et al., 2017). (B–D) Module preservation of NAct and NSupp modules (B); ME trajectory of NAct in Usp18 knockout, IFNAR knockout, double knockout, and WT mouse brain (C) (2-tailed unpaired t test; n = 3 per group [Goldmann et al., 2015]; boxplot with center line at median and upper and lower lines at 75th and 25th percentiles) and average module gene expression of NSupp and NAct in Usp18 knockout and WT mouse microglia (D) (2-tailed unpaired t test; n = 2 per group [Goldmann et al., 2015]). (E) Module preservation of NAct and NSupp in primary mouse microglia cultures treated with drugs or DMSO vehicle as indicated in (F). (F) ME trajectory of NAct and NSupp in primary mouse microglia cultures treated with high-dose saracatinib (1 µM, n = 10, 24 h) or DMSO vehicle control (n = 10, 24 h), and fatostatin (1 µM, n = 5, 72 h) or DMSO vehicle (n = 6, 72 h) (unpaired 2-sample Wilcoxon rank-sum test). (G) Image of neuronal-BV2 co-cultures (left) showing neuronal processes (synaptophysin) and BV2 cells (non-neuronal DAPI+ cells), and density of neuronal processes (left) and BV2 cells (far right) normalized to controls, following 36 h co-culture and treatment with saracatinib (1 µM, n = 5), fatostatin (1 µM n = 7), or DMSO vehicle (n = 6), compared to density of neuronal processes in drug-treated and control neurons cultured without BV2 cells (center). (H) Model showing that nucleotide detection from damaged cells activates interferon (IFN) to suppress microglia activity in disease. (I) Pre-treatment with IFN-β (20 ng/mL) reduces IL-1β secretion of human iPSC-derived microglia-like cultures following stimulation by fibrillar amyloid β (1 µM) (2-tailed unpaired t test; n = 3 per condition). (J) ME trajectories of NSupp and NAct in AD patient and control temporal cortex (control n = 74, AD n = 86) and PSP patient and control temporal cortex (control n = 37, PSP n = 37) (Allen et al., 2016) (unpaired 2-sample Wilcoxon rank-sum test). Boxplot with center line at median and upper and lower lines at 75th and 25th percentiles. (K) Module enrichment for genes that are differentially expressed in microglia of AD compared to control brain based on published single nuclear sequencing studies (genes upregulated or downregulated in AD with log fold change [LFC] > 0.1 and FDR < 0.05 = “AD_up,” and “AD_down,” respectively; Fisher’s 2-tailed exact test, *FDR < 0.05, **FDR < 0.001, ***FDR < 0.005 [Grubman et al., 2019; Mathys et al., 2019]).
Figure 6.
Figure 6.. Microglia from Patients with FTD Upregulate the Later-Stage Immune Pathways Identified in Mice with Tau Pathology
(A) Seurat object of nuclei sequenced from bvFTD patients with tau pathology (Pick’s disease, precentral gyrus, n = 7) and control (no pathology, precentral gyrus, n = 8), showing the cell cluster enriched for microglial-specific marker genes (green, top) and cells from bvFTD (pink) and control (blue) patients. (B) Scatterplot and Pearson’s correlation of effect size (β) of differential gene expression between bvFTD versus control microglia, comparing results from a linear model (x axis) and mixed-effects model with subject as a random effect (y axis) (n = 7,989 genes). (C) PPI plot of genes significantly upregulated in bvFTD microglia compared to controls (log2fc3 0.1, FDR < 5E−4), highlighting genes with PPI in significant GO pathways (Z > 2). The asterisk indicates functional overlap with M_UP3. (D) Bar plot of genes that are differentially expressed in bvFTD versus control microglia (log2fc scale) and either activate IFN-γ (blue) or mediate IFN-γ signaling (red), (linear model; *p < 0.05, **p < 0.01, ***p < 0.001, ****p < 0.001). See also Figure S5 and Table S3.

References

    1. Ahmad S, Mu X, Yang F, Greenwald E, Park JW, Jacob E, Zhang CZ, and Hur S (2018). Breaching Self-Tolerance to Alu Duplex RNA Underlies MDA5-Mediated Inflammation. Cell 172, 797–810.e13. - PMC - PubMed
    1. Ahmed ME, Iyer S, Thangavel R, Kempuraj D, Selvakumar GP, Raikwar SP, Zaheer S, and Zaheer A (2017). Co-Localization of Glia Maturation Factor with NLRP3 Inflammasome and Autophagosome Markers in Human Alzheimer’s Disease Brain. J. Alzheimers Dis 60, 1143–1160. - PMC - PubMed
    1. Allen M, Carrasquillo MM, Funk C, Heavner BD, Zou F, Younkin CS, Burgess JD, Chai HS, Crook J, Eddy JA, et al. (2016). Human whole genome genotype and transcriptome data for Alzheimer’s and other neurodegenerative diseases. Sci. Data 3, 160089. - PMC - PubMed
    1. Basters A, Knobeloch KP, and Fritz G (2018). USP18 - a multifunctional component in the interferon response. Biosci. Rep 38, BSR20180250. - PMC - PubMed
    1. Benjamini Y, and Hochberg Y (1995). Controlling the false discovery rate: a practical and powerful approach to multiple testing. J. R. Stat. Soc. B 57, 289–300.

Publication types

MeSH terms