. 2020 Nov 17;33(7):108395.
doi: 10.1016/j.celrep.2020.108395.

Requisite Chromatin Remodeling for Myeloid and Erythroid Lineage Differentiation from Erythromyeloid Progenitors

Affiliations

Requisite Chromatin Remodeling for Myeloid and Erythroid Lineage Differentiation from Erythromyeloid Progenitors

Jun Wu et al. Cell Rep. .

Abstract

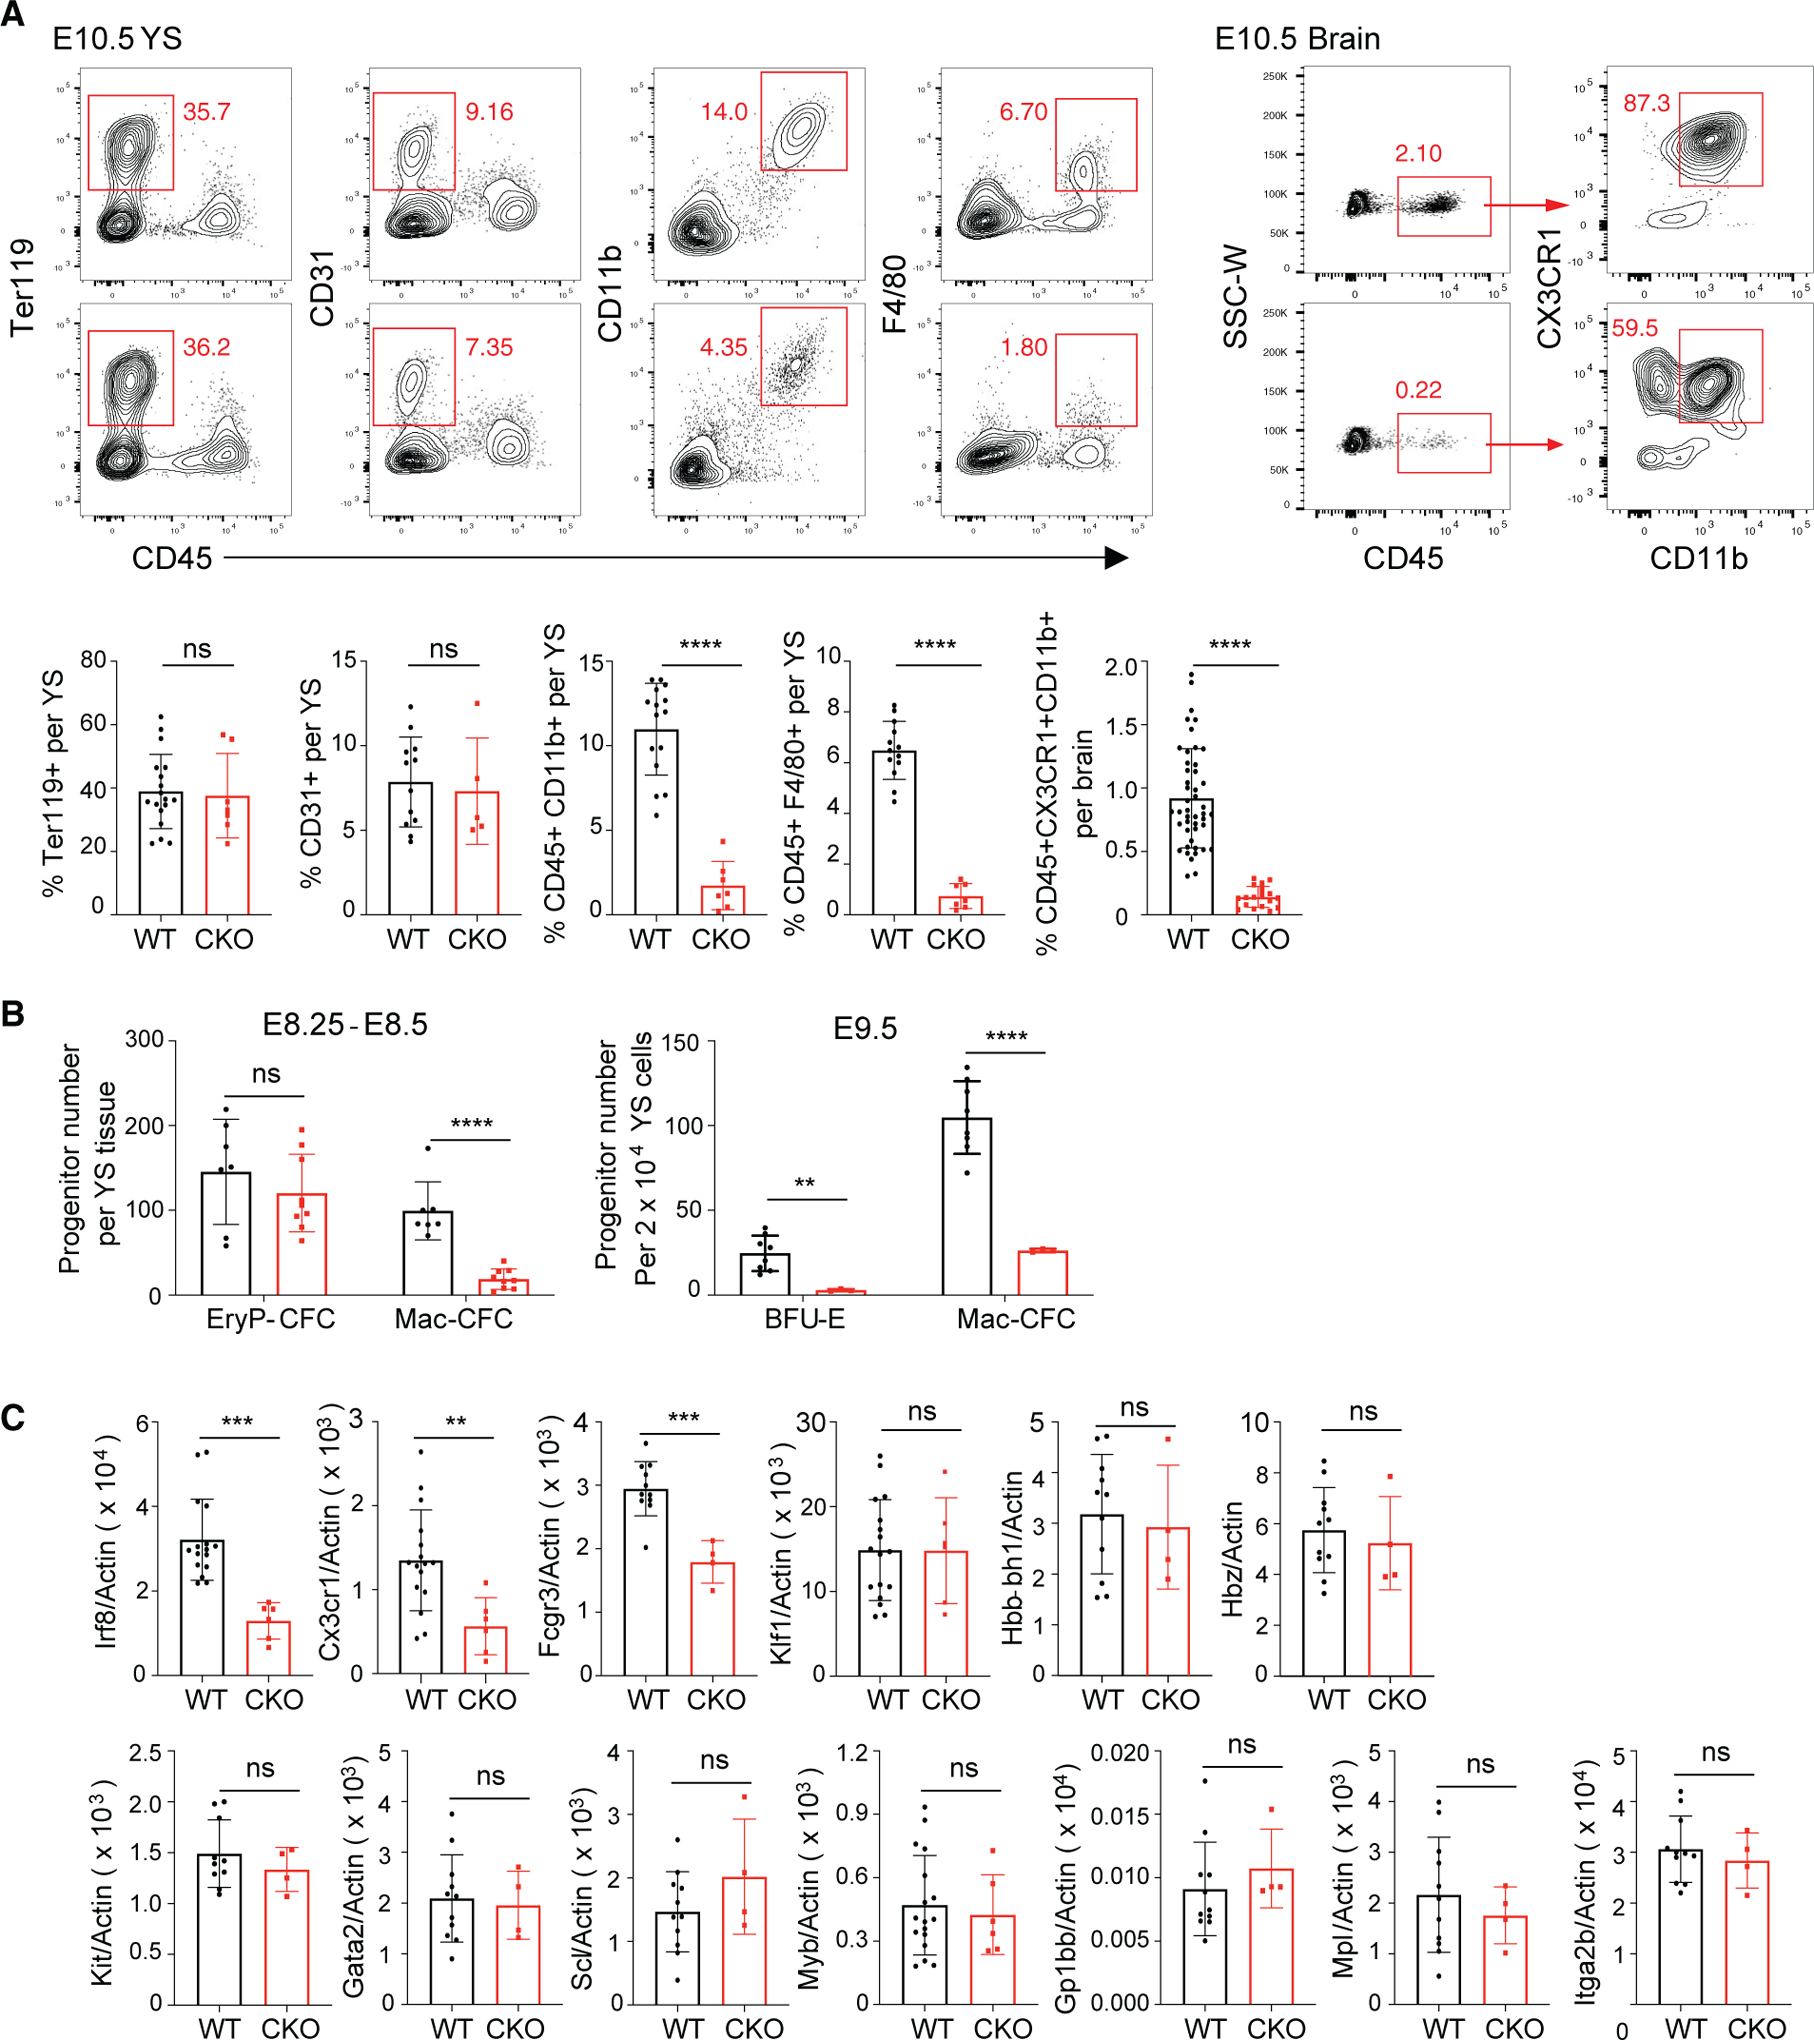
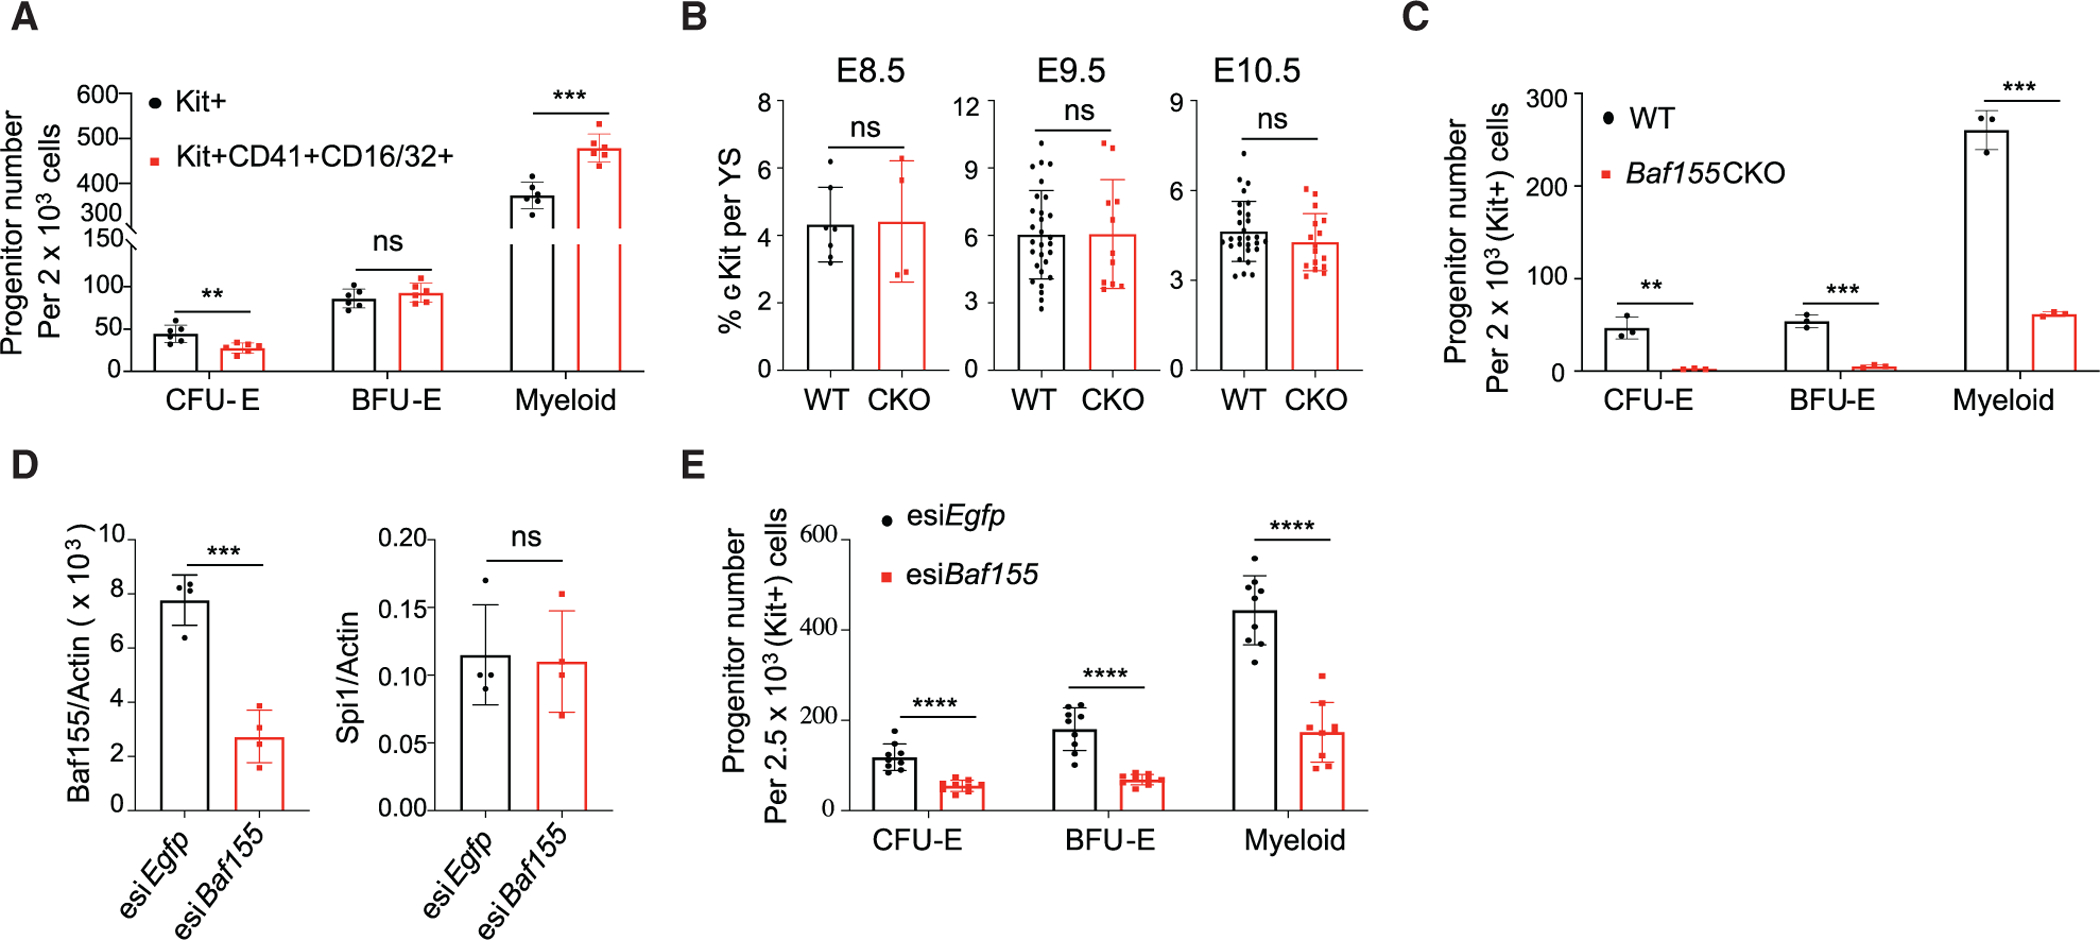
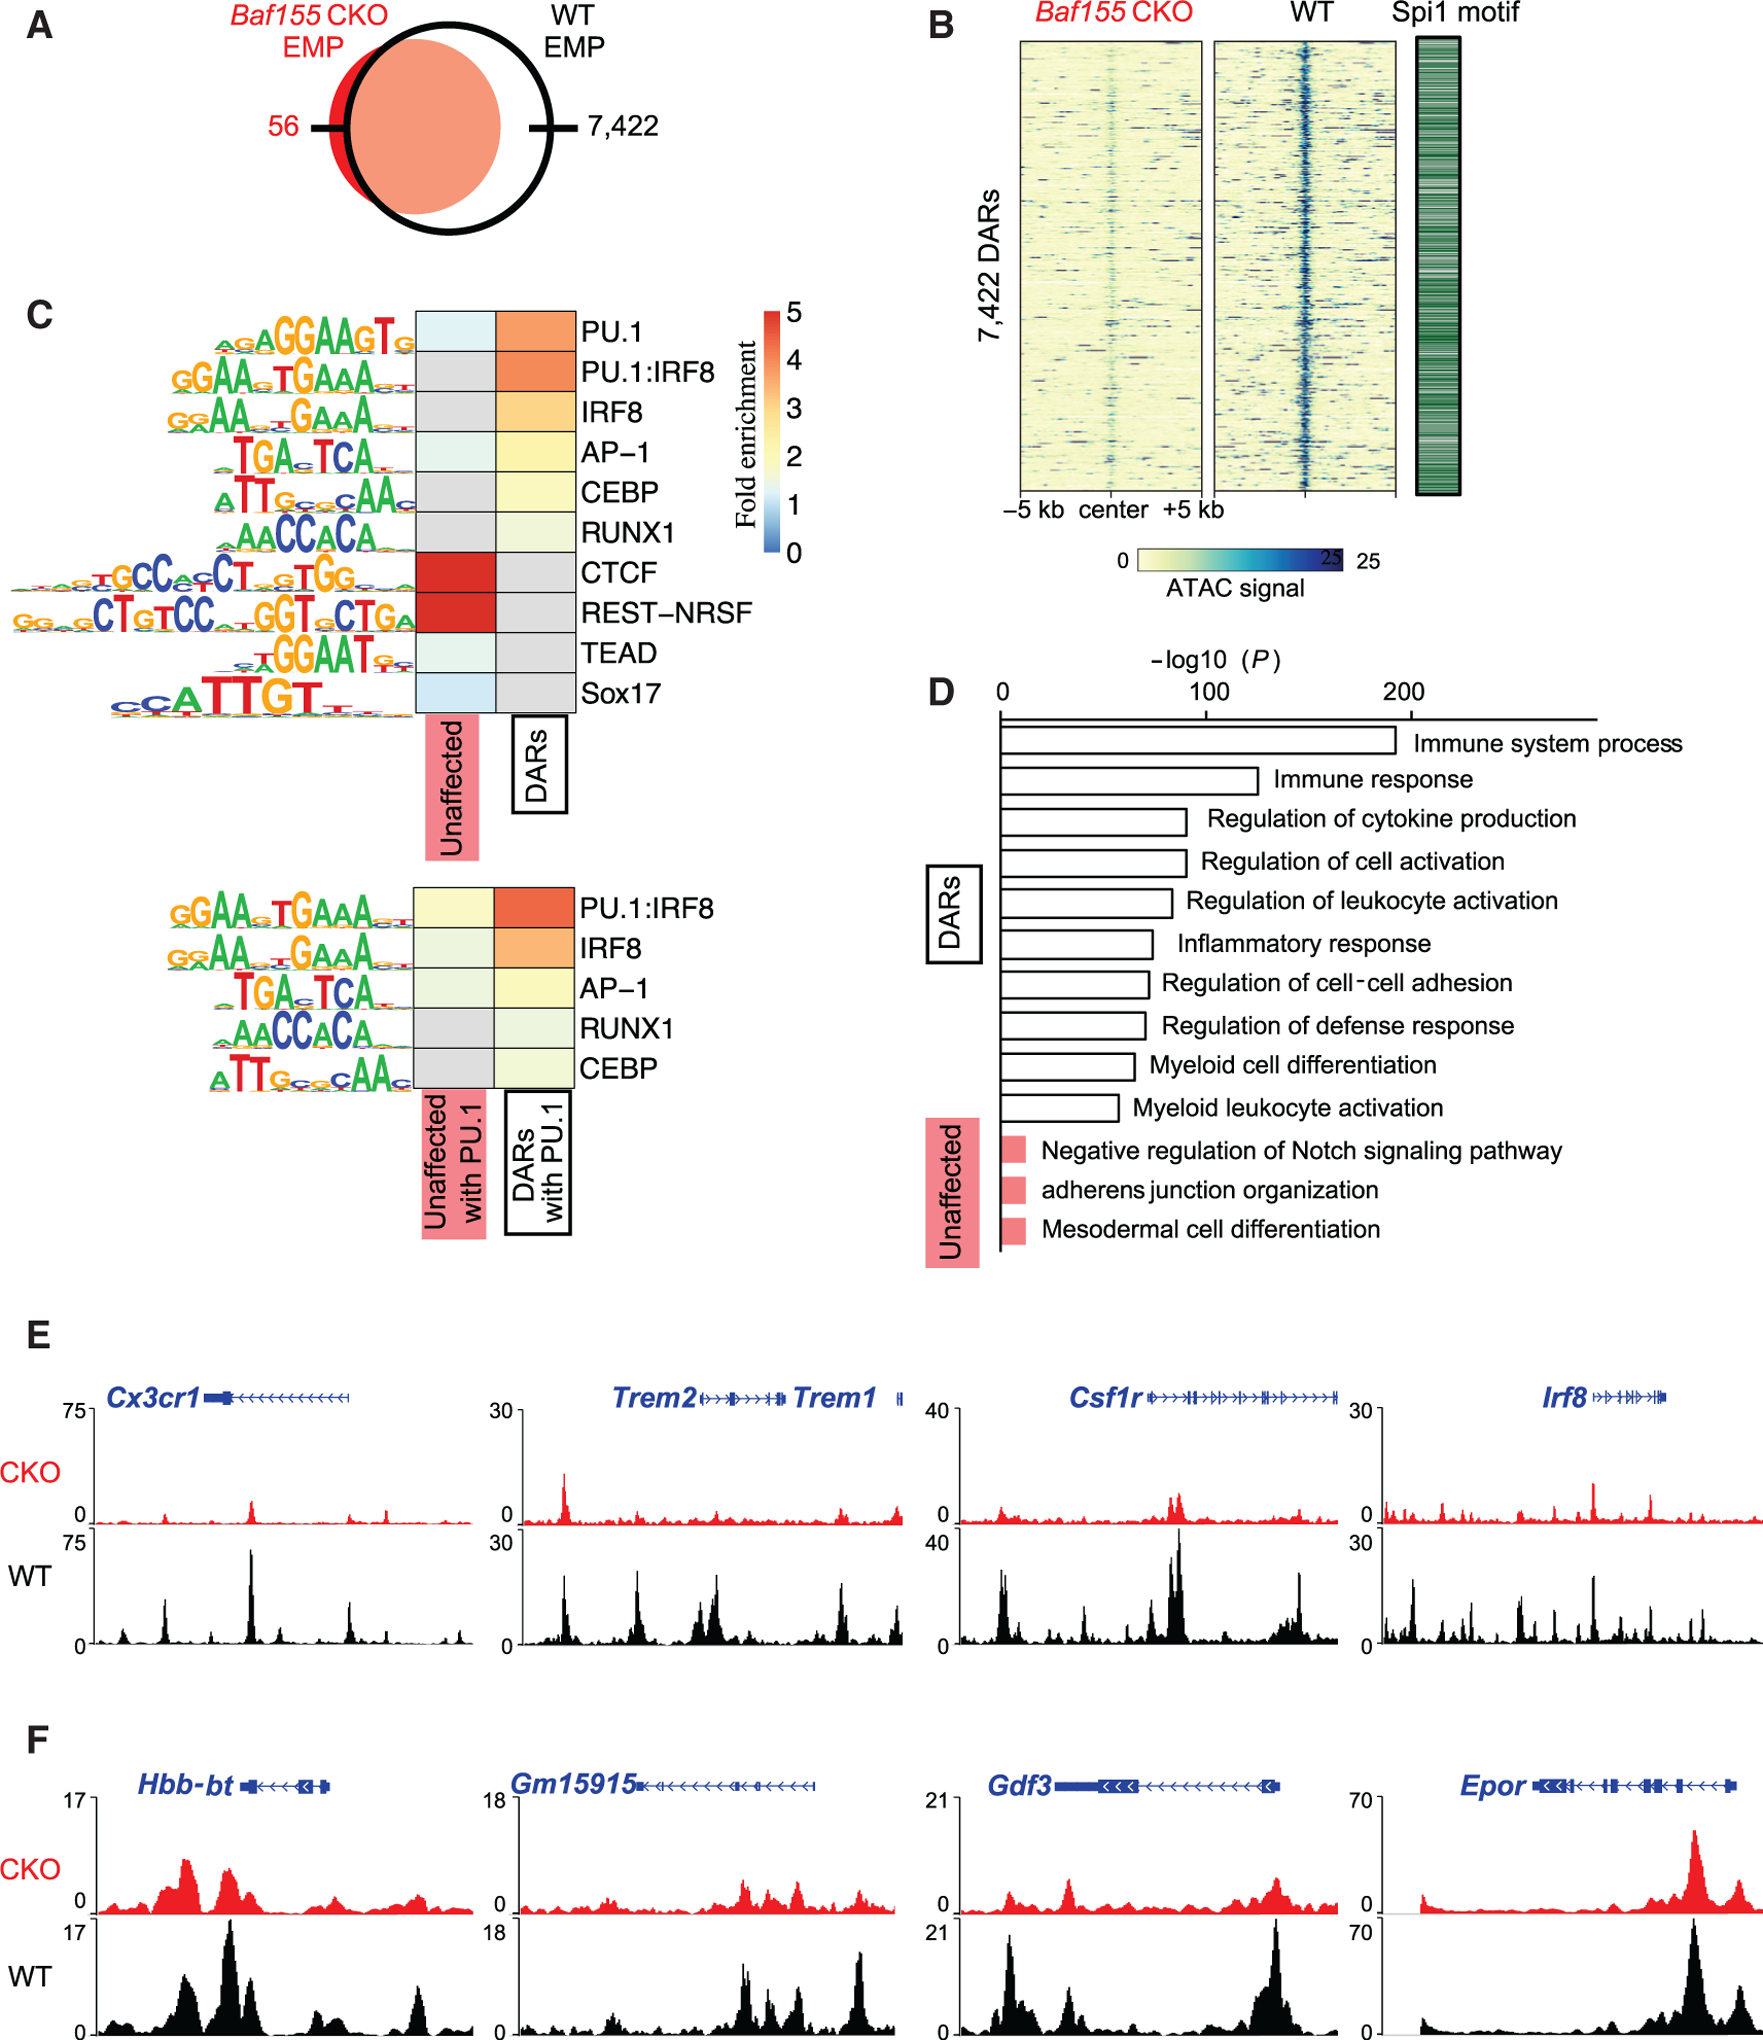
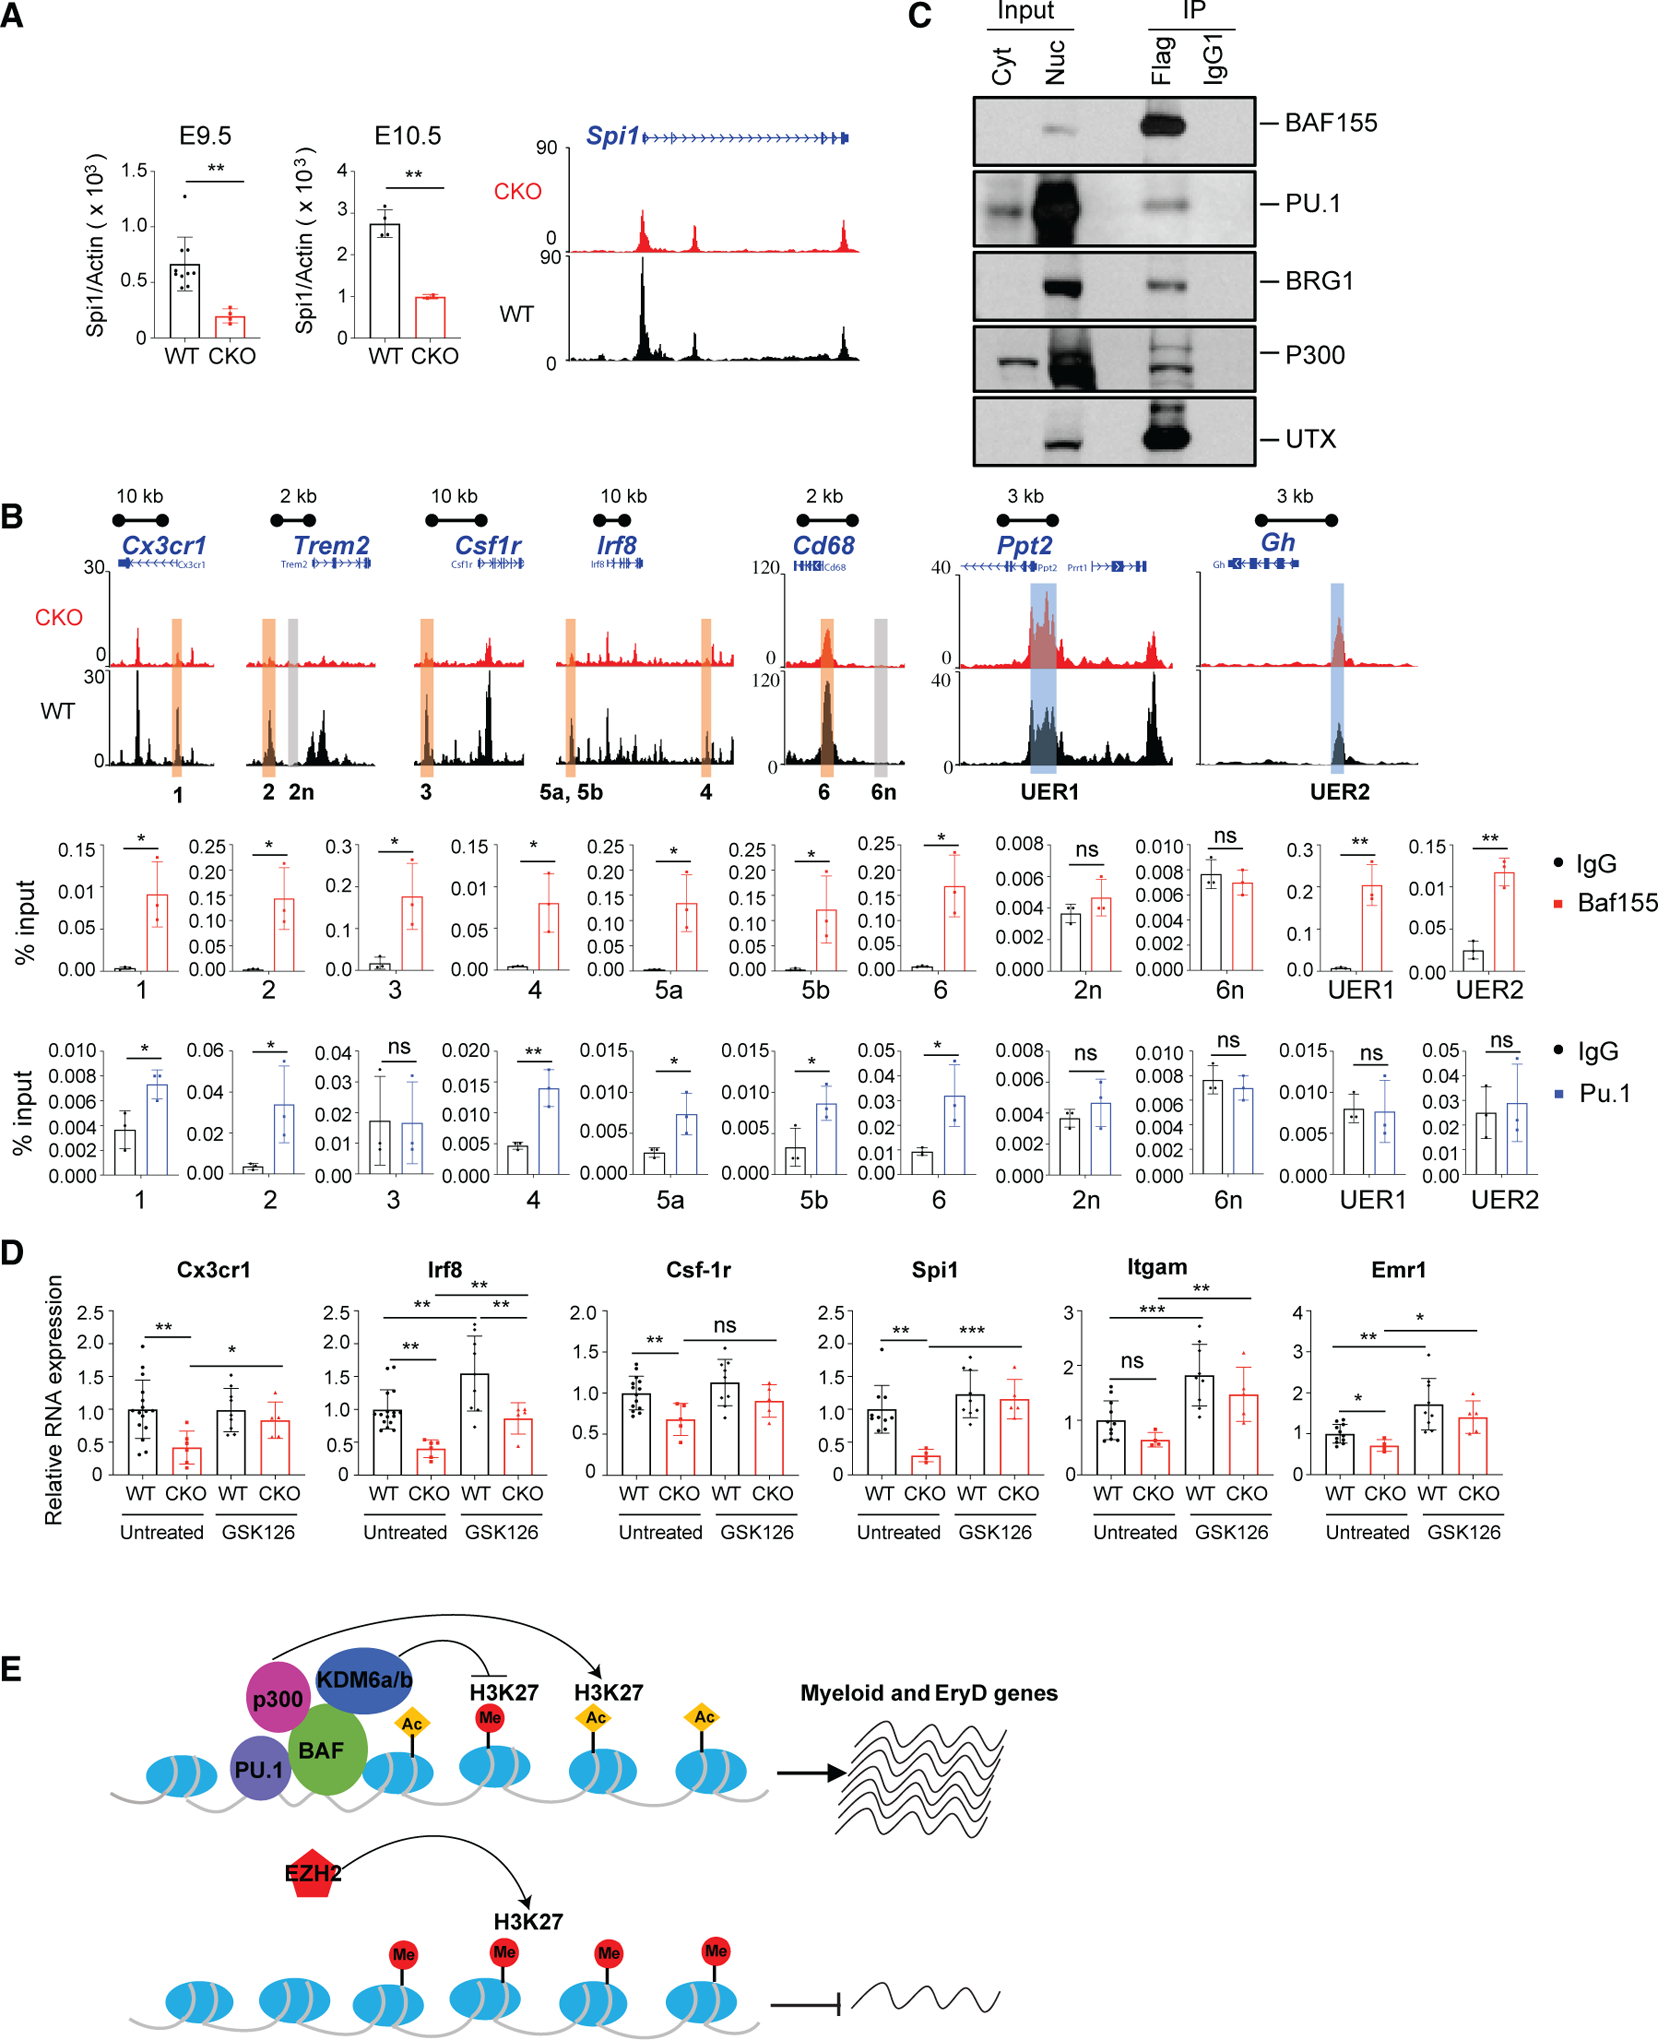
The mammalian SWitch/Sucrose Non-Fermentable (SWI/SNF) chromatin-remodeling BAF (BRG1/BRM-associated factor) complex plays an essential role in developmental and pathological processes. We show that the deletion of Baf155, which encodes a subunit of the BAF complex, in the Tie2(+) lineage (Baf155 (CKO) leads to defects in yolk sac myeloid and definitive erythroid (EryD) lineage differentiation from erythromyeloid progenitors (EMPs). The chromatin of myeloid gene loci in Baf155 CKO EMPs is mostly inaccessible and enriched mainly by the ETS binding motif. BAF155 interacts with PU.1 and is recruited to PU.1 target gene loci together with p300 and KDM6a. Treatment of Baf155 CKO embryos with GSK126, an H3K27me2/3 methyltransferase EZH2 inhibitor, rescues myeloid lineage gene expression. This study uncovers indispensable BAF-mediated chromatin remodeling of myeloid gene loci at the EMP stage. Future studies exploiting epigenetics in the generation and application of EMP derivatives for tissue repair, regeneration, and disease are warranted.

Keywords: Baf155; Brg1; Erythromyeloid progenitor; Kdm6a/6b; PU.1; Yolk sac; definitive erythroid; myeloid; p300.


Conflict of interest statement

Declaration of Interests The authors declare no competing interests.

Figures

Figure 1.
Figure 1.. Baf155 CKO Mice Show Defects in Myeloid and EryD Lineage Development
(A) A representative flow cytometry analysis of E10.5 yolk sacs (YS) EryP cells (CD45Ter119+), ECs (CD45CD31+), myeloid cells (CD45+CD11b+), macrophages (CD45+F4/80+), and brain microglia (CD45+CX3CR1+CD11b+) in wild-type (WT) and Baf155 CKO mice is shown in the top panel. The percentage of each population is shown in the bottom panel. At least 5 biological replicates in 4 independent experiments for either genotype were analyzed, each representing an individual YS. Data are presented as mean ± SD. Student’s t test; ns, not significant; ****p < 0.0001. (B) Distribution of EryP (EryP-CFC), EryD (BFU-E), and macrophage (Mac-CFC) progenitors from E8.25–E8.5/E9.5 WT and Baf155 CKO YS cells. E8.25–E8.5 data from 7 WT and 9 Baf155 CKO biological replicates and E9.5 data from 8 WT and 3 Baf155 CKO biological replicates representing two independent experiments, with each replicate consisting of a single YS, are shown. Data are presented as mean ± SD. Student’s t test; **p < 0.005, ****p < 0.0001. (C) qRT-PCR analysis of the indicated gene expression in E9.5 WT and Baf155 CKO YS cells is shown. Data are presented as mean ± SD. Student’s t test; **p < 0.005, ***p < 0.001. See also Figure S1.
Figure 2.
Figure 2.. Baf155 Is Required for Myeloid and EryD Lineage Differentiation from EMPs
(A) Distribution of CFU-E, BFU-E, and myeloid colonies developing from KIT+ and KIT+CD41+CD16/32+ population from WT E10.5 YSs. Data are presented as mean ± SD. Student’s t test; **p < 0.005, ***p < 0.001; 6 biological replicates. (B) Flow cytometry analysis of the cKIT+ population per YS from WT and Baf155 CKO embryos on the indicated embryonic day. E8.5 data (mean ± SD) are from 2 independent experiments. E9.5 and E10.5 data (mean ± SD) are from 6 independent experiments, each representing a single YS. Data are presented as mean ± SD. Student’s t test. (C) CFU-E, BFU-E, and myeloid colonies from cKIT+ cells from WT (n = 3) and Baf155 CKO (n = 3) YSs. Data are from 2 independent experiments, with each replicate consisting of a single or 2 pooled YSs of the same genotype. Data are presented as mean ± SD. Student’s t test; **p < 0.01, ***p < 0.001. (D) qRT-PCR analysis of the indicated gene expression in cKIT+ cells from E10.5 WT YSs transfected with esiRNA against Baf155 or Egfp. Data are presented as mean ± SD. Student’s t test; ***p < 0.001; four biological replicates from 3 independent experiments. (E) CFU-E, BFU-E, and myeloid colonies from cKIT+ cells from E10.5 WT YSs transfected with esiRNA against Baf155 or Egfp. Data are presented as mean ± SD. Student’s t test; ***p < 0.001. Nine biological replicates from 3 independent experiments. See also Figure S2.
Figure 3.
Figure 3.. scRNA-Seq Data Reveal Myeloid and EryD Differentiation Defects from Baf155-Deficient EMPs
(A) t-SNE projection of all cells, showing 10 different clusters. (B) Baf155/Smarcc1 expression in all YSs, showing the absence of Baf155 expression in the CKO EMP cell population. (C) An overlay of scRNA-seq data between WT and Baf155 CKO YSs. (D) Percentage of cells in each cluster from WT versus Baf155 CKO YSs. (E) Heatmap showing differentially expressed genes in each cluster. (F) The EMP signature genes Gata2, Tal1, cKit, Cd34, and Pu.1/Spi1 are similarly expressed in WT and Baf155 CKO EMPs. (G) A cell population with myeloid lineage signature gene expression (Irf8, Maf, Csf1r, Cx3cr1, and Trem2) is absent in Baf155 CKO YSs. (H) A cell population with EryD lineage signature genes expression (Gdf3, Muc13, Ccl17, and Gm15915) is significantly lower in Baf155 CKO YSs. (I) A population with elevated megakaryocyte lineage signature gene expression is increased in Baf155 CKO YS cells. (J) Endothelial lineage signature genes are still expressed in the Baf155-deficient EMP cell population. See also Figure S3.
Figure 4.
Figure 4.. Baf155 CKO EMPs Have Reduced Chromatin Accessibility at the Myeloid and EryD Gene Loci
(A) A Venn diagram of the numbers of ATAC-seq peaks found in Baf155 CKO and WT EMPs. (B) ATAC-seq signals over 10-kb regions centered on the differentially accessible regions (DARs) with reduced signals in Baf155 CKO EMPs compared with the WT (left) and the presence of the Spi1/Pu.1 motif in the DARs (right). (C) Heatmaps of HOMER known TF motif fold enrichment in the DARs and unaffected accessible regions. Gray cells indicate no enrichment found (p > 0.05). (D) Enriched Gene Ontology (GO) terms and their binomial p values from analyzing the DARs with reduced signals in Baf155 CKO EMPs (white) and the unaffected peaks (red) using GREAT. (E) Epigenome browser views of representative myeloid gene loci. (F) Epigenome browser views of representative erythroid gene loci. See also Figure S4.
Figure 5.
Figure 5.. BAF155 Interacts with PU.1 and Is Recruited to Its Target Genes
(A) qRT-PCR analysis of Pu.1 expression (top) and epigenome browser view of the Spi1/Pu.1 locus (bottom) from WT and Baf155 CKO YSs. Data are from at least two biological replicates for either genotype, with each replicate consisting of an individual YS. Data are presented as mean ± SD. Student’s t test; **p < 0.01. (B) Epigenome browser views of selected myeloid and negative control genomic regions and unaffected ETS regions between WT and Baf155 CKO YS EMPs (top panel). Also shown is ChIP-qPCR showing enrichment of PU.1 and BAF155 binding at selected myeloid gene loci (highlighted regions in the top panel, 1–6), negative control gene loci (highlighted regions in the top panel, 2n and 6n), and unaffected ETS regions (highlighted regions in the top panel, UER1 and UER2) in E10.5 WT YSs (bottom panel). qPCR primers and genomic locations are provided in Table S2. Data are presented as mean ± SD; n = 3. (C) Cytoplasmic (Cyt) and nuclear (Nuc) protein input and anti-FLAG and isotype control (IgG1) immunoprecipitation of nuclear extracts from MEFs over-expressing FLAG-Baf155 and Pu.1. Shown are immunoblots for BAF155, PU.1, BRG1, P300, and UTX (KDM6a). (D) qRT-PCR analysis of Cx3cr1, Irf8, Csf-1r, Pu.1/Spi1, Itgam, and Emr1 gene expression in E9.5 WT and Baf155 CKO YSs with or without GSK126 treatment. Gene expression was normalized to the untreated WT mean value. Data are from at least four biological replicates for either genotype, with each replicate consisting of an individual YS. Data are presented as mean ± SD. Student’s t test; *p < 0.05, **p < 0.01, ***p < 0.001. (E) A model showing BAF-mediated chromatin remodeling in PU.1 transcriptional gene activation. See also Figure S5.

References

    1. Ahn J, Ko M, Lee K, Oh J, Jeon SH, and Seong RH (2005). Expression of SRG3, a core component of mouse SWI/SNF chromatin-remodeling complex, is regulated by cooperative interactions between Sp1/Sp3 and Ets transcription factors. Biochem. Biophys. Res. Commun 338, 1435–1446. - PubMed
    1. Alver BH, Kim KH, Lu P, Wang X, Manchester HE, Wang W, Haswell JR, Park PJ, and Roberts CW (2017). The SWI/SNF chromatin remodelling complex is required for maintenance of lineage specific enhancers. Nat. Commun 8, 14648. - PMC - PubMed
    1. Azzoni E, Frontera V, McGrath KE, Harman J, Carrelha J, Nerlov C, Palis J, Jacobsen SEW, and de Bruijn MF (2018). Kit ligand has a critical role in mouse yolk sac and aorta-gonad-mesonephros hematopoiesis. EMBO Rep 19, e45477. - PMC - PubMed
    1. Buenrostro JD, Giresi PG, Zaba LC, Chang HY, and Greenleaf WJ (2013). Transposition of native chromatin for fast and sensitive epigenomic profiling of open chromatin, DNA-binding proteins and nucleosome position. Nat. Methods 10, 1213–1218. - PMC - PubMed
    1. Bultman S, Gebuhr T, Yee D, La Mantia C, Nicholson J, Gilliam A, Randazzo F, Metzger D, Chambon P, Crabtree G, and Magnuson T (2000). A Brg1 null mutation in the mouse reveals functional differences among mammalian SWI/SNF complexes. Mol. Cell 6, 1287–1295. - PubMed

Publication types

MeSH terms