. 2020 Dec 21;55(6):679-694.e11.
doi: 10.1016/j.devcel.2020.10.015. Epub 2020 Nov 17.

Mechanical Tension Promotes Formation of Gastrulation-like Nodes and Patterns Mesoderm Specification in Human Embryonic Stem Cells

Affiliations

Mechanical Tension Promotes Formation of Gastrulation-like Nodes and Patterns Mesoderm Specification in Human Embryonic Stem Cells

Jonathon M Muncie et al. Dev Cell. .

Abstract

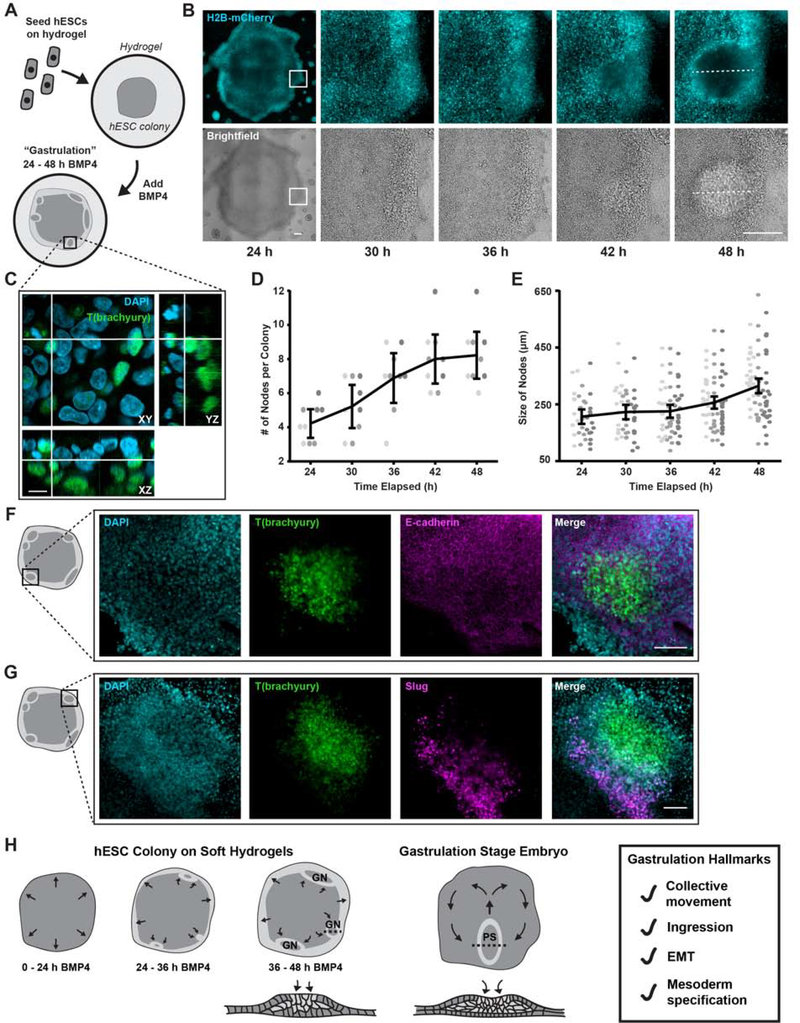
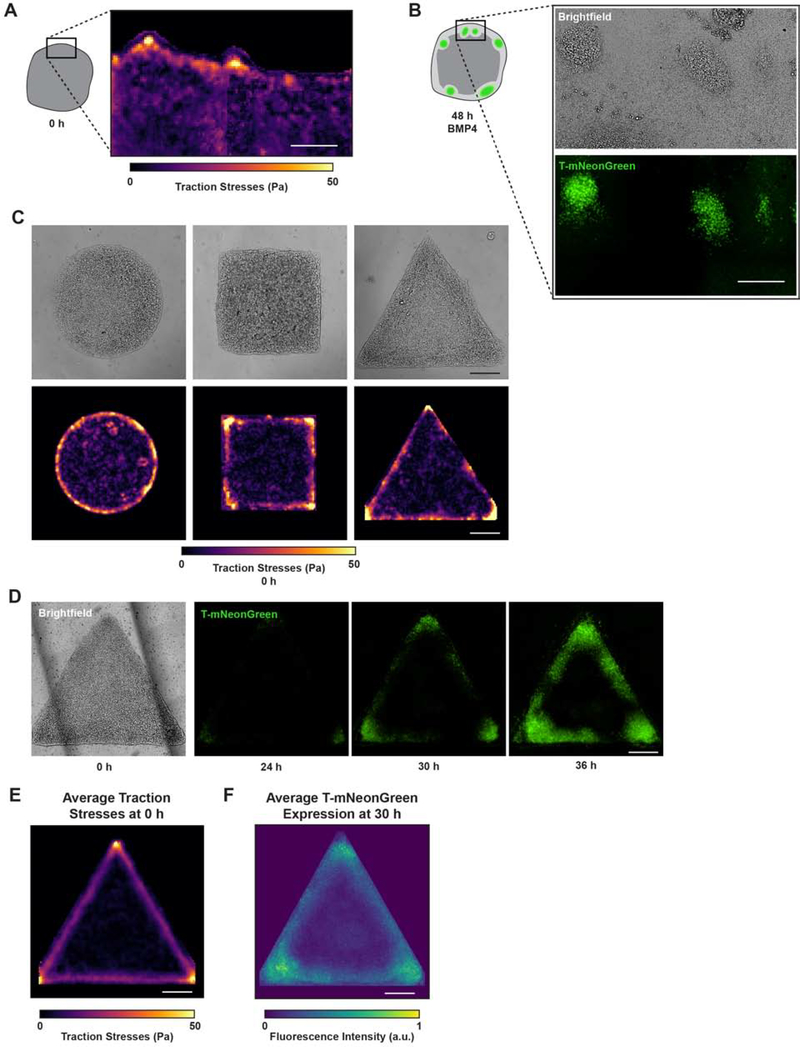
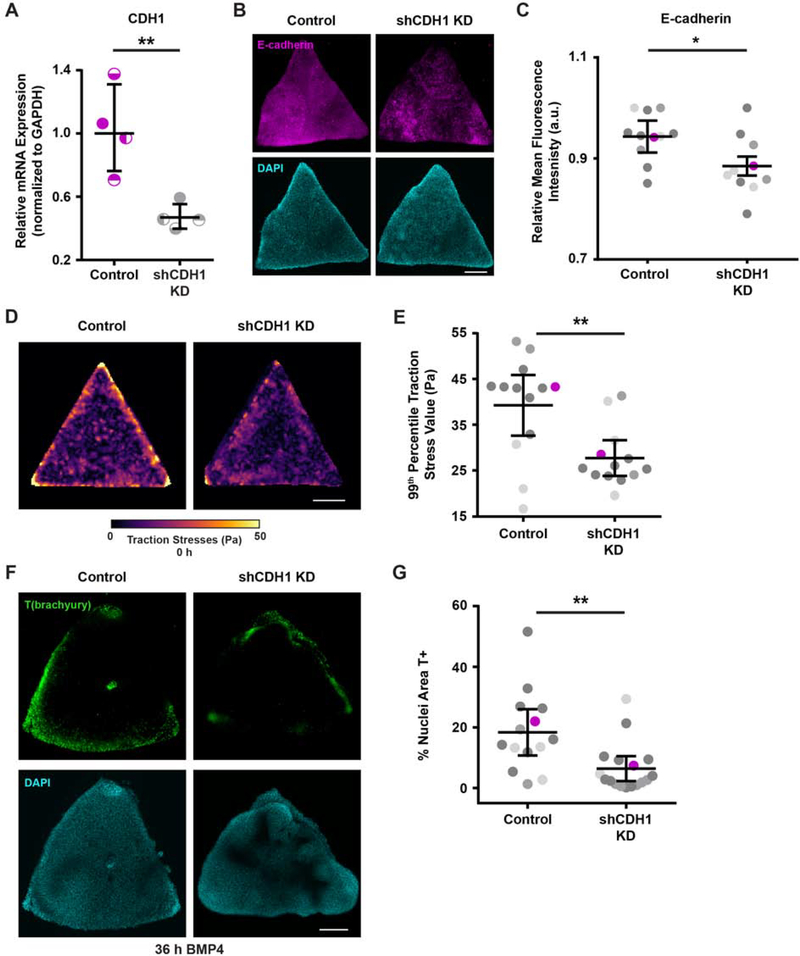
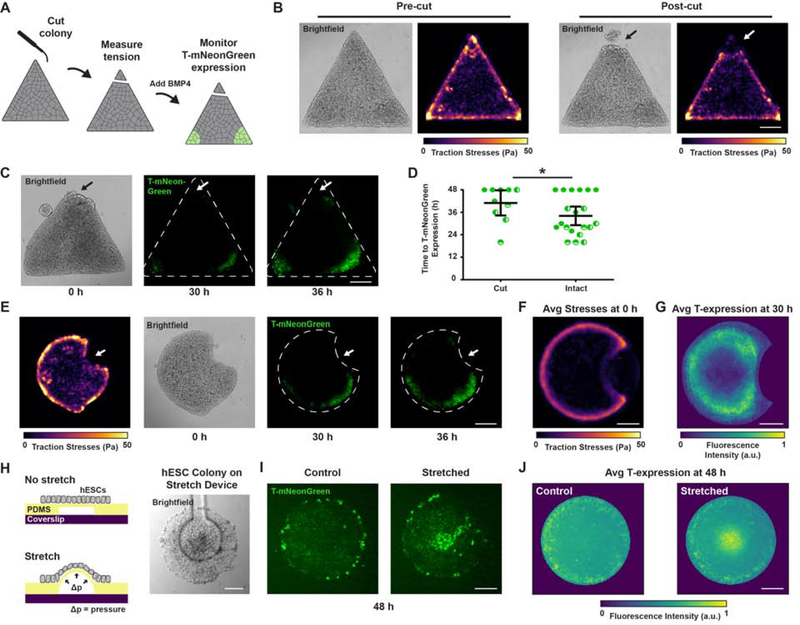
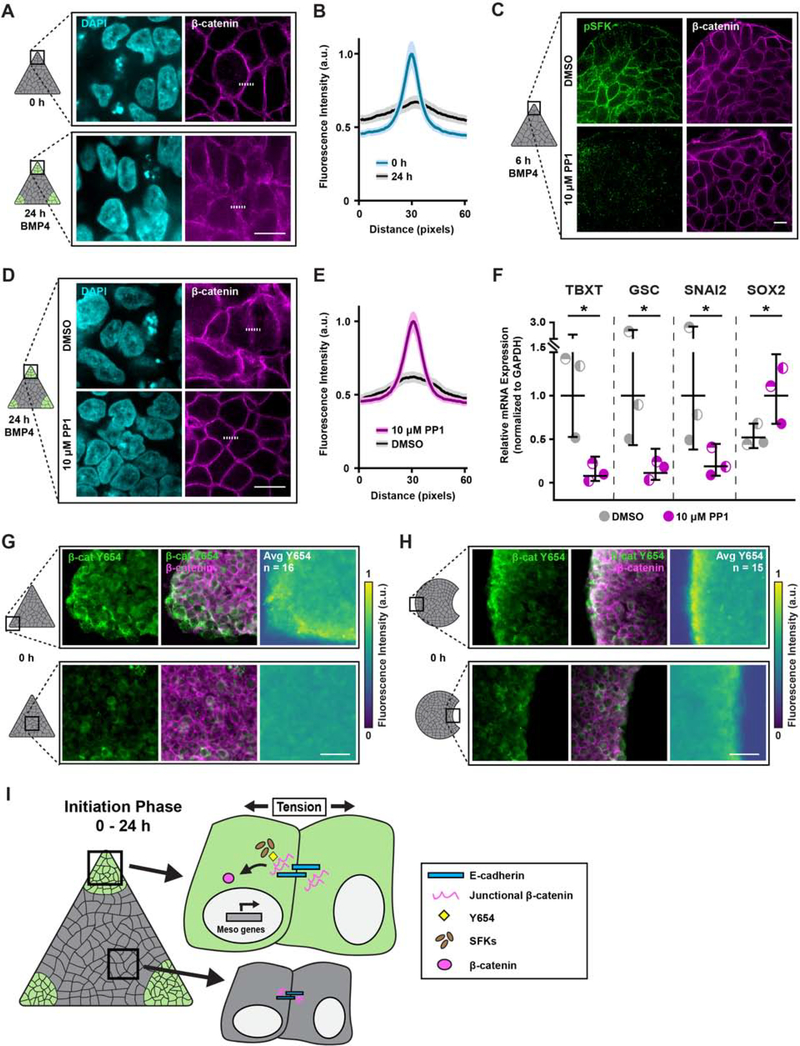
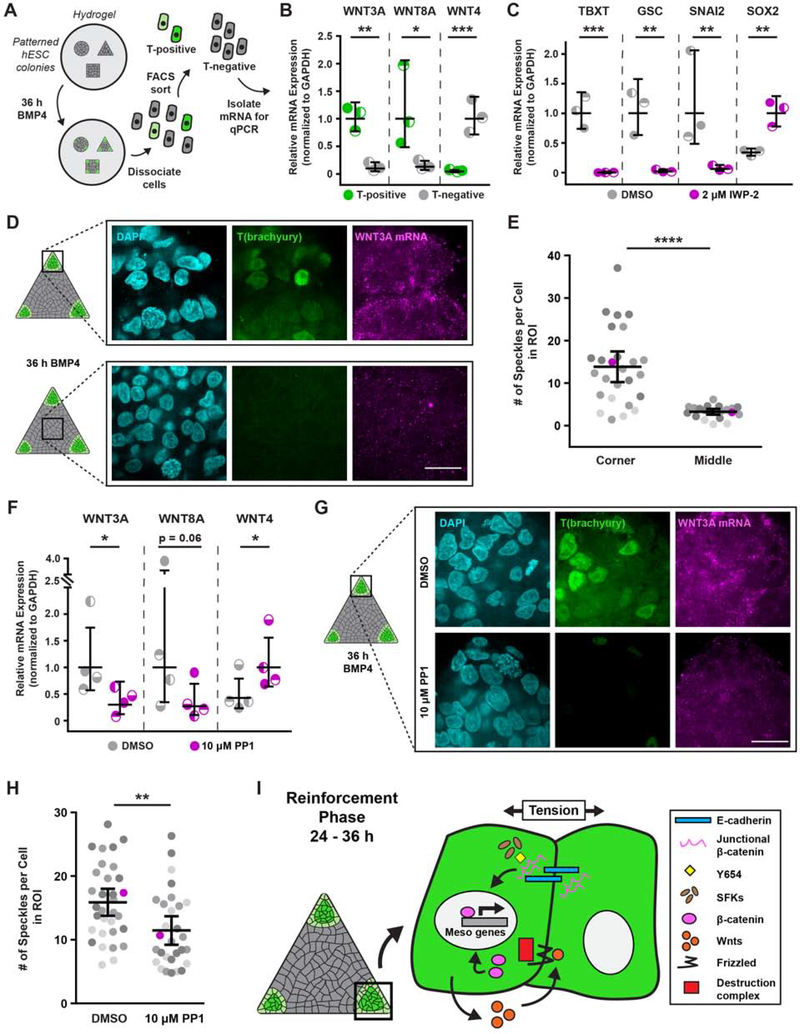
Embryogenesis is directed by morphogens that induce differentiation within a defined tissue geometry. Tissue organization is mediated by cell-cell and cell-extracellular matrix (ECM) adhesions and is modulated by cell tension and tissue-level forces. Whether cell tension regulates development by modifying morphogen signaling is less clear. Human embryonic stem cells (hESCs) exhibit an intrinsic capacity for self-organization, which motivates their use as a tractable model of early human embryogenesis. We engineered patterned substrates that recapitulate the biophysical properties of the early embryo and mediate the self-organization of "gastrulation-like" nodes in cultured hESCs. Tissue geometries that generated local nodes of high cell-adhesion tension directed the spatial patterning of the BMP4-dependent "gastrulation-like" phenotype by enhancing phosphorylation and junctional release of β-catenin to promote Wnt signaling and mesoderm specification. Furthermore, direct force application via mechanical stretching promoted BMP-dependent mesoderm specification, confirming that tissue-level forces can directly regulate cell fate specification in early human development.

Keywords: cytoskeletal tension; gastrulation; human embryonic stem cells; mesoderm; polyacrylamide hydrogels; self-organization; tissue patterning; traction force microscopy.


Conflict of interest statement

Declaration of Interests The authors declare no competing interests.

Figures

Figure 1:
Figure 1:. Compliant substrates promote hESC self-organization into “gastrulation-like” nodes.
(A) Cartoon of hESCs seeded on compliant (2,700 Pa) hydrogels and stimulated with BMP4. (B) Representative time-lapse images of hESC colonies stimulated with BMP4. White rectangles indicate the region shown magnified in subsequent panels. Dashed lines indicate node size measurement, as plotted in (E). Scale bars = 250 μm. (C) Representative Z-stack reconstruction of a “gastrulation-like” node after 48 h BMP4. Rectangle in (A) indicates imaged region. Scale bar = 10 μm. (D) Plot of the number of nodes formed between 24 and 48 h BMP4. n = 9 (3, 3, 3) colonies. (E) Plot of node size between 24 and 48 h BMP4. The dashed lines in (B) indicate node size measurement. Data points represent the size of each node identified from n = 9 colonies (3, 3, 3). (F) Representative images of T(brachyury) expression, E-cadherin, and composite in the “gastrulation-like” nodes at 48 h BMP4. Rectangle on colony cartoon indicates imaged region. Scale bar = 100 μm. (G) Representative images of T(brachyury) expression, Slug, and composite in the “gastrulation-like” nodes at 48 h BMP4. Rectangle on colony cartoon indicates imaged region. Scale bar = 100 μm. (H) Schematic of the “gastrulation-like” phenotype observed in hESC colonies on compliant hydrogels, compared to gastrulation in the embryo. Cross-sections along dashed lines depicted below. GN = gastrulation node. PS = primitive streak. EMT = epithelial to mesenchymal transition. For (D), (E): Data from independent experiments represented by different shades of gray and line and bars represent mean ± 95% CI. See also Figure S1, Video S1.
Figure 2:
Figure 2:. Real-time monitoring of hESC “gastrulation-like” nodes.
(A) Schematic representation of the T-mNeonGreen reporter system. (B) Representative images of T(brachyury) labeled by the T-reporter, an antibody to T, and composite. Scale bar = 20 μm. (C) Plot of fluorescence intensity of T-mNeonGreen versus T-antibody per segmented nuclei. n = 33 (10, 13, 10). (D) Cartoon of isolation protocol to compare gene expression between T-positive and T-negative cells. (E) Relative mesoderm gene expression levels in T-positive and T-negative cells at 36 h BMP4. (F) Representative time-lapse images of “gastrulation-like” nodes in the T-mNeonGreen reporter system. Rectangle on colony cartoon indicates imaged region. Dashed line indicates node size measurement, as plotted in (H). Scale bar = 100 μm. (G) Plot of the number of nodes formed between 24 and 48 h BMP4. n = 15 (5, 6, 4) colonies. (H) Plot of node size between 24 and 48 h BMP4. The dashed line in (F) indicates node size measurement. Data points represent the size of each node identified from n = 15 (5, 6, 4) colonies. For (C), (G), (H): Data from independent experiments represented by different shades of green. For (E), (G), (H): Line and bars represent mean ± 95% CI. HDR = homology-directed repair. a.u. = arbitrary units. TBXT = T-Box Transcription Factor T. GSC = goosecoid. *p < 0.05 and **p < 0.01. See also Figure S2, Videos S2–S4.
Figure 3:
Figure 3:. Cell-adhesion tension directs “gastrulation-like” node organization to specify mesoderm.
(A) Representative traction stress map of the periphery of unconfined hESC colonies prior to BMP4 stimulation. Rectangle on colony cartoon indicates measured region. (B) Brightfield and T-mNeonGreen images 48 h after BMP4 in the same field of view where traction stresses were measured in (A). (C) Representative brightfield images and corresponding traction stress maps measured for geometrically-confined hESC colonies on compliant gels before BMP4. (D) Representative brightfield and time-lapse images of T-mNeonGreen expression for triangle hESC colonies on compliant gels following BMP4 addition. (E) Map of average traction stresses measured for triangle hESC colonies before BMP4. n = 19 (3, 10, 6) colonies. (F) Normalized average intensity map of T-mNeonGreen expression within triangle hESC colonies at 30 h BMP4. n = 12 (3, 1, 7, 1) colonies. All scale bars = 250 μm. Pa = Pascals. a.u. = arbitrary units. See also Figures S3–S4, Video S5.
Figure 4:
Figure 4:. Cell-cell adhesion mediates the high tension required to develop “gastrulation-like” nodes.
(A) Relative CDH1 mRNA expression with and without shCDH1 knockdown. (B) Representative images of E-cadherin expression with and without shCDH1 knockdown. (C) Plot of relative E-cadherin mean fluorescence intensity with and without shCDH1 knockdown. Magenta data points correspond to the images shown in (B). n = 11 (2, 2, 7) control colonies and n = 10 (3, 2, 5) knockdown colonies. (D) Representative traction stress maps for triangle hESC colonies with and without shCDH1 knockdown. (E) Plot of the 99th percentile traction stress values from maps of triangle hESC colonies with and without shCDH1 knockdown. n = 13 (3, 2, 8) colony maps. Magenta data points correspond to representative maps in (D). (F) Representative images of T(brachyury) expression at 36 h BMP4 in triangle colonies with and without shCDH1 knockdown. (G) Plot of the % of nuclear area marked T-positive in triangle colonies with and without shCDH1 knockdown at 36 h BMP4. Magenta data points correspond to the images shown in (F). n = 14 (3, 3, 8) control colonies and n = 17 (2, 6, 9) knockdown colonies. For (A), (C), (E), (G): Line and bars represent mean ± 95% CI. For (C), (E), (G): Data from independent experiments represented by different shades of gray. All scale bars = 250 μm. KD = knockdown. Pa = Pascals. a.u. = arbitrary units. *p < 0.05 and **p < 0.01. See also Figure S5.
Figure 5:
Figure 5:. Ablating regions of high cell-adhesion tension inhibits, whereas mechanical stretching promotes mesoderm specification.
(A) Cartoon of eyebrow knife experiment. (B) Representative brightfield images and traction stress maps before and after eyebrow knife ablation. (C) Representative brightfield and time-lapse images of T-mNeonGreen expression following BMP4 stimulation for triangle hESC colonies with one corner ablated using the eyebrow knife prior to BMP4 addition. Arrow indicates site of eyebrow knife ablation. (D) Plot of time to T-mNeonGreen expression in the corners of triangle hESC colonies with and without eyebrow knife ablation. Line and bars represent mean ± 95% CI for n = 10 (2, 5, 3) colonies. (E) Representative traction stress map prior to BMP4 addition and corresponding time-lapse images of T-mNeonGreen expression following BMP4 stimulation for Pac-Man hESC colonies. Arrow indicates concave edge (“mouth”) of Pac-Man. (F) Map of average traction stresses measured for Pac-Man hESC colonies. n = 20 (3, 10, 4, 3) colonies. (G) Normalized average intensity map of T-mNeonGreen expression within Pac-Man hESC colonies at 30 h BMP4. n = 20 (3, 10, 4, 3) colonies. (H) Cartoon of mechanical stretching experiment and representative brightfield image of an hESC colony cultured on the stretching device. (I) Representative images of T-mNeonGreen expression for hESC colonies with and without mechanical stretching during 48 h BMP4. (J) Normalized average intensity maps of T-mNeonGreen expression for hESC colonies with and without mechanical stretching during 48 h BMP4. n = 27 (12, 8, 7) stretched colonies and n = 39 (21, 10, 8) control colonies. For (A)-(G): Scale bars = 250 μm. For (H)-(J): Scale bars = 100 μm. Pa = Pascals. Avg = average. a.u. = arbitrary units. *p < 0.05.
Figure 6:
Figure 6:. High tension promotes β-catenin release from adherens junctions to specify mesoderm.
(A) Representative images of β-catenin expression in the corners of triangle hESC colonies before and 24 h after BMP4. (B) Plot of mean (solid line) ± 95% CI (shaded regions) fluorescence intensity of β-catenin at cell junctions in the corners of triangle hESC colonies before and 24 h after BMP4 stimulation. Dashed lines in (A) indicate plotted fluorescence intensity profiles. N = 130 profiles per condition from n = 26 (9, 8, 9) imaged colony corner ROIs. (C) Representative images of phosphorylated Src-family kinase (pSFK) and β-catenin expression in the corners of triangle hESC colonies after 6 h BMP4 plus vehicle (DMSO) or Src inhibitor (PP1; 10 μM). (D) Representative images of β-catenin expression in the corners of triangle hESC colonies after 24 h BMP4 plus vehicle (DMSO) or Src inhibitor (PP1; 10 μM). (E) Plot of mean (solid line) ± 95% CI (shaded regions) fluorescence intensity of β-catenin at cell junctions in the corners of triangle hESC colonies after 24 h BMP4 plus vehicle (DMSO) or Src inhibitor (PP1; 10 μM). Dashed lines in (D) indicate plotted fluorescence intensity profiles. N = 130 profiles per condition from n = 26 (9, 8, 9) imaged colony corner ROIs. (F) Relative mesoderm gene expression levels after 36 h BMP4 plus vehicle (DMSO) or Src inhibitor (PP1; 10 μM). Line and bars represent mean ± 95% CI. (G) Representative images of β-catenin Y654 (green; left), composite β-catenin Y654 and normal β-catenin (merge; middle), and normalized average intensity map of β-catenin Y654 expression (right) within triangle hESC colonies prior to BMP4. n = 16 (3, 7, 6) colonies. (H) Representative images of β-catenin Y654 (green; left), composite β-catenin Y654 and normal β-catenin (merge; middle), and normalized average intensity map of β-catenin Y654 expression (right) within Pac-Man hESC colonies prior to BMP4. n = 15 (5, 5, 5) colonies. (I) Cartoon summarizing the mechanism by which regionally-localized high cell-adhesion tension exposes β-catenin Y654 to facilitate its phosphorylation and subsequent release, mediated by pSFKs, upon BMP4 stimulation. For (A), (C), (D): Scale bars = 10 μm. For (G), (H): Scale bars = 50 μm. Rectangles on colony cartoons indicate imaged regions. β-cat Y654 = tyrosine 654 of β-catenin. pSFK = phosphorylated Src-family kinases. TBXT = T-Box Transcription Factor T. GSC = goosecoid. a.u. = arbitrary units. Avg = average. *p < 0.05. See also Figure S6.
Figure 7:
Figure 7:. Wnt signaling reinforces mesoderm specification in regions of high tension.
(A) Cartoon of isolation protocol to compare Wnt ligand expression between T-positive and T-negative cells. (B) Relative Wnt ligand expression levels in T-positive and T-negative hESCs after 36 h BMP4. (C) Relative mesoderm gene expression levels after 36 h BMP4 plus vehicle (DMSO) or Wnt inhibitor (IWP-2; 2 μM). (D) Representative images of T(brachyury) protein expression and in-situ-detected WNT3A mRNA in the corner and middle of triangle hESC colonies after 36 h BMP4. (E) Plot of in-situ-detected WNT3A speckles in the corner and middle of hESC colonies after 36 h BMP4. Magenta data points correspond to images shown in (D). n = 26 (4, 12, 10) imaged corner ROIs and n = 20 (3, 8, 9) imaged middle ROIs. (F) Relative Wnt ligand expression levels after 36 h BMP4 plus vehicle (DMSO) or Src inhibitor (PP1; 10 μM). (G) Images of T(brachyury) protein expression and in-situ-detected WNT3A mRNA in the corners of triangle hESC colonies after 36 h BMP4 plus vehicle (DMSO; top) or Src inhibitor (PP1; 10 μM; bottom). (H) Plot of in-situ-detected WNT3A speckles in the corners of triangle hESC colonies after 36 h BMP4 plus vehicle (DMSO) or Src inhibitor (PP1; 10 μM). Magenta data points correspond to images in (G). n = 26 (4, 12, 10) imaged ROIs from DMSO condition and n = 20 (3, 8, 9) imaged ROIs from PP1 condition. (I) Cartoon summarizing the mechanism by which regions of high cell-adhesion tension direct mesoderm specification. The Src-mediated release of junctional β-catenin feeds forward and upregulates Wnt ligand expression to promote mesoderm specification. For (B), (C), (E), (F), (H): Line and bars represent mean ± 95% CI. For (E), (H): Data from independent experiments represented by different shades of gray. Rectangles on colony cartoons indicate imaged regions. All scale bars = 20 μm. *p < 0.05, **p < 0.01, ***p < 0.001, and ****p < 0.0001. See also Figure S7.

Comment in

References

    1. Beccari L, Moris N, Girgin M, Turner DA, Baillie-Johnson P, Cossy AC, Lutolf MP, Duboule D, Arias AM, 2018. Multi-axial self-organization properties of mouse embryonic stem cells into gastruloids. Nature 562(7726), 272–276. - PubMed
    1. Berg S, Kutra D, Kroeger T, Straehle CN, Kausler BX, Haubold C, Schiegg M, Ales J, Beier T, Rudy M, Eren K, Cervantes JI, Xu B, Beuttenmueller F, Wolny A, Zhang C, Koethe U, Hamprecht FA, Kreshuk A, 2019. ilastik: interactive machine learning for (bio)image analysis. Nat. Methods. 1–7. - PubMed
    1. Bertocchini F, Stern CD, 2002. The hypoblast of the chick embryo positions the primitive streak by antagonizing nodal signaling. Dev. Cell. 3(5), 735–744. - PubMed
    1. Bienz M, 2005. β-catenin: A pivot between cell adhesion and Wnt signalling. Curr. Biol. 15(2), R64–R67. - PubMed
    1. Biguri A, 2020. Perceptually uniform colormaps. (https://www.mathworks.com/matlabcentral/fileexchange/51986-perceptually-...), MATLAB Central File Exchange; Retrieved April 24, 2020.

Publication types