. 2021 Jan 11;56(1):95-110.e10.
doi: 10.1016/j.devcel.2020.10.014. Epub 2020 Nov 17.

Stromal SOX2 Upregulation Promotes Tumorigenesis through the Generation of a SFRP1/2-Expressing Cancer-Associated Fibroblast Population

Affiliations

Stromal SOX2 Upregulation Promotes Tumorigenesis through the Generation of a SFRP1/2-Expressing Cancer-Associated Fibroblast Population

Hiroaki Kasashima et al. Dev Cell. .

Abstract

Cancer-associated fibroblasts (CAFs) promote tumor malignancy, but the precise transcriptional mechanisms regulating the acquisition of the CAF phenotype are not well understood. We show that the upregulation of SOX2 is central to this process, which is repressed by protein kinase Cζ (PKCζ). PKCζ deficiency activates the reprogramming of colonic fibroblasts to generate a predominant SOX2-dependent CAF population expressing the WNT regulator Sfrp2 as its top biomarker. SOX2 directly binds the Sfrp1/2 promoters, and the inactivation of Sox2 or Sfrp1/2 in CAFs impaired the induction of migration and invasion of colon cancer cells, as well as their tumorigenicity in vivo. Importantly, recurrence-free and overall survival of colorectal cancer (CRC) patients negatively correlates with stromal PKCζ levels. Also, SOX2 expression in the stroma is associated with CRC T invasion and worse prognosis of recurrence-free survival. Therefore, the PKCζ-SOX2 axis emerges as a critical step in the control of CAF pro-tumorigenic potential.

Keywords: CMS4; PKCz; SFRP; SOX2; TGFβ; atypical PKCs; cancer-associated fibroblasts; colorectal cancer; metastasis; stroma.


Conflict of interest statement

Declaration of Interests The authors declare no competing interests.

Figures

Figure 1.
Figure 1.. PKCζ expression is reduced in the stroma of human colorectal cancer
(A) PRKCZ mRNA levels in stroma of human cancer samples. Data were collected from GSE35602 (CRC, n = 17), GSE83591 (breast cancer, n = 53), and GSE22863 (lung cancer, n = 30). (B) PRKCZ mRNA levels in isolated fibroblasts of colon cancer in dataset GSE70468 (n = 14). NF: normal fibroblasts; CAF: cancer associated fibroblasts. (C and D) PKCζ staining (red) with Vimentin (green) (C) and quantification (D) in human CRC samples and normal counterparts (n = 8, paired). Scale bars, 50 μm. (E and F) Stromal PKCζ immunohistochemistry (E) and quantification (F) of human normal colon, n = 20, sessile serrated adenoma/polyps (SSA/Ps; n = 30), and tubular adenomas (TAs; n = 30). Scale bars, 50 μm. (G and H) Low PKCζ expression in stroma is a predictor of aggressive CRC and poor survival. PKCζ staining in a human cohort of CRC samples (n = 155) (G). Kaplan-Meier curve for 5-year recurrence-free survival and 7-year overall survival of CRC patients according to PKCζ expression (H). (I) Correlation between PKCζ expression in CRC stroma and CMS subtypes (n = 129). (J) Tgfb1, Tgfb2 and Tgfb3 mRNA levels of normal intestinal organoids and MTOs (n = 3). (K and L) Prkcz mRNA levels of CFs stimulated by conditioned medium (CM) of MTOs for 48 or 72 h (n = 3). Schematic representation (K) and qPCR (K). (M) Prkcz and Acta2 mRNA levels of CFs with TGFβ stimulation for 48 h (n = 3). (N) PRKCZ mRNA levels in APC-KO human intestine organoids treated for 24 h with 0.5 μM TGFβ (GSE145308). (O) Prkcz mRNA levels of CFs with Galunisertib (Gal) treatment for 48 h (n = 3, 10 μM). (P and Q) Prkcz mRNA levels of CFs stimulated by CM of normal organoids or MTOs with or without Gal (10 μM) for 72 h (n = 3). Schematic representation (P) and qPCR (Q). (R) Prkcz mRNA levels of CFs stimulated by TGFβ (10 ng/ml) with or without Trichostatin A (TSA) treatment (100 nM) for 48 h (n = 3). (S) Schematic representation of the epigenetic status of the PRKCZ locus in human normal colon crypts and metastases-derived primary CRC cell lines (GSE36204), and in CRC cell lines (GSE73319). H3K27Ac occupancy of PRKCZ promoter in human normal colon crypts and metastases-derived primary CRC cell lines (GSE36204), and in CRC cell lines (GSE73319) analyzed by ChIP-seq. Predicted SMAD3/4 and E2F4 binding sites in PRKCZ promoter by JASPAR, including relative score and sequence. SMAD3/4 and E2F4 binding motifs from JASPAR. Results are shown as mean ± s.e.m. *p<0.05, **p<0.01, ***p<0.001, ****p<0.0001. See also Figure S1 and Table S1.
Figure 2.
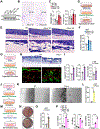
Figure 2.. Prkcz−/− colonic fibroblasts have CAF characteristics
(A-C) Prkcz−/− CFs show more migration and invasion activity. Immunoblot of the indicated proteins in WT or Prkcz−/− CFs (A), crystal violet staining of invading MC-38 cells in response to CM of WT or Prkcz−/− CFs (B) and quantification (n = 3) (C). Scale bars, 100 μm. (D-F) 3D Organotypic cultures of MC-38 cells with WT or Prkcz−/− CFs (n = 3). Schematic representation (D), H&E staining (E); and quantification of cell invasion (F). Scale bars, 100 μm. (G-I) 3D Organotypic cultures of MTOs with WT or Prkcz−/− CFs (n = 3). Schematic representation (G), H&E staining (top), E-cadherin (green, bottom) and Vimentin (red, bottom) staining (H) and quantification (l) of cell invasion. Scale bars, 100 μm. (J-L) Direct co-culture assays of MTOs and WT or Prkcz−/− CFs (n = 3). Schematic representation (J), microscopic images (K) and quantification of migrating MTOs (L). Scale bars, 50 μm. (M-O) ECM remodeling assay with WT or Prkcz−/− CFs (n = 3). Schematic representation (M), microscopic images (N) and quantification (O). Scale bar, 1 mm. (P) Relative mRNA expression of the indicated genes in WT or Prkcz−/− CFs (n = 3). Results are shown as mean ± s.e.m. *p<0.05, **p<0.01, ***p<0.001, ****p<0.0001. See also Figure S2.
Figure 3.
Figure 3.. Deletion of PKCζ in colonic fibroblasts promotes tumorigenesis in vivo
(A-C) Staining of colon sections from Fsp1-CreR26RTdT mice with Vimentin, PDGFRβ, Collagen I, E-cadherin and CD45 (green) and RFP (red) (A), schematic representation of the Fsp1 and R26RTdT locus (B) and quantification (C) (n = 6). Scale bars, 50 μm. (D and E) PKCζ staining (red) with Vimentin (green) (D) and quantification (E) of colon sections from Prkczf/f and Prkczf/f;Fsp1-Cre mice (n = 5). Scale bars, 50 μm. (F-I) Prkczf/f, n = 7, and Prkczf/f;Fsp1-Cre, n = 5, mice (male, 8-10 weeks-old) treated with the azoxymethane (AOM)/DSS protocol. Experimental design (F), macroscopic images (G), quantification of the tumor number (H) and Masson Trichrome staining of colon tumors (I). Scale bars, 1 mm (G), 50 μm (I). (J-O) Orthotopic inoculation of MTOs in Prkczf/f and Prkczf/f;Fsp1-Cre, n = 5 mice (male, 6-8 weeks-old) per condition. Experimental design (J), gross images (K), quantification of tumor diameter, number of lymph node metastases and metastasis incidence (L), H&E staining liver and lung metastasis (M), Masson Trichrome staining of tumors (N) and ζSMA staining of the tumors (O). Scale bars, 5 mm (K), 50 μm (M, N and O). (P-T) Co-implantation into cecum of WT mice (female, 12-18 weeks-old) of MTOs mixed with WT or Prkcz−/− CFs (WT, n = 5; Prkcz−/−, n = 7). Experimental design (P), gross images (Q), quantification of tumor diameter, number of lymph node metastases and metastasis incidence (R), H&E staining of liver and lung metastasis (S) and Masson Trichrome staining of tumors (T). Scale bars, 5 mm (Q) and 50 μm (S and T). Results are shown as mean ± s.e.m. *p<0.05, **p<0.01, ***p<0.001. See also Figure S3.
Figure 4.
Figure 4.. SOX2 is a key transcription factor for fibroblasts activation by PKCζ loss
(A) Top CAF and ECM remodeling pathways from GSEA of Prkcz−/− versus WT colonic fibroblasts (CFs), n = 3, using compilations H and C5 (MSigDB). ECM, Extracellular matrix. (B) Scatterplot of mRNA expression and PageRank z-score for transcription factor genes upregulated in Prkcz−/− CFs. (C) Upstream regulator analysis of the top ranked genes from ATAC-Seq data in Prkcz−/− versus WT CFs. (D) Volcano plot of RNA-Seq of Prkcz−/− versus WT CFs. The purple dots represent predicted SOX2 target genes. (E and F) SOX2 staining (red) with Vimentin (green) (E) and quantification (F) in human CRC samples and normal counterparts (n = 8, paired). (G) SOX2 staining in human CRC samples. (H) Kaplan-Meier curve for 5-year recurrence-free survival of CRC patients according to SOX2 expression in stroma (n = 155). (I) Correlation between PKCζ and SOX2 expressions in CRC stroma (n = 155). (J) Correlation between SOX2 expression in CRC stroma and CMS subtypes (n = 129). (K) SOX2 staining of tumors induced by AOM-DSS treatment in Prkczf/f and Prkczf/f;Fsp1-Cre mice. Scale bar, 50 μm. (L and M) SOX2 staining (green) with HA (red) (L) and quantification (M) in Prkcz−/− versus WT CFs. (N) qPCR of miR-200s in Prkcz−/− versus WT CFs, (n = 3). (O and P) qPCR for Sox2 mRNA (O) and immunoblot for SOX2 (P) in Prkcz−/− CFs rescued with miR-200b, (n = 3). Results are shown as mean ± s.e.m. *p<0.05, **p<0.01, ***p<0.001, ****p<0.0001. See also Figure S4 and Table S1.
Figure 5.
Figure 5.. Sox2 deletion in Prkcz−/− colonic fibroblasts rescues the CAF phenotype
(A) Top CAF and ECM remodeling pathways from GSEA of downregulated genes in Prkcz−/− sgSox2 versus Prkcz−/−sgScr CFs (n = 4) using H and C5 compilations (MSigDB). ECM, Extracellular matrix. (B) GSEA plots of enrichment in CAF signature in GSE56710 for WT sgScr versus Prkcz−/−sgScr CFs (left) and Prkcz−/−sgSox2 versus Prkcz−/−sgScr CFs (right) (n = 4). (C and D) Heatmap of reverted genes by Sox2 deletion associated with “EMT geneset” (C) and “TGFβ and WNT geneset” (D) in Prkcz−/− CFs. (E) mRNA levels of the indicated genes in WT sgScr, Prkcz−/− sgScr and Prkcz−/−sgSox2 CFs (n = 3). (F-J) Orthotopic inoculation into WT mice (female, 7-11 weeks-old) of MTOs mixed with WT sgScr, Prkcz−/−sgScr or Prkcz−/−sgSox2 CFs (WT sgScr, n = 10; Prkcz−/−sgScr, n = 7; Prkcz−/− sgSox2, n = 7). Experimental design (F), gross images (G), quantification of tumor diameter, number of lymph node and metastasis incidence (H), H&E staining of liver and lung metastasis (I) and Masson Trichrome staining of tumors (J). Scale bars, 5 mm (G), 50 μm (J). Results are shown as mean ± s.e.m. *p<0.05, **p<0.01, ***p<0.001. See also Figure S5.
Figure 6.
Figure 6.. scRNA-Seq identifies a switch in CAF subtypes and Sfrp1/2 as direct target of SOX2 in Prkcz−/− fibroblasts
(A) Experimental design of orthotopic inoculation of MTOs in Prkczf/f and Prkczf/f;Fsp1-Cre mice (male, 10 weeks-old) for scRNA-Seq. (B and C) Uniform Manifold Approximation and Projection (UMAP) plot with clustering results colored by sample (B) and by the major cellular compartments (C). (D) UMAP plot with reclustering of fibroblasts, split by sample. (E) Stacked bar plots showing the percentage of fibroblasts in each cluster. (F) Heatmap of the top-5 genes for each cluster. (G) Relative mRNA expression in CFs of indicated genotype (n = 3). (H) Primer design and ChIP-qPCR analysis of Sfrp1 and Sfrp2 promoter occupancy of SOX2 (n = 3). (I) SFRP1 (left) and SFRP2 (right) staining (red) with Vimentin (green) in sections from orthotopic tumors in Prkczf/f and Prkczf/f;Fsp1-Cre mice. (J-M) Orthotopic inoculation into WT mice (female, 10-13 weeks-old) of MTOs mixed with WTsgScr, Prkcz−/−sgScr or Prkcz−/−sgSfrp2 Colonic fibroblasts (WTsgScr, n = 8; Prkcz−/−sgScr, n = 9; Prkcz−/−sgSox2, n = 8). Experimental design (J), gross images (K), quantification of tumor diameter and number of lymph node metastases (L) and Masson Trichrome staining of tumors (M). Scale bars 5 mm (K), 50 μm (M). Results are shown as mean ± s.e.m. *p<0.05, **p<0.01, ***p<0.001, ****p<0.0001. See also Figure S6 and Table S2.
Figure 7.
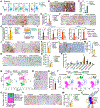
Figure 7.. Loss of stromal PKCζ reprograms the tumor epithelium and the immune microenvironment in vivo
(A) Violin plots for the indicated gene signatures in epithelial cells from orthotopic tumors in rectum of Prkczf/f and Prkczf/f;Fsp1-Cre mice. (B and C) β-catenin staining (B) and quantification (C) of tumors induced by AOM-DSS treatment in Prkczf/f and Prkczf/f;Fsp1-Cre mice. Scale bar, 25 μm. (D and E) β-catenin staining (D) and quantification (E) of orthotopic tumors co-implanted in WT mice (female, 10-13 weeks old) with MTOs and WTsgScr or Prkcz−/−sgScr or Prkcz−/−sgSfrp2 CFs. Scale bar, 25 μm. (F and G) Cleaved Notch staining (D) and quantification (E) of orthotopic tumors described in (D). Scale bar, 25 μm. (H and I) qPCR analysis of β-catenin and Notch-related genes of MC38 cells stimulated by conditioned medium (CM) of CFs for 72 h (n = 3). Schematic representation (H) and qPCR (I). (J and K) Phospho-Stat1 staining (J) and quantification (K) of orthotopic tumors described in (D). Scale bar, 25 μm. (L and M) CD8 staining (L) and quantification (M) of tumors described in (B). Scale bar, 50 μm. (N and O) CD8 staining (N) and quantification (O) orthotopic tumors described in (D). Scale bar, 50 μm. (P) Flow-cytometry analysis of immune cell populations in orthotopic tumors co-implanted with MTOs and WT or Prkcz−/− colonic fibroblasts (WT, n = 3; Prkcz−/−, n = 3). (Q) UMAP plot of the immune compartment colored by major immune cell types from orthotopic tumors described in (A). (R and S) B220 staining (R) and quantification (S) of tumors described in (B). Scale bar, 50 μm. (T) UMAP plot of the immune compartment from orthotopic tumors described in (D). (U) Stacked bar plots of the percentage of cells in immune compartment. (V and W) B220 staining (V) and quantification (W) of orthotopic tumors described in (D). Scale bar, 50 μm. (X) Heatmap of chemokine expression in epithelial cells of orthotopic tumors described in (D). Results are shown as mean ± s.e.m. *p<0.05, ** p<0.01, ***p<0.001.

Comment in

References

    1. Becht E, de Reynies A, Giraldo NA, Pilati C, Buttard B, Lacroix L, Selves J, Sautes-Fridman C, Laurent-Puig P, and Fridman WH (2016). Immune and Stromal Classification of Colorectal Cancer Is Associated with Molecular Subtypes and Relevant for Precision Immunotherapy. Clin Cancer Res 22, 4057–4066. - PubMed
    1. Bhowmick NA, Chytil A, Plieth D, Gorska AE, Dumont N, Shappell S, Washington MK, Neilson EG, and Moses HL (2004). TGF-beta signaling in fibroblasts modulates the oncogenic potential of adjacent epithelia. Science 303, 848–851. - PubMed
    1. Butler A, Hoffman P, Smibert P, Papalexi E, and Satija R (2018). Integrating single-cell transcriptomic data across different conditions, technologies, and species. Nat Biotechnol 36, 411–420. - PMC - PubMed
    1. Calon A, Lonardo E, Berenguer-Llergo A, Espinet E, Hernando-Momblona X, Iglesias M, Sevillano M, Palomo-Ponce S, Tauriello DV, Byrom D, et al. (2015). Stromal gene expression defines poor-prognosis subtypes in colorectal cancer. Nat Genet 47, 320–329. - PubMed
    1. Calvo F, Ege N, Grande-Garcia A, Hooper S, Jenkins RP, Chaudhry SI, Harrington K, Williamson P, Moeendarbary E, Charras G, and Sahai E (2013). Mechanotransduction and YAP-dependent matrix remodelling is required for the generation and maintenance of cancer-associated fibroblasts. Nat Cell Biol 15, 637–646. - PMC - PubMed

Publication types

MeSH terms