. 2021 Jan:148:105183.
doi: 10.1016/j.nbd.2020.105183. Epub 2020 Nov 15.

Recurrent limbic seizures do not cause hippocampal neuronal loss: A prolonged laboratory study

Affiliations

Recurrent limbic seizures do not cause hippocampal neuronal loss: A prolonged laboratory study

Gary W Mathern et al. Neurobiol Dis. 2021 Jan.

Abstract

Purpose: It remains controversial whether neuronal damage and synaptic reorganization found in some forms of epilepsy are the result of an initial injury and potentially contributory to the epileptic condition or are the cumulative affect of repeated seizures. A number of reports of human and animal pathology suggest that at least some neuronal loss precedes the onset of seizures, but there is debate over whether there is further damage over time from intermittent seizures. In support of this latter hypothesis are MRI studies in people that show reduced hippocampal volumes and cortical thickness with longer durations of the disease. In this study we addressed the question of neuronal loss from intermittent seizures using kindled rats (no initial injury) and rats with limbic epilepsy (initial injury).

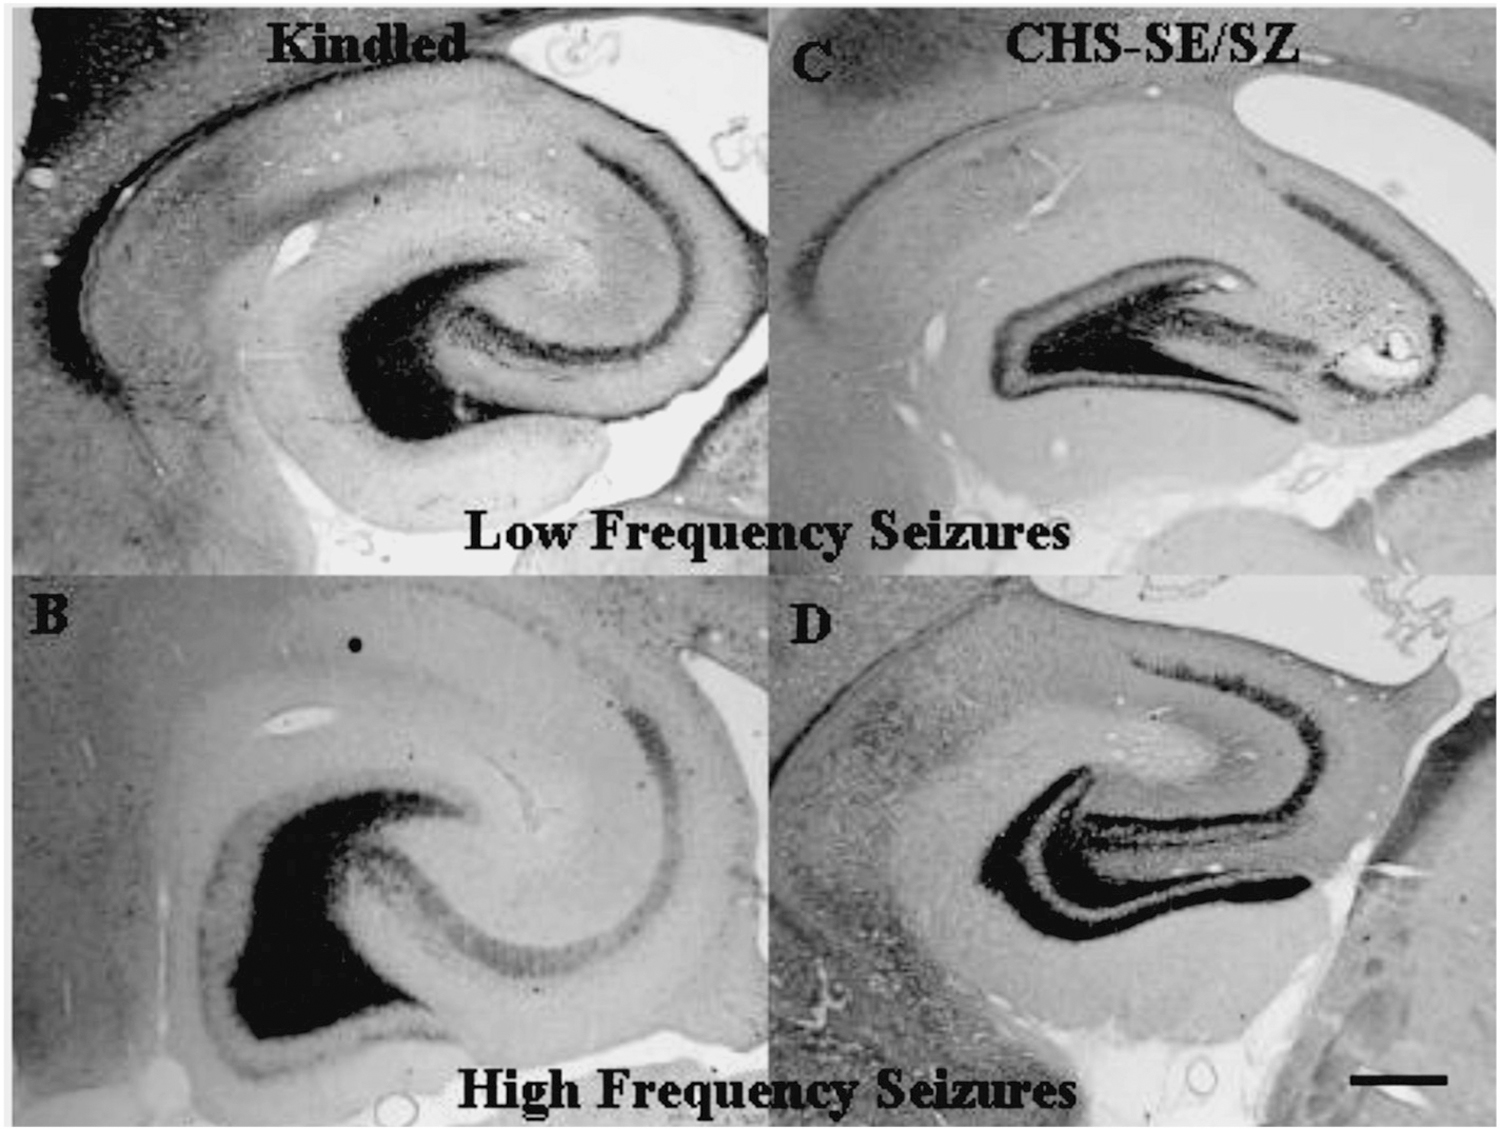
Methods: Supragranular mossy fiber sprouting, hippocampal neuronal densities, and subfield area measurements were determined in rats with chronic limbic epilepsy (CLE) that developed following an episode of limbic status epilepticus (n = 25), in kindled rats (n = 15), and in age matched controls (n = 20). To determine whether age or seizure frequency played a role in the changes, CLE and kindled rats were further classified by seizure frequency (low/high) and the duration of the seizure disorder (young/old).

Results: Overall there was no evidence for progressive neuronal loss from recurrent seizures. Compared with control and kindled rats, CLE animals showed increased mossy fiber sprouting, decreased neuronal numbers in multiple regions and regional atrophy. In CLE, but not kindled rats: 1) Higher seizure frequency was associated with greater mossy fiber sprouting and granule cell dispersion; and 2) greater age with seizures was associated with decreased hilar densities, and increased hilar areas. There was no evidence for progressive neuronal loss, even with more than 1000 seizures.

Conclusion: These findings suggest that the neuronal loss associated with limbic epilepsy precedes the onset of the seizures and is not a consequence of recurrent seizures. However, intermittent seizures do cause other structural changes in the brain, the functional consequences of which are unclear.

Keywords: Axon plasticity; Epilepsy pathology; Epileptogenesis; Mossy fibers; Pathogenesis; Temporal lobe epilepsy.


Figures

Fig. 1.
Fig. 1.
Micrographs showing hippocampi from Electrode Control (Panels A & D), kindled (Panels B & E), and CLE rats (Panels C & F) for Nissl stain (CV; left column) and neo-Timm’s histochemistry (right column). All animals were 3 to 4 months old when tissue processed. The kindled rat had 16 stimulated stage 5 seizures per week for a total of 80 events. The CLE rat averaged 2.5 spontaneous seizures per week for a total of 107 seizures. Panel A: Electrode Control with the labeled hippocampal subfields used for neuron counts. Notice the electrode tract between the upper SG blade and CA1 stratum pyramidale. Panel B: Kindled rat hippocampus showed no visible neuron loss compared with the Electrode Control. Panel C: The CLE rat showed diffuse hippocampal neuron loss, signs of focal granule cell dispersion (arrow), and loss of stratum radiatum thickness (asterisks). Panels D: The neoTimm’s stain shows a normal pattern in the Electrode Control rat with no staining in the inner molecular layer (IML). Panel E: The kindled rat showed minimal IML neoTimm’s staining (arrowheads). Panel F: The CLE rat showed significant IML neoTimm’s staining (arrowheads). All panels of equal magnification; calibration bar equals 500 μm.
Fig. 2.
Fig. 2.
Nissl sections illustrating hippocampal anatomic changes in older rats. Panel A: A 17 month old Electrode control rat for comparison with the other panels. Panel B: This CLE rat had 1.5 spontaneous seizures per week for a total of 15 seizures. There is hippocampal neuron loss, hilar atrophy (asterisk), and diffuse granule cell dispersion (arrowheads). Panel C: Kindled rat with 24 stimulated events per week for a total of 384 seizures over 6.5 months. Visually, there are no qualitative anatomic differences compared with the older control rat (Panel A). Panel D: This older CLE rat averaged 0.5 seizures per week for a total of 40 recorded seizures over 14 months. The hilar area is larger than the other examples (asterisk)and, as in Panel B, there is diffuse dispersion of the granule cells. All panels of equal magnification; calibration bar equals 500 μm.
Fig. 3.
Fig. 3.
Bar graphs showing hippocampal subfield areas (top row) neuron densities (middle row) and total estimated neurons per region for controls (n = 20), kindled (n = 15), and CLE (n = 25) rats. Significant post-hoc differences are indicated by asterisks. Area measures: CLE rats showed decreased subfield areas compared with Kindled and control rats for CA3 SP (post-hoc; p = 0.047). Neuron counts: CLE rats showed decreased densities compared with Kindled and control rats for SG, (p < 0.0001), CA3 (p < 0.0001), and CA1 (p < 0.001). Total neuron numbers: CLE rats showed decreased total neuron numbers compared with Kindled and control rats for SG (p = 0.045), hilus (p = 0.004), CA3 (p < 0.001), and CA1 (p = 0.021).
Fig. 4.
Fig. 4.
Neo-Timm’s staining in kindled (left column) and CLE rats (right column) with low (top row) and high seizure frequencies (bottom row). Panel A: Kindled rat with 3 stage 5 seizures per week over 7 weeks for a total of 21 seizures, and sacrificed 3 months after electrode implantation. There is no visible IML neoTimm’s stain. Panel B: Kindled rat with 24 kindled seizures per week for a total of 912 events, and sacrificed 9.5 months after implantation. There is some neoTimm’s IML puncta, which was the most stain observed in all of our kindled rats. Panel C: CLE rat averaged 1.5 spontaneous seizures per week for a total of 15 recorded events, and sacrificed at 4 months. Sprouting was unilateral and greater than the kindled rat with a higher weekly seizure frequency (Panel B). Panel D: Another CLE rat averaged 32 seizures per week for a total of 157 seizures, and was killed at 3 months. There was bilateral aberrant IML mossy fiber sprouting, which was greater than the low frequency CLE rat (Panel C). All panels of equal magnification; calibration bar equals 500 μm.
Fig. 5.
Fig. 5.
Micrographs of asymmetric Timm’s staining in a CLE rat 4 months following SE with 29 total recorded seizures. Note that the absent supragranular staining is in the more atrophic hippocampus. Both micrographs at same magnification.
Fig. 6.
Fig. 6.
Mossy fiber sprouting. Quantitative comparison among the three primary groups and for kindled and CLE rats based on numbers of seizures and duration of seizure disorder as determined by inner molecular layer-outer molecular layer gray value ratios.. Top: only the CLE rats had a significant increase in mossy fiber staining. Middle: only the CLE rats with high frequency seizures had a significant increase in staining compared rats with lower frequency seizures (Kindled rats: <100 seizures n = 8; >100 seizures n = 7; CLE rats <100 seizures n = 13; >100 seizures n = 12). Bottom: the duration of the epilepsy played some role, as the CLE animals with longer durations of the disorder also had significantly greater staining compared to CLE animals with shorter duration epilepsy (Kindled rats: <6 months n = 8; >6 months n = 7; CLE rats <6 months n = 14; >6 months n = 11).
Fig. 7.
Fig. 7.
Bar graphs showing differences with longer seizure durations for adjusted neuronal numbers in the hilus and CA1 pyramidal cell layer for kindled and TLE rats. Left Graph: Hilar neuronal numbers were decreased in TLE rats, but there were no differences between the younger and older rats. Right Graph: Similarly, the adjusted numbers in the CA1 pyramidal layer were lower in the TLE rats compared to kindled animals, but duration of disease did not affect these numbers. (p < 0.05 hilus) (Kindled rats: <6 months n = 8; >6 months n = 7; CLE rats <6 months n = 14; >6 months n = 11).
Fig. 8.
Fig. 8.
Bar graphs showing differences with greater seizure number for adjusted neuronal numbers in the hilus and CA1 pyramidal cell layer for kindled and TLE rats. Left Graph: Hilar neuronal numbers were decreased in TLE rats, but there were no differences between the rats based on total seizure number. Right Graph: Similarly, the adjusted numbers in the CA1 pyramidal layer were lower in the TLE rats compared to kindled animals, but number of seizures did not affect these numbers. (p < 0.05) (Kindled rats: <100 seizures n = 8; 0.100 seizures n = 7; CLE rats <100 seizures n = 13; >100 seizures n = 12).
Fig. 9.
Fig. 9.
Relationship in the CLE rats between total number of seizures and IML-OML mossy fiber staining (top) and hilar area. In both cases there is a relation between both measures and the number of seizures. On the left the graphs show the data for all of the CLE animals and on the right with the rats with over 4000 seizures removed. Note that the vertical axis is different for all rats compared to the rats with fewer seizures. The vertical dotted lines in the graphs on the left define the limits of the seizure number that are displayed on the right (right graphs remove the 3 rats with the greatest number of seizures.

References

    1. Adams B, Von Ling E, Vaccarella L, Ivy GO, Fahnestock M, Racine RJ, 1998. Time course for kindling-induced changes in the hilar area of the dentate gyrus: reactive gliosis as a potential mechanism. Brain Res 804, 331–336. - PubMed
    1. Babb TL, Brown WJ, 1987. Pathological findings in epilepsy In: Engel J Jr. (Ed.), Surgical Treatment of the Epilepsies. Raven Press, New York, pp. 511–540.
    1. Bernhardt BC, Worsley KJ, Kim H, Evans AC, Bernasconi A, Bernasconi N, 2009. Longitudinal and cross-sectional analysis of atrophy in pharmacoresistant temporal lobe epilepsy. Neurology 72, 1747–1754. - PMC - PubMed
    1. Bertram EH, 1997. Functional anatomy of spontaneous seizures in a rat model of limbic epilepsy. Epilepsia 38, 95–105. - PubMed
    1. Bertram EH 3rd, Lothman EW, 1993. Morphometric effects of intermittent kindled seizures and limbic status epilepticus in the dentate gyrus of the rat. Brain Res 603, 25–31. - PubMed

Publication types