. 2020 Nov 16;12(11):3384.
doi: 10.3390/cancers12113384.

Curcumin Treatment Identifies Therapeutic Targets within Biomarkers of Liver Colonization by Highly Invasive Mesothelioma Cells-Potential Links with Sarcomas

Affiliations

Curcumin Treatment Identifies Therapeutic Targets within Biomarkers of Liver Colonization by Highly Invasive Mesothelioma Cells-Potential Links with Sarcomas

Daniel L Pouliquen et al. Cancers (Basel). .

Abstract

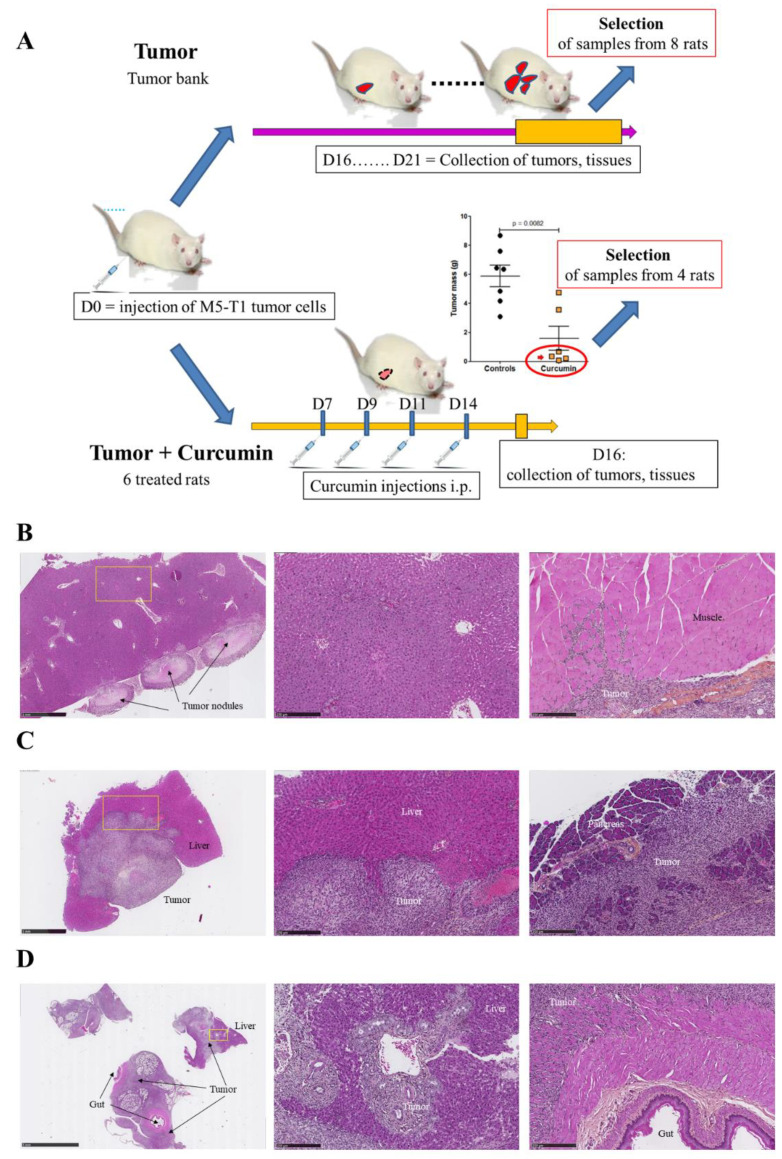
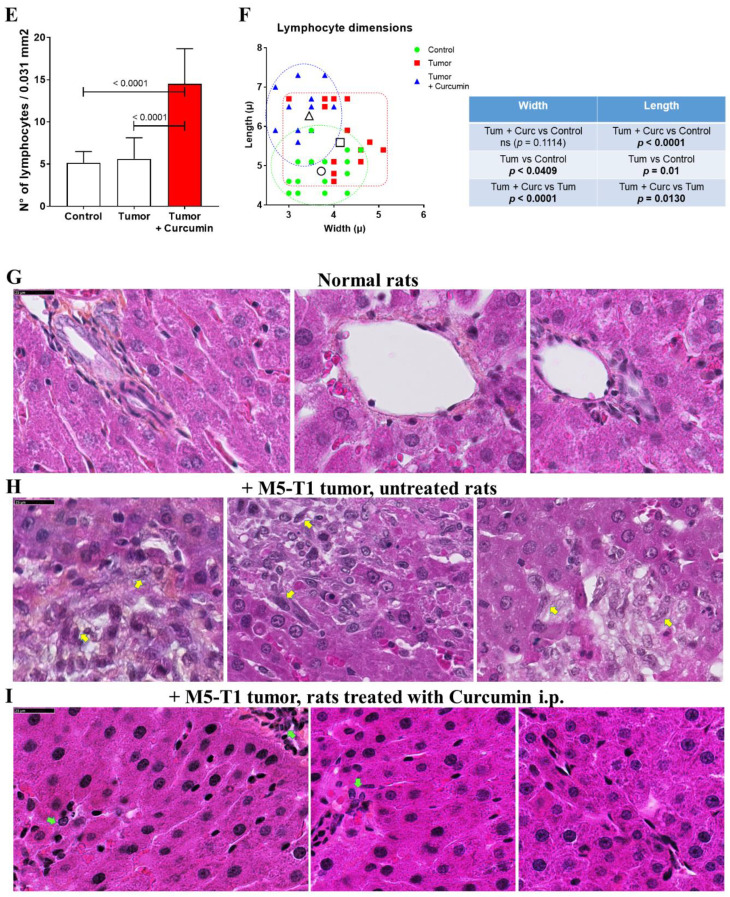
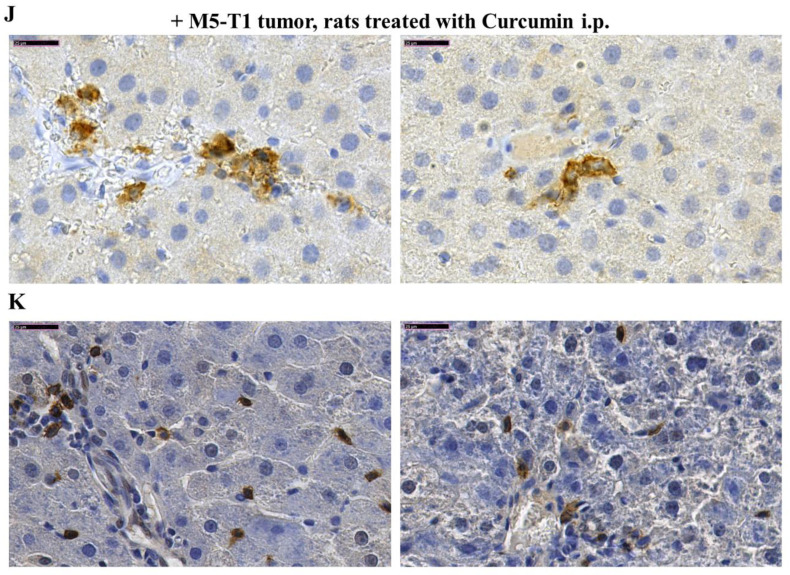
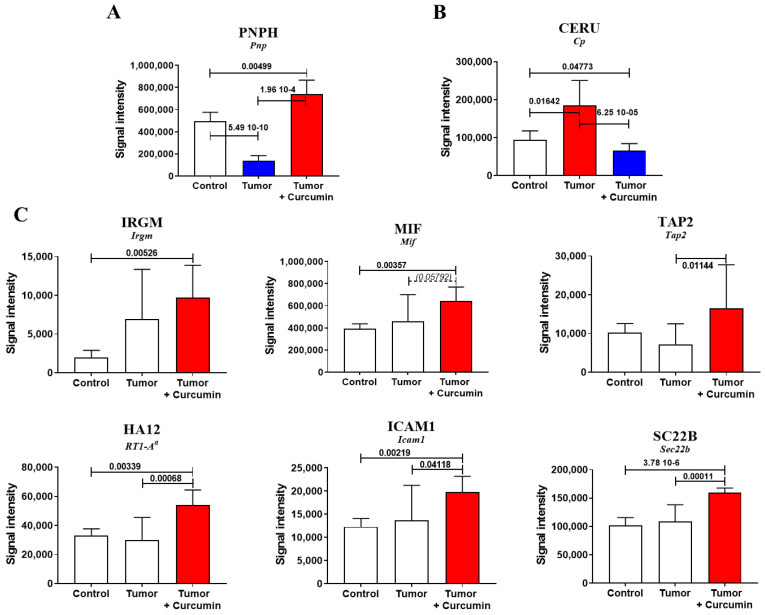
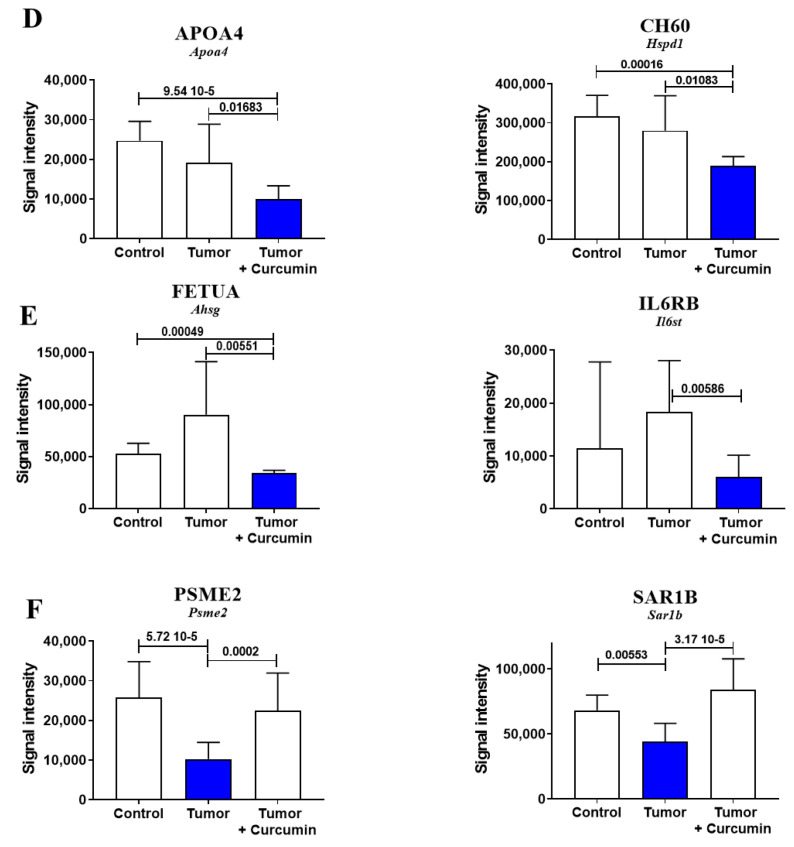
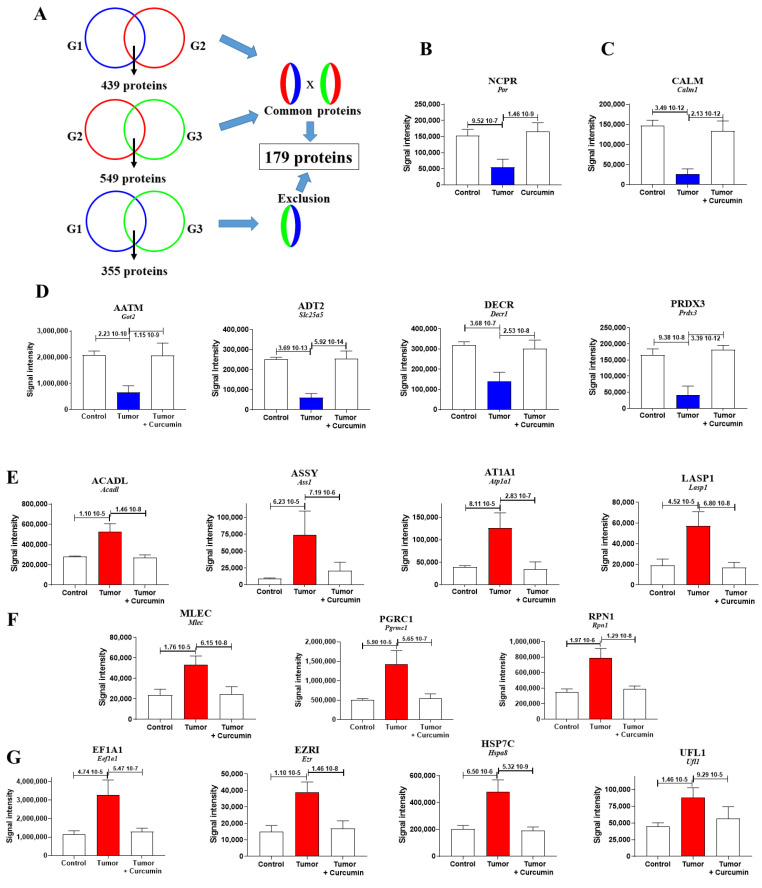
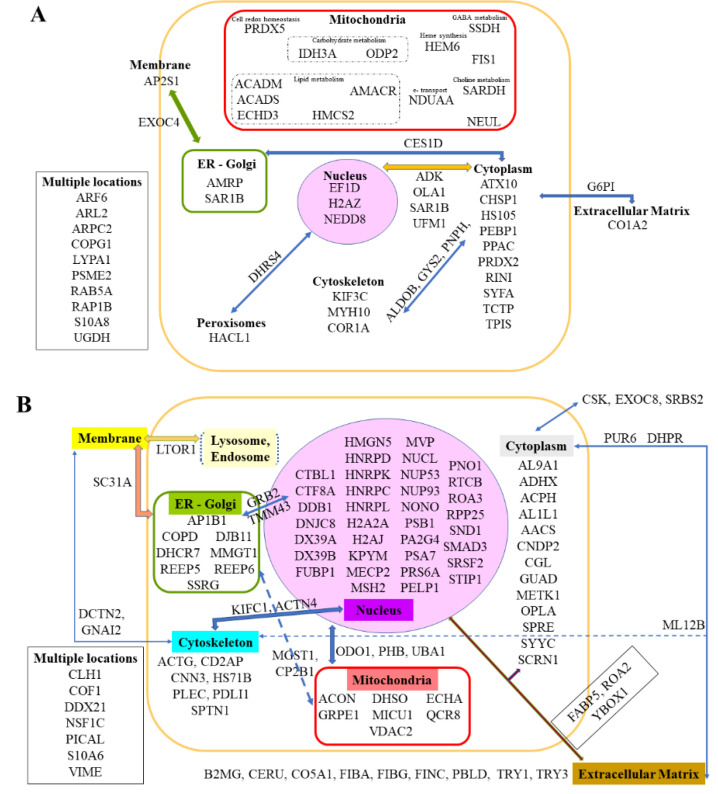
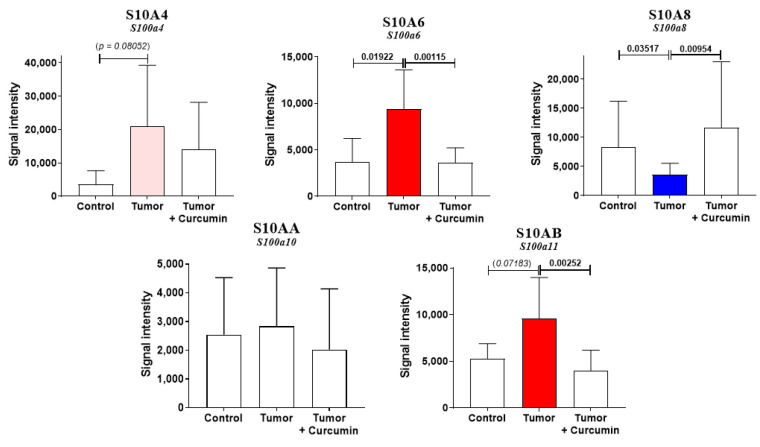
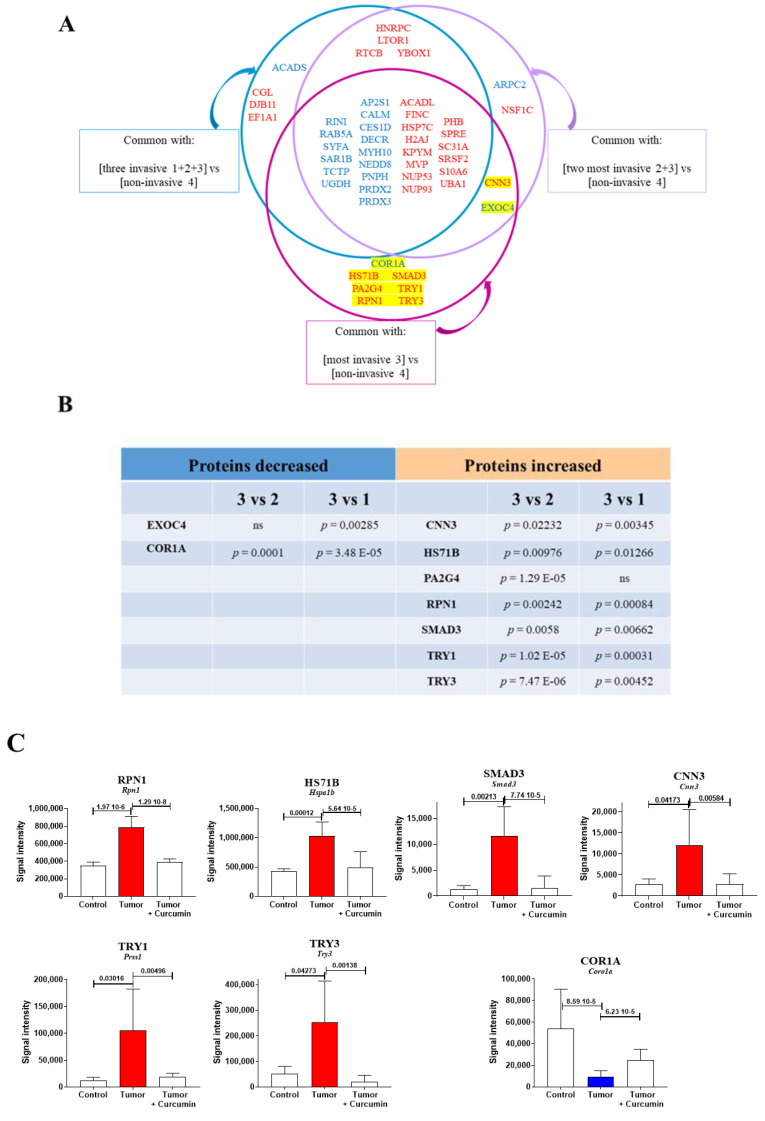
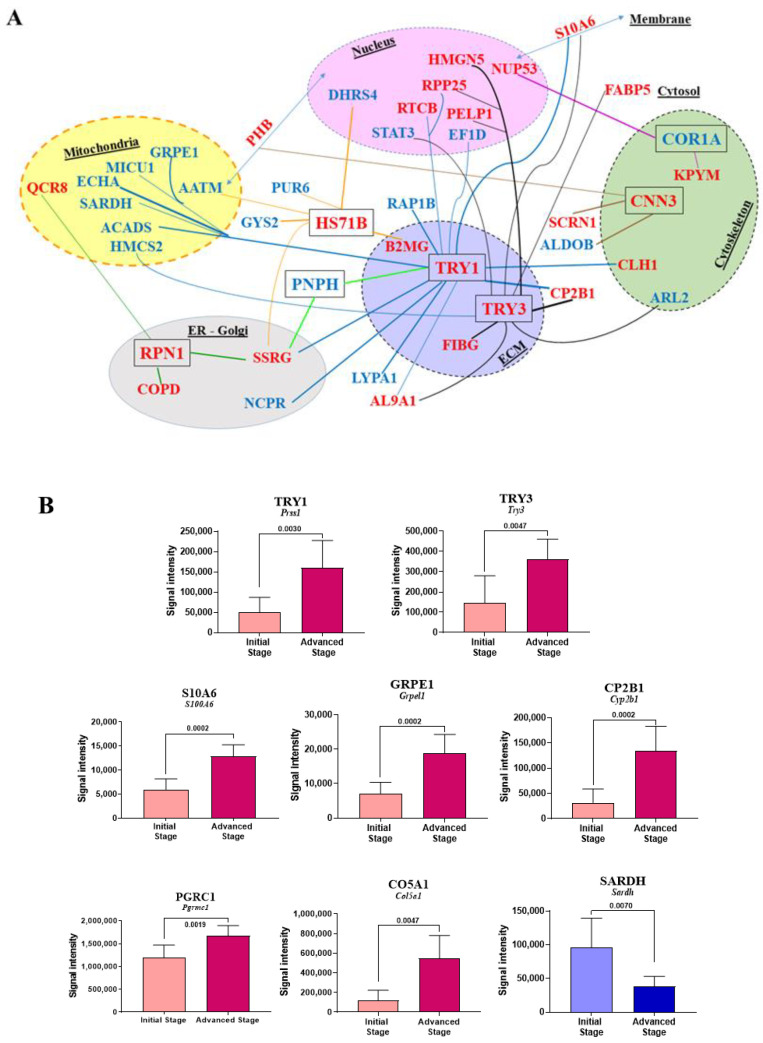
Investigations of liver metastatic colonization suggest that the microenvironment is preordained to be intrinsically hospitable to the invasive cancer cells. To identify molecular determinants of that organotropism and potential therapeutic targets, we conducted proteomic analyses of the liver in an aggressive model of sarcomatoid peritoneal mesothelioma (M5-T1). The quantitative changes between SWATH-MS (sequential window acquisition of all theoretical fragmentation spectra) proteotype patterns of the liver from normal rats (G1), adjacent non-tumorous liver from untreated tumor-bearing rats (G2), and liver from curcumin-treated rats without hepatic metastases (G3) were compared. The results identified 12 biomarkers of raised immune response against M5-T1 cells in G3 and 179 liver biomarker changes in (G2 vs. G1) and (G3 vs. G2) but not in (G3 vs. G1). Cross-comparing these 179 candidates with proteins showing abundance changes related to increasing invasiveness in four different rat mesothelioma tumor models identified seven biomarkers specific to the M5-T1 tumor. Finally, analysis of correlations between these seven biomarkers, purine nucleoside phosphorylase being the main biomarker of immune response, and the 179 previously identified proteins revealed a network orchestrating liver colonization and treatment efficacy. These results highlight the links between potential targets, raising interesting prospects for optimizing therapies against highly invasive cancer cells exhibiting a sarcomatoid phenotype and sarcoma cells.

Keywords: biomarkers; curcumin; invasiveness; liver colonization; malignant mesothelioma; metastatic tumor cells; proteomics; sarcomatoid phenotype.


Conflict of interest statement

The authors declare no conflict of interest.

Figures

Figure 1
Figure 1
Experimental design and characteristics of the activated lymphocytes infiltrating the liver parenchyma of curcumin-treated rats. (A) Scheme of experimental design representing how liver samples from the “Tumor” and “Tumor + Curcumin” groups were selected for proteomic and histological analysis. (B,C) Histological features of two selected rats belonging to the “Tumor” group showing different stages of M5-T1 tumor development, initial stage (B), and advanced stage (C). Left, general views (×25, the scale bar represents 1 mm). Middle, magnification (×100, the scale bar represents 250 µm) of the yellow rectangles showing the histological features of the liver parenchyma used for proteomic analysis (at distance from the tumor front). Right, beginning of muscle invasion at initial stage (B) and invasion of the pancreas at advanced stage (C). (D) Example of rat at final stage from the tumor bank and excluded from sample selection. Left, general view (×6.5, the scale bar represents 5 mm), showing dramatic invasion of the liver and gut. Middle, magnification (×100, the scale bar represents 250 µm) of the yellow rectangle showing extended invasion of the liver parenchyma by tumor cells. Right, magnification (×100, the scale bar represents 250 µm) showing tumor cells invading the muscularis externa of the gut. (E) Quantification of lymphocytes in high-magnification fields. (F) Comparison of lymphocyte sizes. High-magnification views (×800, the scale bars represent 25 µm) of liver parenchyma from normal rats (G), rats with M5-T1 tumor ((H), tumor cells are indicated by yellow arrows), and rats with M5-T1 tumor treated with curcumin i.p. (I). Isolated tumor cells (green arrows, left and middle photographs in (I)) exhibiting morphological changes in comparison with (H), with numerous activated lymphocytes present in the sinusoids and converging toward the residual tumor cells. Two representative examples of immunohistochemical staining of CD3+ lymphocytes (J) and CD8+ lymphocytes (K) infiltrating the liver parenchyma of rats with M5-T1 tumor treated with curcumin i.p. (two different rats).
Figure 1
Figure 1
Experimental design and characteristics of the activated lymphocytes infiltrating the liver parenchyma of curcumin-treated rats. (A) Scheme of experimental design representing how liver samples from the “Tumor” and “Tumor + Curcumin” groups were selected for proteomic and histological analysis. (B,C) Histological features of two selected rats belonging to the “Tumor” group showing different stages of M5-T1 tumor development, initial stage (B), and advanced stage (C). Left, general views (×25, the scale bar represents 1 mm). Middle, magnification (×100, the scale bar represents 250 µm) of the yellow rectangles showing the histological features of the liver parenchyma used for proteomic analysis (at distance from the tumor front). Right, beginning of muscle invasion at initial stage (B) and invasion of the pancreas at advanced stage (C). (D) Example of rat at final stage from the tumor bank and excluded from sample selection. Left, general view (×6.5, the scale bar represents 5 mm), showing dramatic invasion of the liver and gut. Middle, magnification (×100, the scale bar represents 250 µm) of the yellow rectangle showing extended invasion of the liver parenchyma by tumor cells. Right, magnification (×100, the scale bar represents 250 µm) showing tumor cells invading the muscularis externa of the gut. (E) Quantification of lymphocytes in high-magnification fields. (F) Comparison of lymphocyte sizes. High-magnification views (×800, the scale bars represent 25 µm) of liver parenchyma from normal rats (G), rats with M5-T1 tumor ((H), tumor cells are indicated by yellow arrows), and rats with M5-T1 tumor treated with curcumin i.p. (I). Isolated tumor cells (green arrows, left and middle photographs in (I)) exhibiting morphological changes in comparison with (H), with numerous activated lymphocytes present in the sinusoids and converging toward the residual tumor cells. Two representative examples of immunohistochemical staining of CD3+ lymphocytes (J) and CD8+ lymphocytes (K) infiltrating the liver parenchyma of rats with M5-T1 tumor treated with curcumin i.p. (two different rats).
Figure 2
Figure 2
Biomarkers associated with the curcumin-induced immune response. Comparison of protein abundances between the three groups of rats, revealing different patterns of changes (significant increases in red and decreases in blue, with p-values indicated above the bars). Blank bars correspond to the absence of significant differences between groups. The names of genes coding for the proteins are indicated in italics below each protein abbreviation. (A), (B) differential evolution of protein abundances in treated (G3) and untreated rats (G2) relative to normal rats (G1). (C) Increased abundance in G3 (relative to G1 and/or G2). (D) Decreased abundance in G3 (relative to G1 and G2). (E) Decreased abundance in G3 (relative to G2). (F) Decrease in G2 vs. G1 and G2 vs. G3.
Figure 2
Figure 2
Biomarkers associated with the curcumin-induced immune response. Comparison of protein abundances between the three groups of rats, revealing different patterns of changes (significant increases in red and decreases in blue, with p-values indicated above the bars). Blank bars correspond to the absence of significant differences between groups. The names of genes coding for the proteins are indicated in italics below each protein abbreviation. (A), (B) differential evolution of protein abundances in treated (G3) and untreated rats (G2) relative to normal rats (G1). (C) Increased abundance in G3 (relative to G1 and/or G2). (D) Decreased abundance in G3 (relative to G1 and G2). (E) Decreased abundance in G3 (relative to G2). (F) Decrease in G2 vs. G1 and G2 vs. G3.
Figure 3
Figure 3
Liver biomarkers exhibiting the most dramatic quantitative changes under metastatic colonization by M5-T1 cells. (A) Diagram of the method used to identify the 179 biomarkers of interest. G1 = group of normal rats, G2 = group of untreated rats, G3 = group of curcumin-treated rats. (BD) Biomarkers exhibiting the most dramatic changes within the 61 proteins presenting a decreased abundance, located in endoplasmic reticulum (B), cytoplasm and cytoskeleton (C), and mitochondria (D). (EG) Biomarkers exhibiting the most dramatic changes within the 118 proteins presenting an increased abundance, located in mitochondria, cytoplasm or plasma membrane (E), endoplasmic reticulum (F), or present in multiple subcellular compartments (G).
Figure 4
Figure 4
Additional biomarkers of interest showing abundance changes under metastatic colonization. (A) Liver biomarkers exhibiting significant decreased abundance in G2 vs. G1 and G3 vs. G2 but not in G3 vs. G1. (B) Liver biomarkers exhibiting significant increased abundance in G2 vs. G1 and G3 vs. G2 but not in G3 vs. G1. Each protein of interest is represented by its abbreviation and location (according to Uniprot.org). For proteins located in several subcellular compartments or extracellular matrixes, links between these are represented by arrows. The full names and equivalent human genes that encode the corresponding proteins are provided in Tables S1 and S2.
Figure 5
Figure 5
S100 differential abundance proteins. Comparison of protein abundances between the three groups of rats (significant increases in red and decreases in blue, with p-values indicated above the bars). Blank bars correspond to the absence of significant differences between groups. The p-values in italics and/or bars in light red correspond to tendencies (p < 0.09).
Figure 6
Figure 6
Common biomarkers of liver colonization by M5-T1 cells and the M5-T1 tumor. (A) Schematic representation of the method used to identify biomarkers common to the liver colonization by M5-T1 tumor cells and invasive rat mesothelioma tumors. The lists of proteins common to each condition are written in blue (for decrease) and red (for increase). The codes describing each invasive rat mesothelioma tumors were: 1 = F4-T2, 2 = F5-T1, and 3 = M5-T1 (4 = noninvasive M5-T2). As in Figure 3, Figure 4 and Figure 5, the equivalent human genes that encode the proteins represented by abbreviations (for the rat) are given in Tables S1 and S2. (B) The p-values for the nine biomarkers identified in (A), highlighted in yellow (MarkerView statistical analysis) when comparing abundance changes in 3 vs. 1 and 3 vs. 2 (same codes for the rat tumors as above). (C) Comparison of protein abundances between the three groups of rats (significant increases in red and decreases in blue, with p-values indicated above bars) for the seven biomarkers satisfying the condition p < 0.05 in the two tests described in (B).
Figure 7
Figure 7
Main correlations observed between biomarkers identified in Section 2.2, Section 2.3, Section 2.4 and Section 2.5. (A) Subcellular locations of proteins of interest are represented by different colors (except for cytoplasm/cytosol). Proteins distributed between several subcellular compartments are labeled with double-headed arrows. The p-values < 0.01 observed between PNPH, the 179 biomarkers described in Section 2.3 (see Figure 3 and Figure 4), and each of the seven proteins finally identified in Figure 7C are symbolized by lines of different colors. (B) Most significant protein abundance changes in the liver between the two stages of M5-T1 tumor development defined in Section 4.2 and illustrated in Figure 1B,C.

References

    1. Talmadge J.E., Fidler I.J. AACR centennial series: The biology of cancer metastasis: Historical perspective. Cancer Res. 2010;70:5649–5669. doi: 10.1158/0008-5472.CAN-10-1040. - DOI - PMC - PubMed
    1. Mielgo A., Schmid M.C. Liver tropism in cancer: The hepatic metastatic niche. Cold Spring Harb. Perspect. Med. 2019 doi: 10.1101/cshperspect.a037259. - DOI - PMC - PubMed
    1. Shibue T., Weinberg R.A. Metastatic colonization: Settlement, adaptation and propagation of tumor cells in a foreign tissue environment. Semin. Cancer Biol. 2011;21:99–106. doi: 10.1016/j.semcancer.2010.12.003. - DOI - PubMed
    1. Pein M., Oskarsson T. Microenvironment in metastasis: Roadblocks and supportive niches. Am. J. Physiol. Cell Physiol. 2015;309:C627–C638. doi: 10.1152/ajpcell.00145.2015. - DOI - PubMed
    1. Lee J.W., Beatty G.L. Hepatocytes prepare the soil for liver metastasis. Mol. Cell. Oncol. 2019;6:e1632686. doi: 10.1080/23723556.2019.1632686. - DOI - PMC - PubMed

LinkOut - more resources