. 2020 Nov 16;9(11):1585.
doi: 10.3390/plants9111585.

Inactivation of H+-ATPase Participates in the Influence of Variation Potential on Photosynthesis and Respiration in Peas

Affiliations

Inactivation of H+-ATPase Participates in the Influence of Variation Potential on Photosynthesis and Respiration in Peas

Lyubov Yudina et al. Plants (Basel). .

Abstract

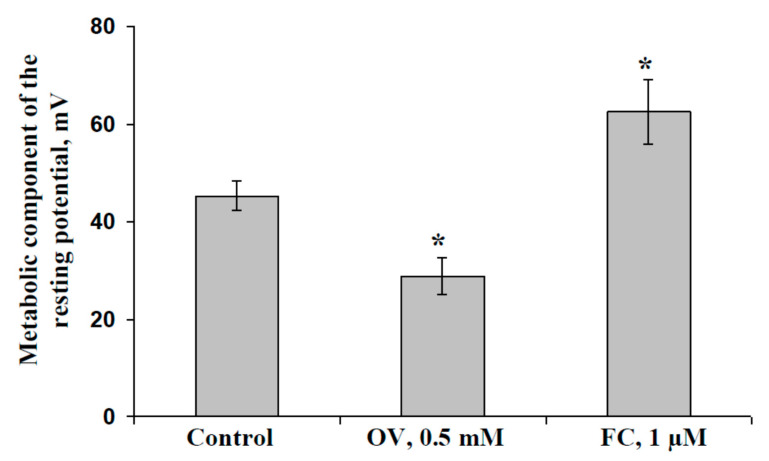
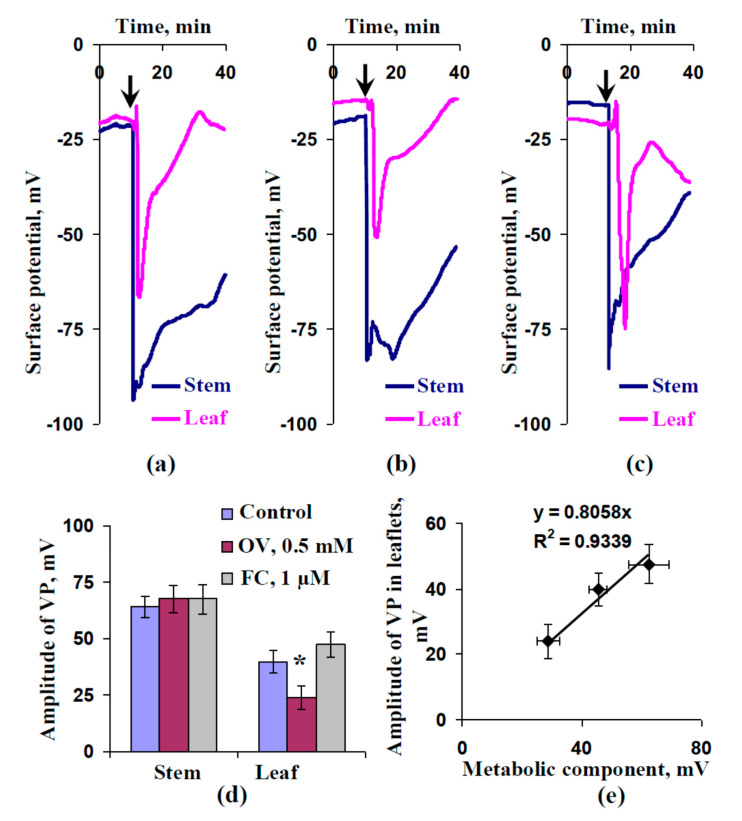
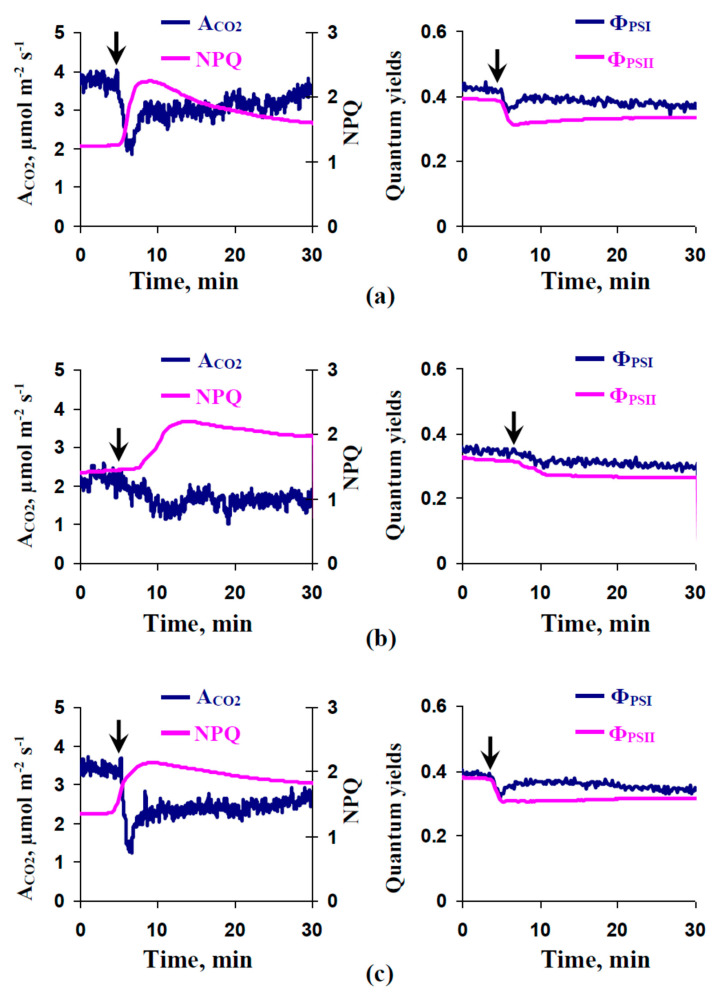
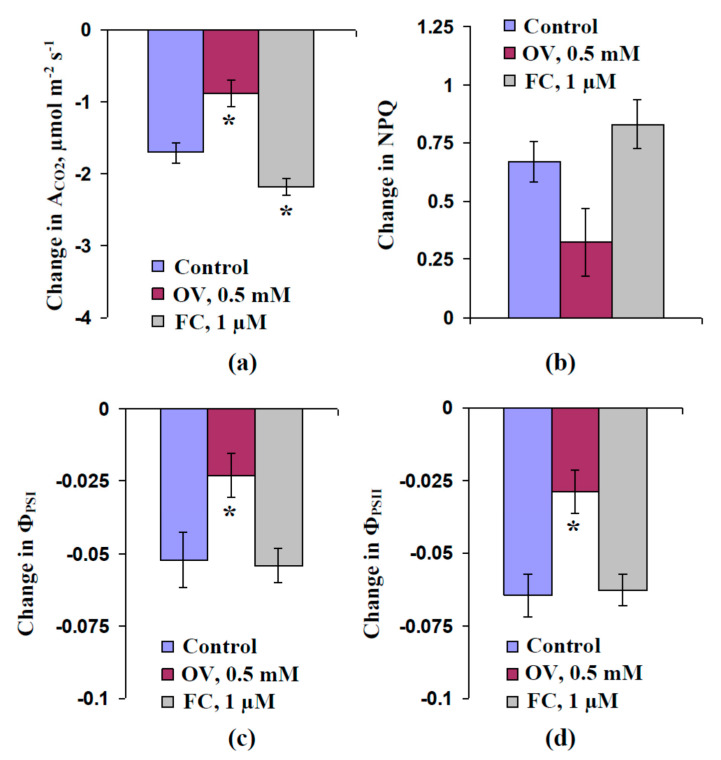
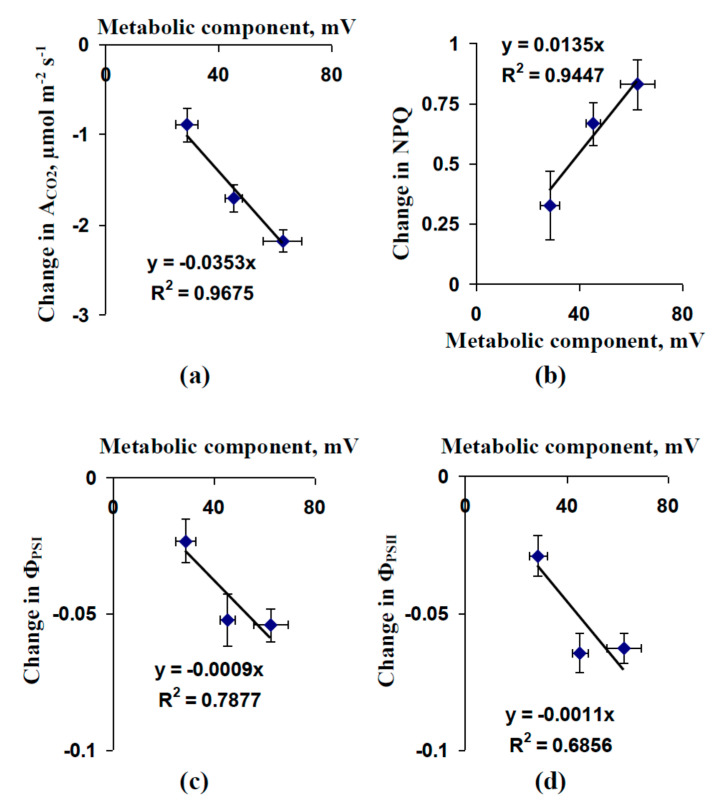
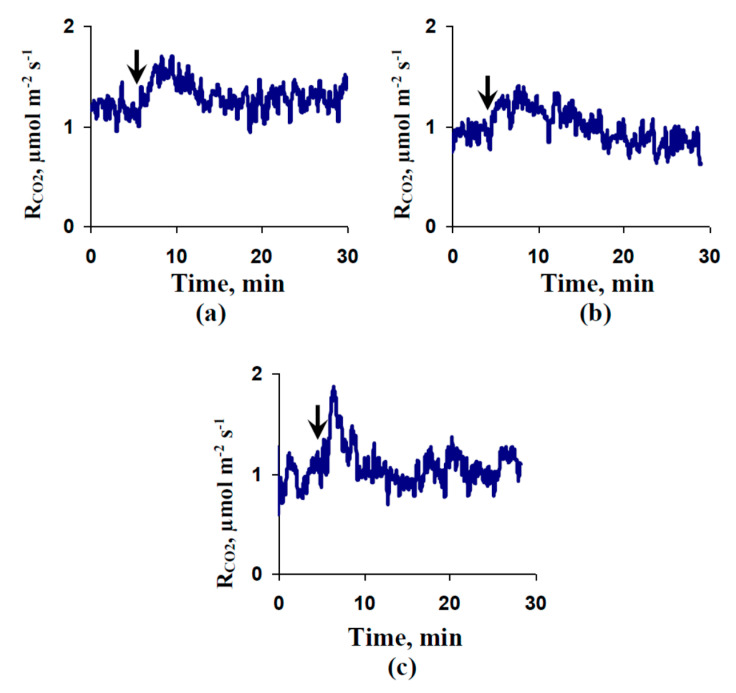
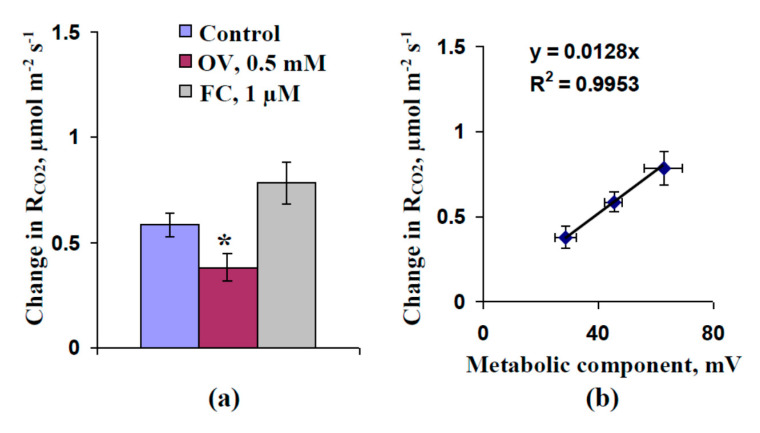
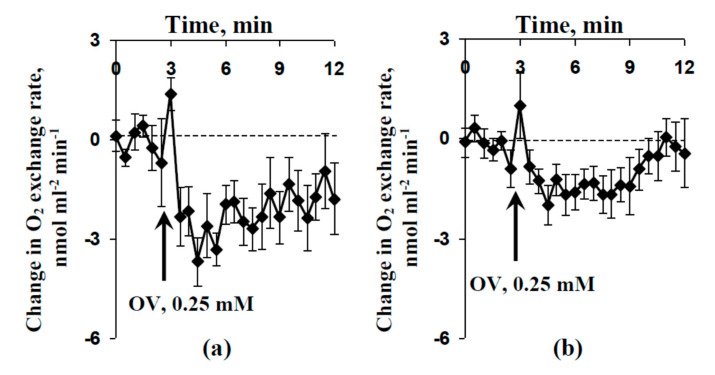
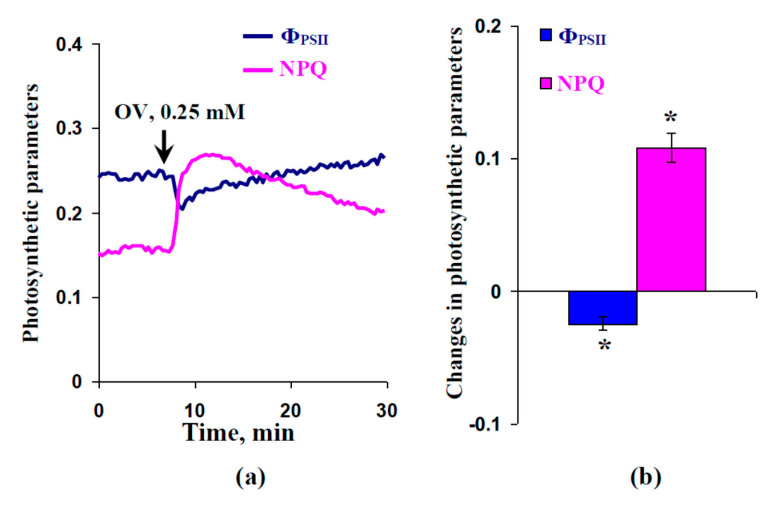
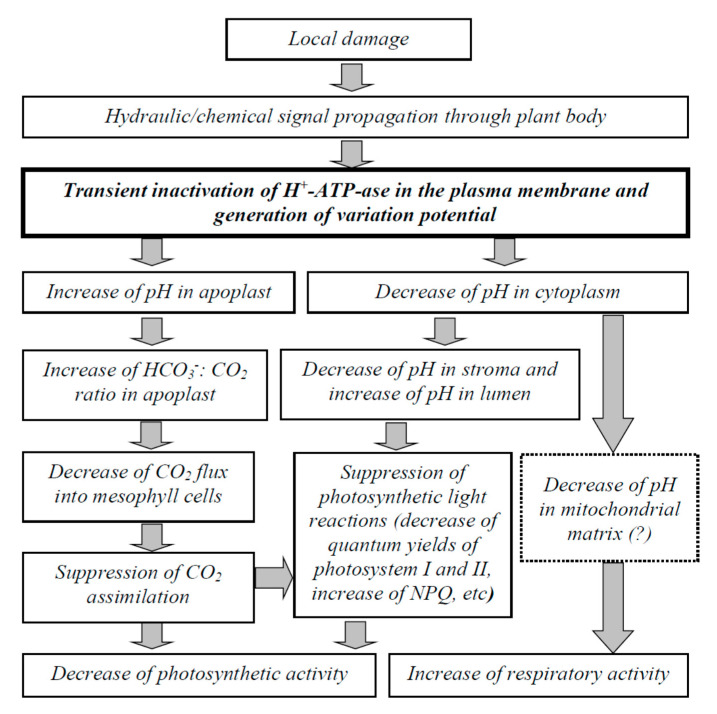
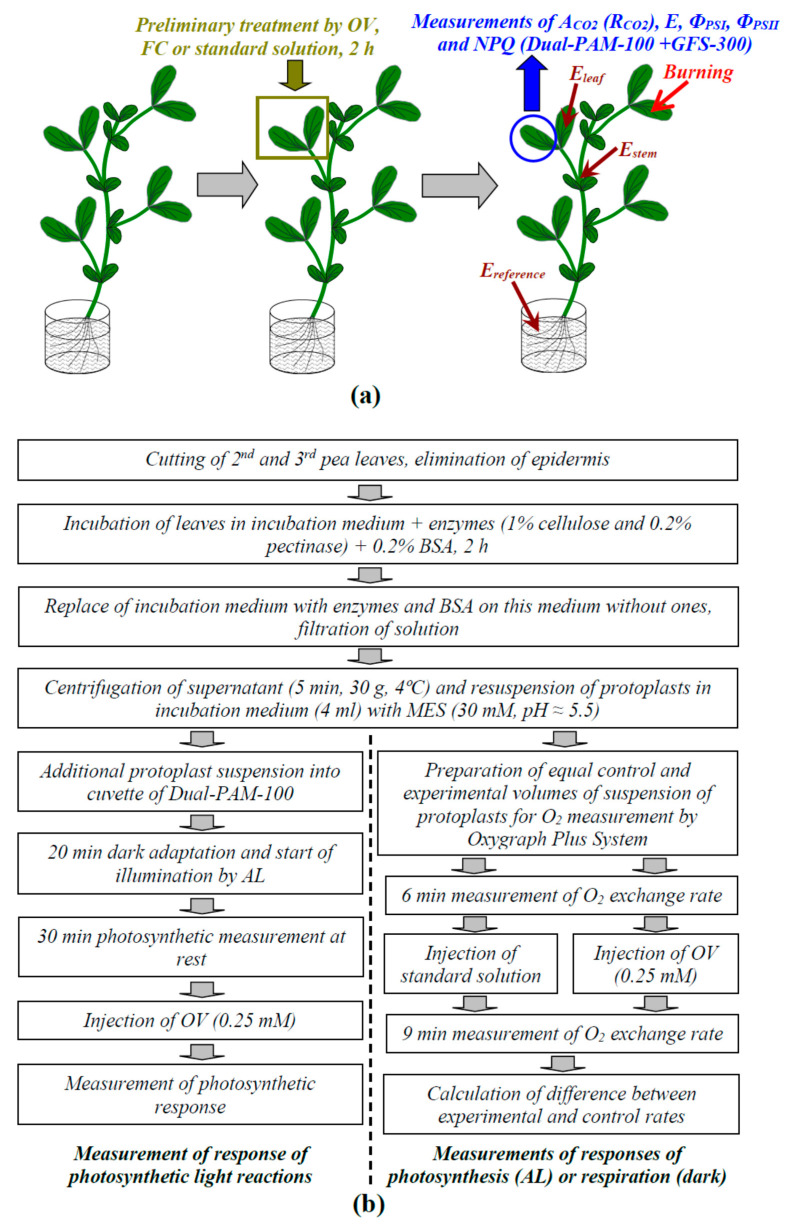
Local damage (e.g., burning, heating, or crushing) causes the generation and propagation of a variation potential (VP), which is a unique electrical signal in higher plants. A VP influences numerous physiological processes, with photosynthesis and respiration being important targets. VP generation is based on transient inactivation of H+-ATPase in plasma membrane. In this work, we investigated the participation of this inactivation in the development of VP-induced photosynthetic and respiratory responses. Two- to three-week-old pea seedlings (Pisum sativum L.) and their protoplasts were investigated. Photosynthesis and respiration in intact seedlings were measured using a GFS-3000 gas analyzer, Dual-PAM-100 Pulse-Amplitude-Modulation (PAM)-fluorometer, and a Dual-PAM gas-exchange Cuvette 3010-Dual. Electrical activity was measured using extracellular electrodes. The parameters of photosynthetic light reactions in protoplasts were measured using the Dual-PAM-100; photosynthesis- and respiration-related changes in O2 exchange rate were measured using an Oxygraph Plus System. We found that preliminary changes in the activity of H+-ATPase in the plasma membrane (its inactivation by sodium orthovanadate or activation by fusicoccin) influenced the amplitudes and magnitudes of VP-induced photosynthetic and respiratory responses in intact seedlings. Decreases in H+-ATPase activity (sodium orthovanadate treatment) induced fast decreases in photosynthetic activity and increases in respiration in protoplasts. Thus, our results support the effect of H+-ATPase inactivation on VP-induced photosynthetic and respiratory responses.

Keywords: H+-ATPase; electrical signals; pea; photosynthesis; protoplasts; respiration; systemic physiological response; variation potential.


Conflict of interest statement

The authors declare no conflict of interest. The funders had no role in the design of the study; in the collection, analyses, or interpretation of data; in the writing of the manuscript, or in the decision to publish the results.

Figures

Figure 1
Figure 1
Average magnitudes of the metabolic component of the resting potential of cells of leaves in pea seedlings under control conditions and after preliminary treatment with fusicoccin (FC) and sodium orthovanadate (OV) (n = 6–10). The magnitude of the metabolic component, which showed H+-ATPase activity in the plasma membrane, was estimated on the basis of short-term changes in membrane potential after the action of the high OV concentration (see Section 4.2 and Figure S4 for details). The second mature leaves in seedlings were preliminarily treated with OV (0.5 mM) and FC (1 µM) treatments by incubation of the leaf (2 h) in solutions of these chemical agents; after that, these leaves were dried by filter paper and used for intracellular measurement of electrical activity. OV and FC were dissolved in standard solution (1 mM KCl, 0.5 mM CaCl2, and 0.1 mM NaCl). Similar incubation in the standard solution was used as the control. *, difference between experiment and control plants was significant (p < 0.05).
Figure 2
Figure 2
Examples of variation potential (VP) measurements in pea seedlings under control conditions (a) and after preliminary treatment by sodium orthovanadate (OV) (b) or fusicoccin (FC) (c); average amplitudes of VP (d) (n = 6–15) and scatter plot between values of the metabolic component and VP amplitudes in leaflets (e). The preliminary OV (0.5 mM) and FC (1 µM) treatment of the second mature leaves in seedlings was performed by incubation of the leaf (2 h) in solutions of these chemical agents; after that, these leaves were dried using filter paper and used for the extracellular measurement of electrical activity. OV and FC were dissolved in standard solution (1 mM KCl, 0.5 mM CaCl2, and 0.1 mM NaCl). Similar incubation in the standard solution was used as the control. The arrows mark the local burning of the first mature leaf (flame, 2–3 s). Extracellular measurements of surface potentials were recorded in the second leaves and in the stems near these leaves. The values of the metabolic component were taken from Figure 1. *, statistically significant difference between experiment and control plants (p < 0.05). R2, determination coefficient.
Figure 3
Figure 3
Examples of local burning-induced changes in photosynthetic CO2 assimilation (ACO2), non-photochemical quenching of chlorophyll fluorescence (NPQ), and quantum yields of photosystems I (ΦPSI) and II (ΦPSII), in the second leaf of pea seedlings under control conditions (a) and after preliminary treatment by sodium orthovanadate (OV) (b) and fusicoccin (FC) (c). The preliminary OV (0.5 mM) and FC (1 µM) treatments of the second mature leaves in seedlings were performed by incubation of the leaf (2 h) in solutions of these chemical agents. After that, these leaves were dried by filter paper and used for photosynthetic measurements. OV and FC were dissolved in standard solution (1 mM KCl, 0.5 mM CaCl2, and 0.1 mM NaCl). Similar incubation in the standard solution was used as the control. The arrows mark the local burning of the first mature leaf (flame, 2–3 s).
Figure 4
Figure 4
Magnitudes of local burning-induced changes in photosynthetic CO2 assimilation (ACO2) (a), non-photochemical quenching of chlorophyll fluorescence (NPQ) (b), and quantum yields of photosystems I (ΦPSI) (c) and II (ΦPSII) (d), in the second leaf of pea seedlings under control conditions and after preliminary treatment by sodium orthovanadate (OV) and fusicoccin (FC) (n = 5–6). The preliminary OV (0.5 mM) and FC (1 µM) treatments of the second mature leaves in seedlings were performed by incubation of the leaf (2 h) in solutions of these chemical agents. After that, these leaves were dried by filter paper and used for photosynthetic measurements. OV and FC were dissolved in standard solution (1 mM KCl, 0.5 mM CaCl2, and 0.1 mM NaCl). Similar incubation in the standard solution was used as the control. The first mature leaf was burned (flame, 2–3 s). *, significant difference between experiment and control plants (p < 0.05).
Figure 5
Figure 5
Scatter plots between the values of the metabolic component of the membrane potential and magnitudes of local burning-induced changes in photosynthetic CO2 assimilation (ACO2) (a), non-photochemical quenching of chlorophyll fluorescence (NPQ) (b), and quantum yields of photosystems I (ΦPSI) (c) and II (ΦPSII) (d), in the second leaf of pea seedlings. Data from Figure 1 and Figure 3 were used.
Figure 6
Figure 6
Examples of local burning-induced changes in respiration (RCO2) in the second leaf of pea seedlings under control conditions (a) and after preliminary treatment by sodium orthovanadate (OV) (b) and fusicoccin (FC) (c). Respiration was measured under dark conditions. The preliminary OV (0.5 mM) and FC (1 µM) treatments of the second mature leaves in seedlings were performed by incubation of the leaf (2 h) in solutions of these chemical agents. After that, these leaves were dried by filter paper and used for respiratory measurements. OV and FC were dissolved in standard solution (1 mM KCl, 0.5 mM CaCl2, and 0.1 mM NaCl). Similar incubation in the standard solution was used as a control. The arrows mark the local burning of the first mature leaf (flame, 2–3 s).
Figure 7
Figure 7
Magnitudes of local burning-induced changes in respiration (RCO2) (a) and scatter plot between the values of the metabolic component of the membrane potential and the magnitudes of these changes (b) (n = 5–6). Respiration was measured under dark conditions. The preliminary OV (0.5 mM) and FC (1 µM) treatments of the second mature leaves in seedlings were performed by incubation of the leaf (2 h) in solutions of these chemical agents. After that, these leaves were dried using filter paper and used for respiratory measurement. OV and FC were dissolved in standard solution (1 mM KCl, 0.5 mM CaCl2, and 0.1 mM NaCl). Similar incubation in the standard solution was used as a control. The first mature leaf was burned (flame, 2–3 s). The values of the metabolic component were taken from Figure 1. *, significant difference between experiment and control plants (p < 0.05).
Figure 8
Figure 8
Average changes in O2 exchange rate induced by injection of sodium orthovanadate (OV) in pea protoplasts under light (a) and dark (b) conditions (n = 7–10). OV was dissolved in standard solution (1 mM KCl, 0.5 mM CaCl2, and 0.1 mM NaCl); the arrows mark the OV injection into the protoplast incubation medium (injection volume was 30 µL and final OV concentration was 0.25 mM). The incubation medium for protoplasts included sorbitol (400 mM), CaCl2 (5 mM), MgCl2·6H2O (5 mM), NaCl (20 mM), and MES-KOH (30 mM). The pH was about 5.5. The final volume (the incubation medium + protoplasts) was 1.2 mL. Blue actinic light (460 nm, 240 µmol m−2 s−1) was used in the experiment under light conditions. In each experiment, the change in O2 exchange rate was calculated as the difference between the O2 release/consumption rate in the variant with injection of OV (experiment) and the rate in the variant with injection of standard solution (control). Increases in O2 exchange rate indicated the increase in O2 release (under light conditions) or decrease in O2 consumption (under dark conditions). The decrease in O2 exchange rate indicated a decrease in O2 release (under light conditions) or increase in O2 consumption (under dark conditions).
Figure 9
Figure 9
Example of changes in quantum yield of photosystems II (ΦPSII) and non-photochemical quenching of chlorophyll fluorescence (NPQ) after injection of sodium orthovanadate (OV) (a) and average magnitudes of these changes (b) in protoplasts of peas (n = 6). OV was dissolved in standard solution (1 mM KCl, 0.5 mM CaCl2, and 0.1 mM NaCl); the arrows mark the OV injection into the protoplast incubation medium (injection volume was 30 µL and final OV concentration was 0.25 mM). The incubation medium for protoplasts included sorbitol (400 mM), CaCl2 (5 mM), MgCl2·6H2O (5 mM), NaCl (20 mM), and MES-KOH (30 mM). The pH was about 5.5. The final volume (the incubation medium + protoplasts) was about 3 mL. Photosynthetic measurements were recorded under blue actinic light (460 nm, 108 µmol m−2 s−1). *, the average change was significant (p < 0.05).
Figure 10
Figure 10
Potential pathways through which the variation potential-related inactivation of H+-ATPase in the plasma membrane influences photosynthesis and respiration. It is hypothesized that local damage induces the propagation of hydraulic and (or) chemical signals, which decrease the activity of H+-ATPase in the plasma membrane (maybe through Ca2+ flux into the cytoplasm), and thereby generate variation potential. Inactivation of H+-ATPase both increases pH in the apoplast and decreases pH in the cytoplasm. The increased apoplastic pH increases the HCO3/CO2 ratio in the apoplast and decreases the CO2 flux into the mesophyll cells through the plasma membrane because CO2 is more permeable through biological membranes than HCO3. The decreased CO2 flux induces the suppression of photosynthetic CO2 assimilation. The decreased pH in the cytoplasm can decrease the pH in the stroma and lumen of chloroplasts; suppression of photosynthetic light reactions (decrease in quantum yields of photosystem I and II, increase in NPQ, etc.) is induced by these changes in pH. In contrast, the decreased pH in the cytoplasm can stimulate respiration. The effect is probably caused by the decrease in pH in the mitochondrial matrix and the stimulation of respiratory electron flow. Thus, both the decrease in photosynthetic activity and the increase in respiration are the results of the propagation of variation potentials.
Figure 11
Figure 11
(a) Schema of investigations of the influence of the preliminary modification of the activity of H+-ATPase in the plasma membrane on electrical signal-induced photosynthetic and respiratory responses. Activity of H+-ATPase was decreased by leaf treatment with sodium orthovanadate (OV) and increased by treatment with fusicoccin (FC). The preliminary OV (0.5 mM) and FC (1 µM) treatments of the second mature leaves in seedlings was performed by incubation of the leaf (2 h) in solutions of these chemical agents. After that, these leaves were dried using filter paper and used for extracellular measurement of photosynthetic and electrical activities. OV and FC were dissolved in standard solution (1 mM KCl, 0.5 mM CaCl2, and 0.1 mM NaCl). Similar treatment using the standard solution was used as the control. The arrows mark the local burning of the first mature leaf (flame, 2–3 s). Eleaf and Estem are the measuring electrodes that were placed on the second leaves (center of leaflet) and stems near these leaves, respectively; Ereference is the reference electrode. (b) Schema of experiments using a suspension of protoplasts from pea leaves. Photosynthetic light reactions were investigated under actinic light (AL, 460 nm, 239 µmol m−2 s−1) using a Dual-PAM-100. O2 exchange rate was investigated under AL (for photosynthetic investigations) or under dark conditions (for respiratory investigations) using an Oxygraph Plus System. The standard solution included 1 mM KCl, 0.5 mM CaCl2, and 0.1 mM NaCl.

References

    1. Trebacz K., Dziubinska H., Krol E. Electrical signals in long-distance communication in plants. In: Baluška F., Mancuso S., Volkmann D., editors. Communication in Plants. Neuronal Aspects of Plant Life. Springer; Berlin/Heidelberg, Germany: New York, NY, USA: 2006. pp. 277–290.
    1. Fromm J., Lautner S. Electrical signals and their physiological significance in plants. Plant Cell Environ. 2007;30:249–257. doi: 10.1111/j.1365-3040.2006.01614.x. - DOI - PubMed
    1. Gallé A., Lautner S., Flexas J., Fromm J. Environmental stimuli and physiological responses: The current view on electrical signaling. Environ. Exp. Bot. 2015;114:15–21. doi: 10.1016/j.envexpbot.2014.06.013. - DOI
    1. Vodeneev V., Akinchits E., Sukhov V. Variation potential in higher plants: Mechanisms of generation and propagation. Plant Signal. Behav. 2015;10:e1057365. doi: 10.1080/15592324.2015.1057365. - DOI - PMC - PubMed
    1. Sukhov V. Electrical signals as mechanism of photosynthesis regulation in plants. Photosynth. Res. 2016;130:373–387. doi: 10.1007/s11120-016-0270-x. - DOI - PubMed

LinkOut - more resources