. 2020 Nov 16;21(22):8623.
doi: 10.3390/ijms21228623.

Large-Scale Plasma Analysis Revealed New Mechanisms and Molecules Associated with the Host Response to SARS-CoV-2

Affiliations

Large-Scale Plasma Analysis Revealed New Mechanisms and Molecules Associated with the Host Response to SARS-CoV-2

Elettra Barberis et al. Int J Mol Sci. .

Abstract

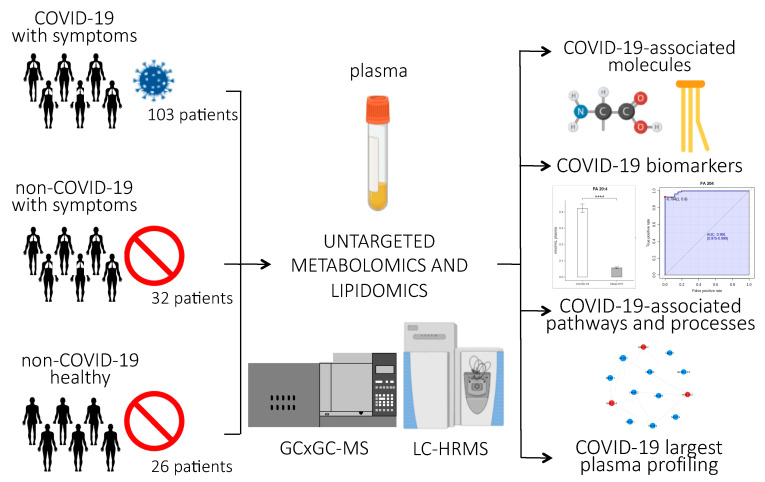
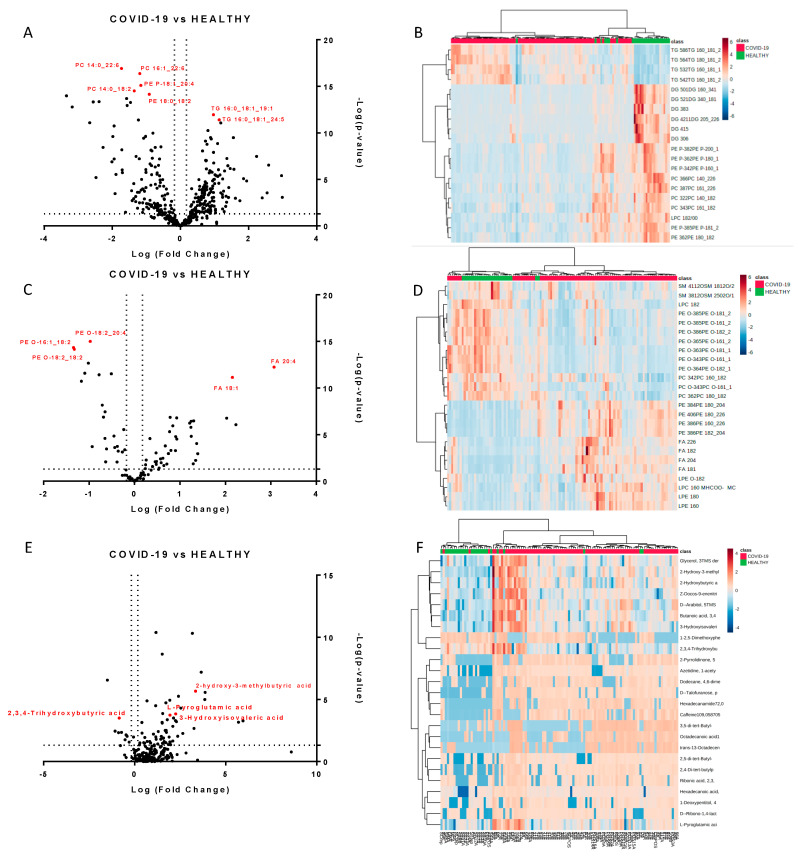
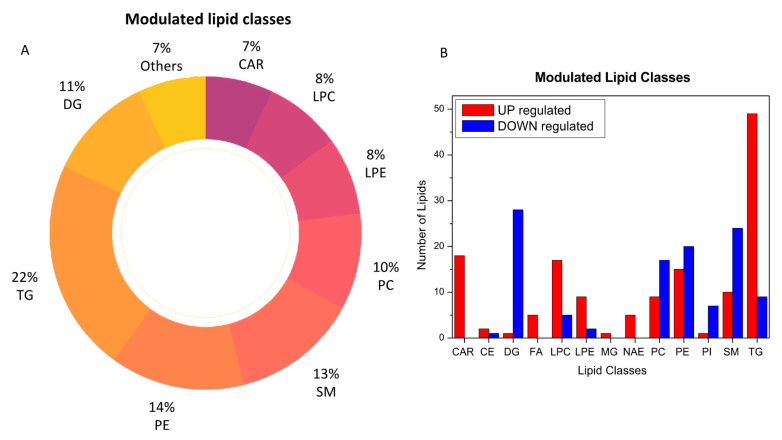
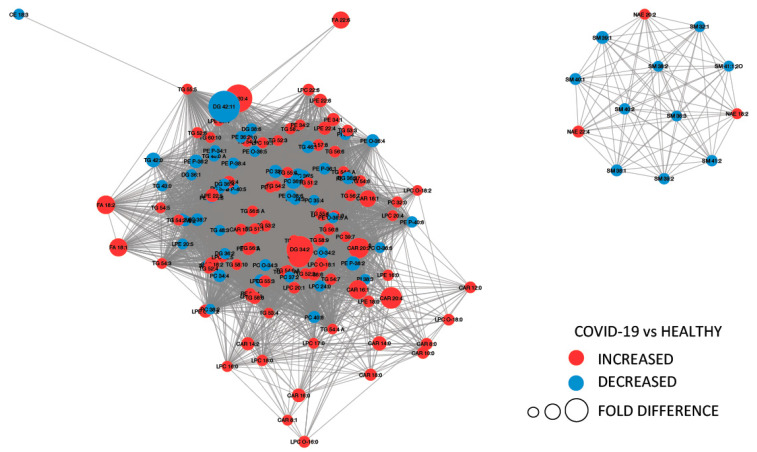
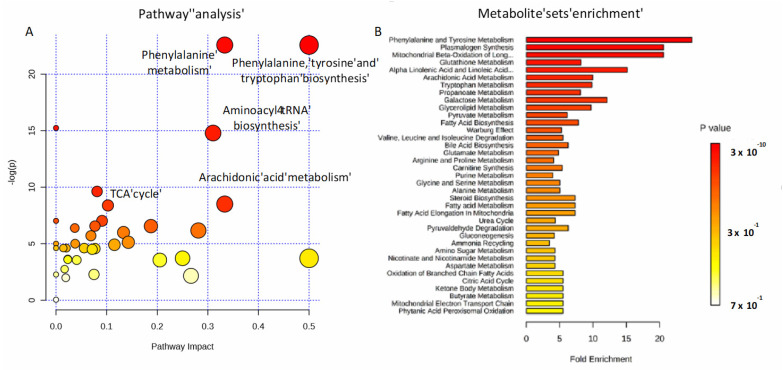
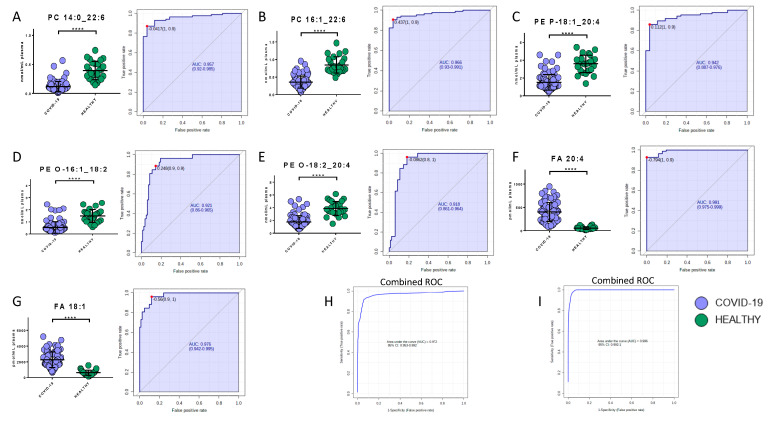
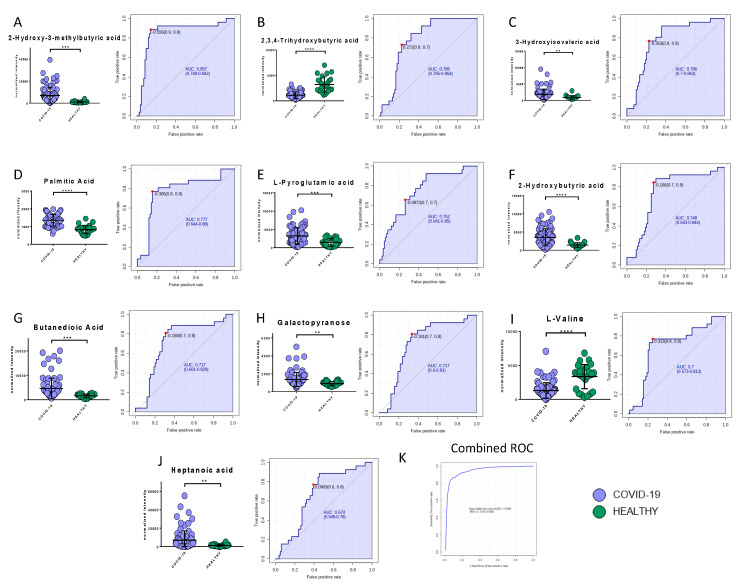
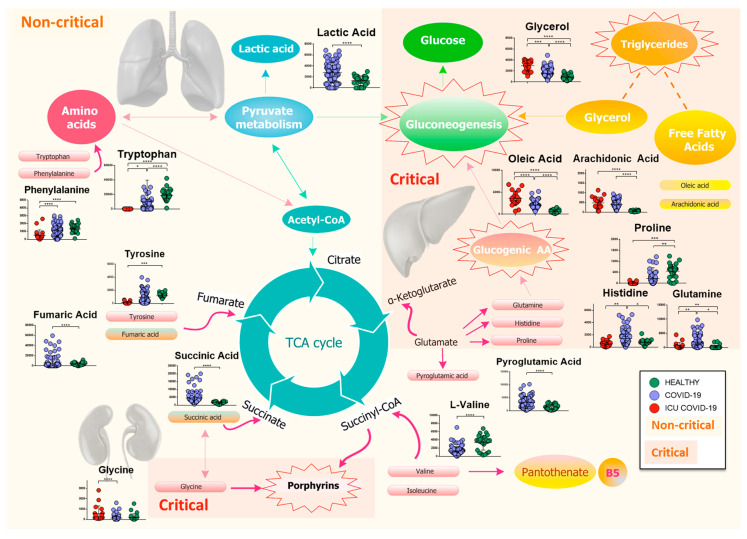
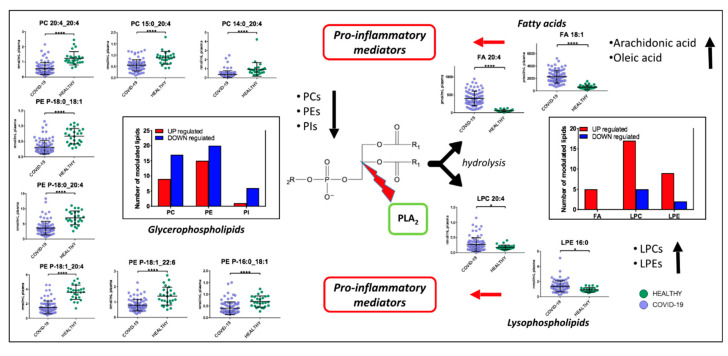
The novel severe acute respiratory syndrome coronavirus 2 (SARS-CoV-2) has spread to nearly every continent, registering over 1,250,000 deaths worldwide. The effects of SARS-CoV-2 on host targets remains largely limited, hampering our understanding of Coronavirus Disease 2019 (COVID-19) pathogenesis and the development of therapeutic strategies. The present study used a comprehensive untargeted metabolomic and lipidomic approach to capture the host response to SARS-CoV-2 infection. We found that several circulating lipids acted as potential biomarkers, such as phosphatidylcholine 14:0_22:6 (area under the curve (AUC) = 0.96), phosphatidylcholine 16:1_22:6 (AUC = 0.97), and phosphatidylethanolamine 18:1_20:4 (AUC = 0.94). Furthermore, triglycerides and free fatty acids, especially arachidonic acid (AUC = 0.99) and oleic acid (AUC = 0.98), were well correlated to the severity of the disease. An untargeted analysis of non-critical COVID-19 patients identified a strong alteration of lipids and a perturbation of phenylalanine, tyrosine and tryptophan biosynthesis, phenylalanine metabolism, aminoacyl-tRNA degradation, arachidonic acid metabolism, and the tricarboxylic acid (TCA) cycle. The severity of the disease was characterized by the activation of gluconeogenesis and the metabolism of porphyrins, which play a crucial role in the progress of the infection. In addition, our study provided further evidence for considering phospholipase A2 (PLA2) activity as a potential key factor in the pathogenesis of COVID-19 and a possible therapeutic target. To date, the present study provides the largest untargeted metabolomics and lipidomics analysis of plasma from COVID-19 patients and control groups, identifying new mechanisms associated with the host response to COVID-19, potential plasma biomarkers, and therapeutic targets.

Keywords: SARS-CoV-2; biomarkers; fatty acids; metabolism.


Conflict of interest statement

The authors declare no conflict of interest.

Figures

Figure 1
Figure 1
Experimental design of the study: Untargeted lipidomics and metabolomics analyses were performed on plasma samples from 103 patients infected with SARS-CoV-2, 84 of whom had non-critical COVID-19, while 19 had critical COVID-19 and recovered in the ICU; 20 non-COVID-19 patients with similar clinical symptoms as the COVID-19 patients; 26 healthy subjects; and 12 ICU patients who tested negative for COVID-19. The abundance of small molecules and lipids were used to identify COVID-19-associated biomarkers, pathways, and processes related to the host response to the virus. (p-value < 0.0001 = ****).
Figure 2
Figure 2
Modulated lipids and small molecules in SARS-CoV-2 infection. Volcano plots of quantified lipids in positive (A) and negative (C) modes. A total of 265 lipids were modulated with a p-value < 0.05 and a fold change > 1.5. Hierarchical heat maps of quantified lipids in positive (B) and negative (D) modes, highlighting the two clusters of samples, with COVID-19 patients in red and healthy subjects in green. Panels (E,F) report the volcano plot of the quantified small molecules and the heat map, respectively.
Figure 3
Figure 3
Modulated lipid classes caused by SARS-CoV-2 infection (A) and the number of upregulated (red) and downregulated (blue) lipid species within each single class of lipids (B).
Figure 4
Figure 4
MetaMapp visualization of lipidomic changes in COVID-19 patients. Lipids with increased concentration are depicted using red nodes, while lipids with decreased concentration are represented by blue nodes. The lipids grouped on the right are sphingomyelins and N-acyl ethanolamine, while on the left are reported glycerolipids.
Figure 5
Figure 5
Pathways involved in the infection. Metabolic pathway analysis performed on modulated metabolites (A) and metabolite sets enrichment (B). Amino-acids, fatty acids, and the TCA cycle are mainly involved during non-critical infection.
Figure 6
Figure 6
Bar plots (average ± SD) with relative statistical significance (p-value < 0.0001 = ****) and ROC curves with the optimal cutoff calculated for each ROC analysis (red dot) are reported in order to show the best potential biomarkers identified using lipidomics analysis. Phosphatidylcholine 14:0_22:6 (A), phosphatidylcholine 16:1_22:6 (B), phosphatidylethanolamine 18:1_20:4 (C), arachidonic acid (D), oleic acid (E), glycerophosphoethanolamines PE (O-18:2_20:4) (F), and glycerophosphoethanolamines PE (O-16:1_18:2) (G). Combined ROCs (H,I) are also shown.
Figure 7
Figure 7
Bar plots (average ± SD) with relative statistical significance (p-value < 0.01 = **; p-value < 0.001 = ***; p-value < 0.0001 = ****) and ROC curves with the optimal cutoff calculated for each ROC analysis (red dot) are reported in order to show the best potential biomarkers identified using metabolomics analysis: 2-hydroxy-3-methylbutyric acid (A), 2,3,4-trihydroxybutyric acid (B), 3-hydroxyisovaleric acid (C), palmitic acid (D), L-pyroglutammic acid (E), 2-hydroxybutyric acid (F), butanedioic acid (G), galactopyranose (H), l-valine (I), and heptanoic acid (J). The combined ROC of the best three molecules (2-hydroxy-3-methylbutyric acid, 2,3,4-trihydroxybutyric acid, and 3-hydroxyisovaleric acid) is also shown (K).
Figure 8
Figure 8
Mapping of differential metabolites related to the major metabolism involved during the progress of the COVID-19 infection. The biochemical map shows the presence of an increase in lactic acid and a consumption of amino acids, which enter the TCA cycle as intermediates of fumarate and succinyl-CoA, in non-critical patients. Isoleucine and l-valine may cause a dysregulation of pantothenate metabolism, resulting in a possible loss of vitamin B5. Meanwhile, pyroglutamic acid, which can be converted into glutamic acid and enter TCA for energy production, increases, as does succinic acid. The severity of the disease is characterized by a drastic decrease in glucogenic amino acids, which are used in the process of gluconeogenesis, while lipolysis of adipose tissue produces glycerol, which is used for the synthesis of glucose, and free fatty acids, such as arachidonic and oleic acids. Finally, the increase in glycine activates the metabolism of porphyrins, which play a crucial role in the progression of the infection. (p-value < 0.05 = *; p-value < 0.01 = **; p-value < 0.001 = ***; p-value < 0.0001 = ****).
Figure 9
Figure 9
Proposed mechanism involved in COVID-19 pathogenesis. PLA2 hydrolyze phospholipids to yield fatty acids and lysophospholipids. We found a downregulation of glycerophospholipids (PCs, PEs and PIs) and upregulations of lysophospholipids (LPCs and LPEs), arachidonic acid, and oleic acid. Fatty acids and lysophospholipids are pro-inflammatory mediators. (p-value < 0.05 = *; p-value < 0.0001 = ****).

References

    1. Chan J.F., Yuan S., Kok K.H., To K.K., Chu H., Yang J., Xing F., Liu J., Yip C.C., Poon R.W., et al. A Familial Cluster of Pneumonia Associated with the 2019 Novel Coronavirus Indicating Person-to-Person Transmission: A Study of a Family Cluster. Lancet. 2020;395:514–523. doi: 10.1016/S0140-6736(20)30154-9. - DOI - PMC - PubMed
    1. COVID-19 Map. [(accessed on 8 November 2020)]; Available online: https://coronavirus.jhu.edu/map.html.
    1. Hui D.S., Azhar E.I., Madani T.A., Ntoumi F., Kock R., Dar O., Ippolito G., Mchugh T.D., Memish Z.A., Drosten C., et al. The continuing 2019-nCoV epidemic threat of novel coronaviruses to global health—The latest 2019 novel coronavirus outbreak in Wuhan, China. Int. J. Infect. Dis. 2020;91:264–266. doi: 10.1016/j.ijid.2020.01.009. - DOI - PMC - PubMed
    1. Wang H., Wang Z., Dong Y., Chang R., Xu C., Yu X., Zhang S., Tsamlag L., Shang M., Huang J., et al. Phase-adjusted estimation of the number of Coronavirus Disease 2019 cases in Wuhan, China. Cell Discov. 2020;6:10. doi: 10.1038/s41421-020-0148-0. - DOI - PMC - PubMed
    1. Zheng Y.Y., Ma Y.T., Zhang J.T., Xie X. COVID-19 and the cardiovascular system. Nat. Rev. Cardiol. 2020;17:259–260. doi: 10.1038/s41569-020-0360-5. - DOI - PMC - PubMed

MeSH terms