

Monitoring Gene Expression during a Galleria mellonella Bacterial Infection
- PMID: 33207842
- PMCID: PMC7697238
- DOI: 10.3390/microorganisms8111798
Monitoring Gene Expression during a Galleria mellonella Bacterial Infection
Abstract
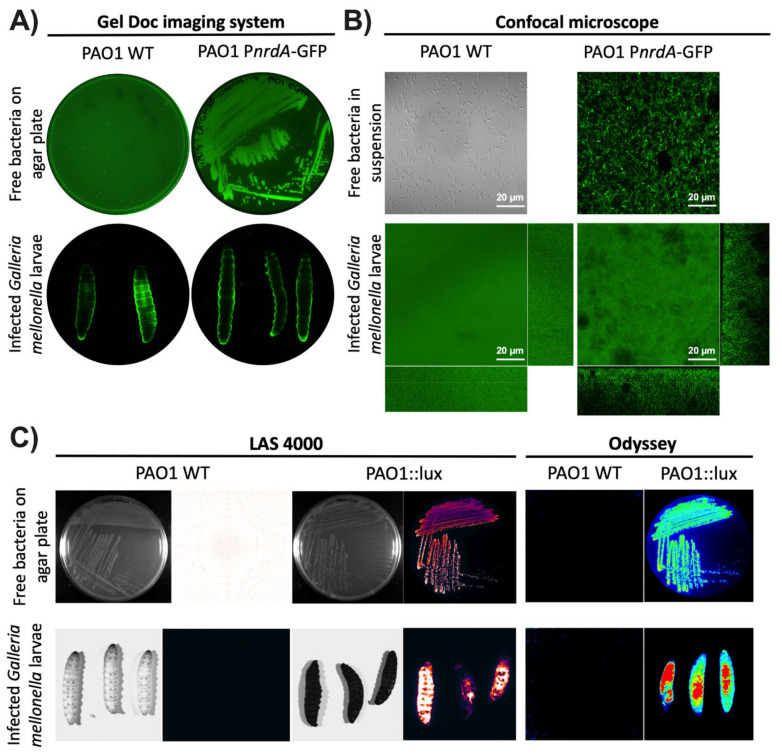
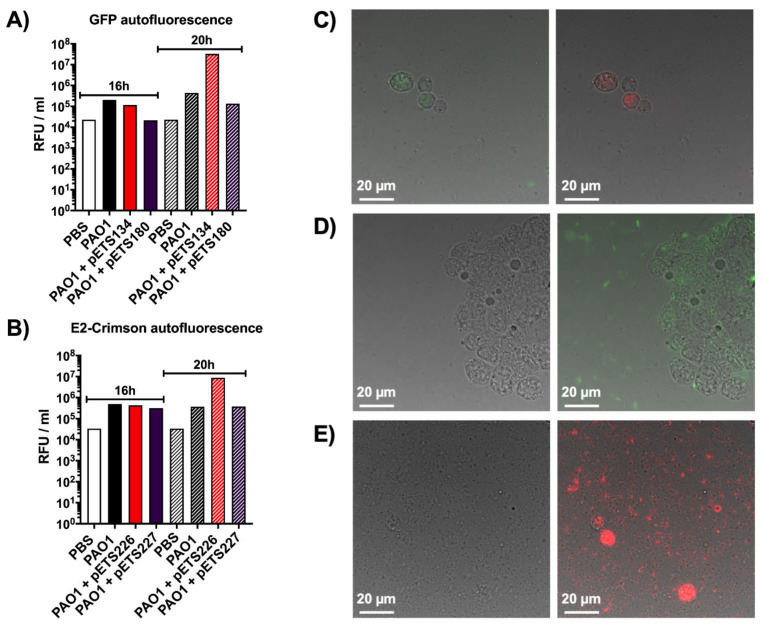
Galleria mellonella larvae are an alternative in vivo model that has been extensively used to study the virulence and pathogenicity of different bacteria due to its practicality and lack of ethical constraints. However, the larvae possess intrinsic autofluorescence that obstructs the use of fluorescent proteins to study bacterial infections, hence better methodologies are needed. Here, we report the construction of a promoter probe vector with bioluminescence expression as well as the optimization of a total bacterial RNA extraction protocol to enhance the monitoring of in vivo infections. By employing the vector to construct different gene promoter fusions, variable gene expression levels were efficiently measured in G. mellonella larvae at various time points during the course of infection and without much manipulation of the larvae. Additionally, our optimized RNA extraction protocol facilitates the study of transcriptional gene levels during an in vivo infection. The proposed methodologies will greatly benefit bacterial infection studies as they can contribute to a better understanding of the in vivo infection processes and pathogen-mammalian host interactions.
Keywords: Galleria mellonella; P. aeruginosa; bioluminescence; hemocytes; hemolymph; optimized RNA extraction; promoter probe vector; ribonucleotide reductases.
Conflict of interest statement
The authors declare no conflict of interest. The funders had no role in the design of the study; in the collection, analyses, or interpretation of data; in the writing of the manuscript, or in the decision to publish the results.
Figures


Similar articles
-
Bacterial Genetic Approach to the Study of Reactive Oxygen Species Production in Galleria mellonella During Salmonella Infection.Front Cell Infect Microbiol. 2021 Mar 1;11:640112. doi: 10.3389/fcimb.2021.640112. eCollection 2021. Front Cell Infect Microbiol. 2021. PMID: 33732665 Free PMC article.
-
Diverse effects of Galleria mellonella infection with entomopathogenic and clinical strains of Pseudomonas aeruginosa.J Invertebr Pathol. 2014 Jan;115:14-25. doi: 10.1016/j.jip.2013.10.006. J Invertebr Pathol. 2014. PMID: 24513029
-
Different defense strategies of Dendrolimus pini, Galleria mellonella, and Calliphora vicina against fungal infection.J Insect Physiol. 2007 Sep;53(9):909-22. doi: 10.1016/j.jinsphys.2007.02.016. Epub 2007 Mar 12. J Insect Physiol. 2007. PMID: 17512001
-
Galleria mellonella infection models for the study of bacterial diseases and for antimicrobial drug testing.Virulence. 2016 Apr 2;7(3):214-29. doi: 10.1080/21505594.2015.1135289. Epub 2016 Jan 5. Virulence. 2016. PMID: 26730990 Free PMC article. Review.
-
Rearing and Maintenance of Galleria mellonella and Its Application to Study Fungal Virulence.J Fungi (Basel). 2020 Aug 7;6(3):130. doi: 10.3390/jof6030130. J Fungi (Basel). 2020. PMID: 32784766 Free PMC article. Review.
Cited by
-
Interplay of Mycobacterium abscessus and Pseudomonas aeruginosa in experimental models of coinfection: Biofilm dynamics and host immune response.Virulence. 2025 Dec;16(1):2493221. doi: 10.1080/21505594.2025.2493221. Epub 2025 May 8. Virulence. 2025. PMID: 40237819 Free PMC article.
-
Modelling host-pathogen interactions: Galleria mellonella as a platform to study Pseudomonas aeruginosa response to host-imposed zinc starvation.Microbiology (Reading). 2025 Jan;171(1):001524. doi: 10.1099/mic.0.001524. Microbiology (Reading). 2025. PMID: 39841126 Free PMC article.
-
Investigating Secretion Systems and Effectors on Galleria mellonella.Methods Mol Biol. 2024;2715:601-608. doi: 10.1007/978-1-0716-3445-5_38. Methods Mol Biol. 2024. PMID: 37930555
-
Galleria mellonella as a Suitable Model of Bacterial Infection: Past, Present and Future.Front Cell Infect Microbiol. 2021 Dec 22;11:782733. doi: 10.3389/fcimb.2021.782733. eCollection 2021. Front Cell Infect Microbiol. 2021. PMID: 35004350 Free PMC article. Review.
-
Human breast milk isolated lactic acid bacteria: antimicrobial and immunomodulatory activity on the Galleria mellonella burn wound model.Front Cell Infect Microbiol. 2024 Sep 6;14:1428525. doi: 10.3389/fcimb.2024.1428525. eCollection 2024. Front Cell Infect Microbiol. 2024. PMID: 39310784 Free PMC article.
References
-
- Benthall G., Touzel R.E., Hind C.K., Titball R.W., Sutton J.M., Thomas R.J., Wand M.E. Evaluation of Antibiotic Efficacy Against Infections Caused by Planktonic or Biofilm Cultures of Pseudomonas aeruginosa and Klebsiella pneumoniae in Galleria mellonella. Int. J. Antimicrob. Agents. 2015;46:538–545. doi: 10.1016/j.ijantimicag.2015.07.014. - DOI - PubMed
Grants and funding
LinkOut - more resources
Full Text Sources
Other Literature Sources
