

Immune landscape of periodontitis unveils alterations of infiltrating immunocytes and molecular networks-aggregating into an interactive web-tool for periodontitis related immune analysis and visualization
- PMID: 33208145
- PMCID: PMC7672958
- DOI: 10.1186/s12967-020-02616-1
Immune landscape of periodontitis unveils alterations of infiltrating immunocytes and molecular networks-aggregating into an interactive web-tool for periodontitis related immune analysis and visualization
Retraction in
-
Retraction Note: Immune landscape of periodontitis unveils alterations of infiltrating immunocytes and molecular networks-aggregating into an interactive web-tool for periodontitis related immune analysis and visualization.J Transl Med. 2024 Nov 4;22(1):993. doi: 10.1186/s12967-024-05812-5. J Transl Med. 2024. PMID: 39497171 Free PMC article. No abstract available.
Abstract
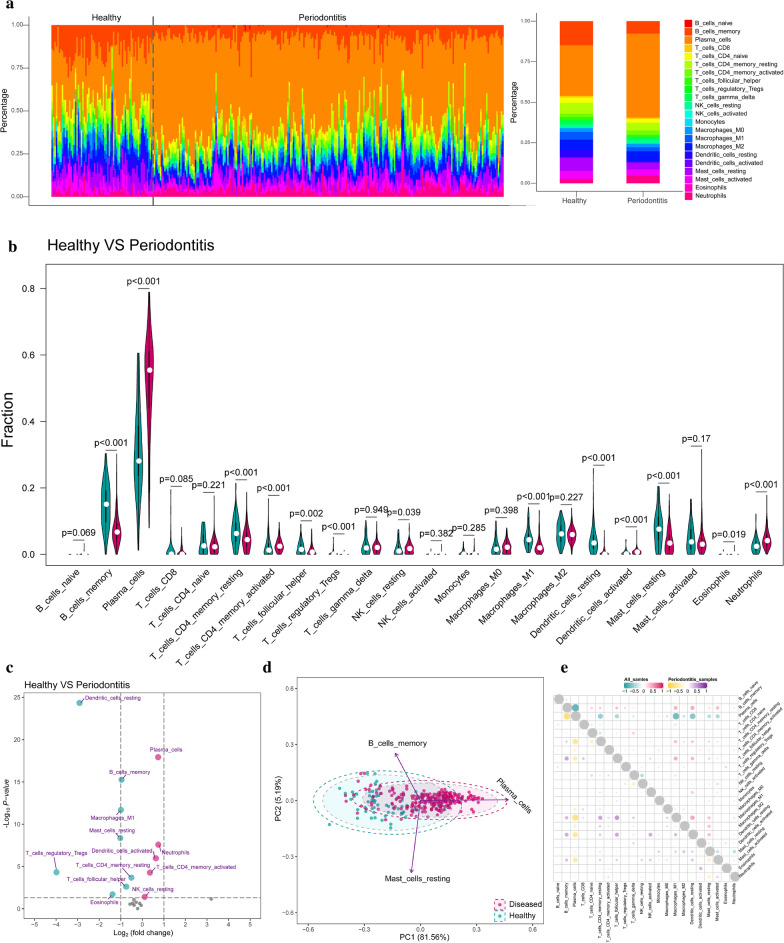
Background: Immunity reaction plays an essential role in periodontitis progress and we aim to investigate the underlying regulatory network of immune reactions in periodontitis.
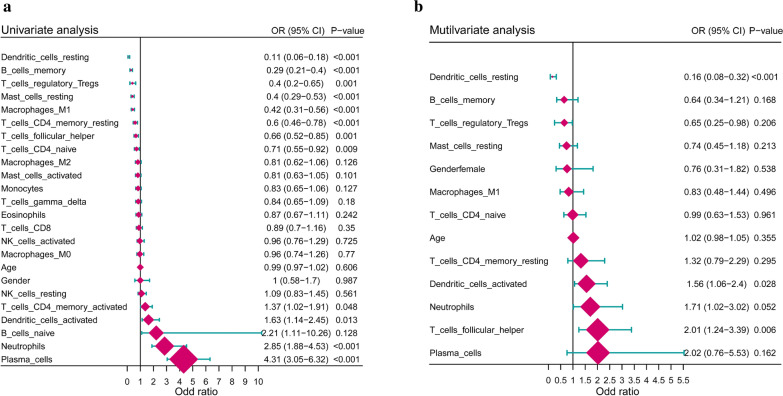
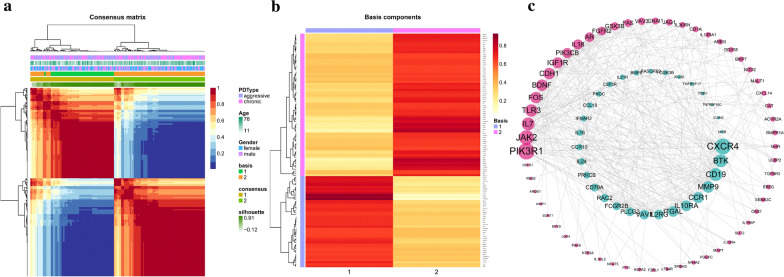
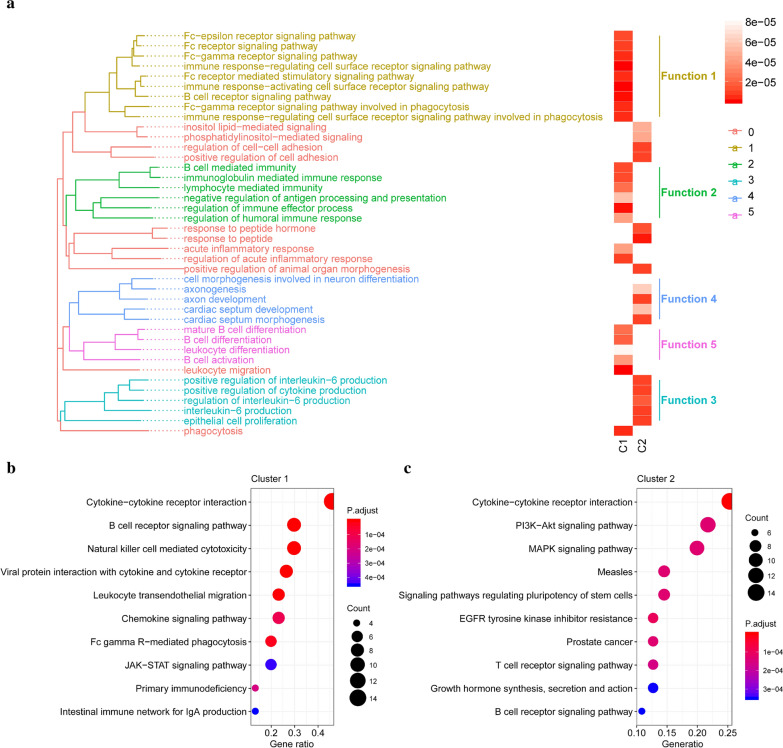
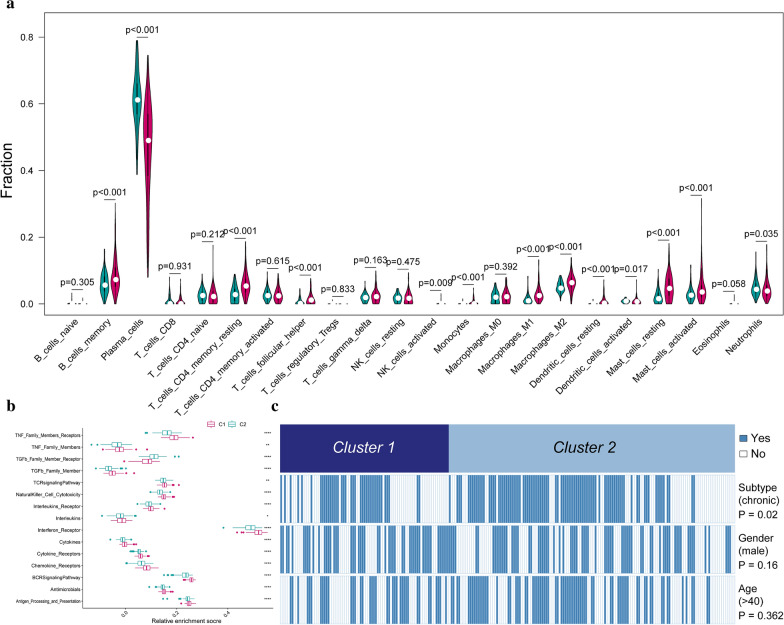
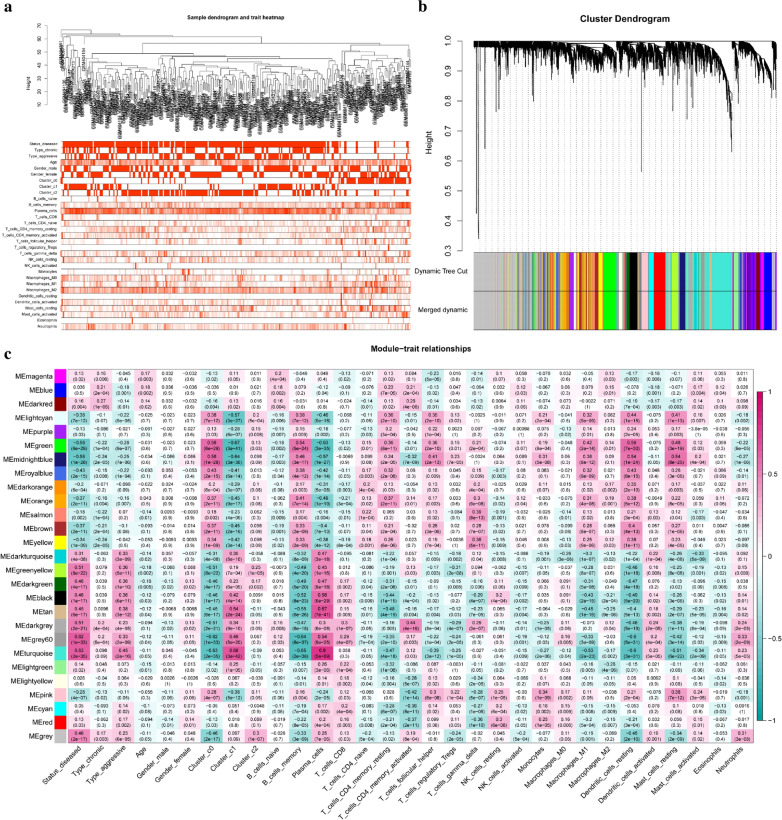
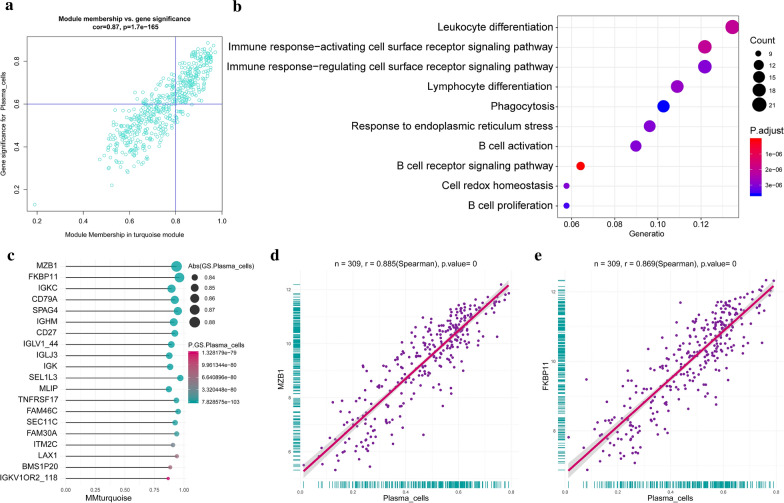
Methods: CIBERSORT was used to estimate immunocyte fractions in different clinical statuses. Logistic regression was used to assess the immunocyte weight in periodontitis. Immune-related periodontitis subtypes were identified by the Nonnegative Matrix Factorization algorithm. Gene-set enrichment analysis and Gene-set variation analysis were conducted to analyze pathway activities. Immunocytes related gene modules were identified by Weighted gene co-expression network analysis.
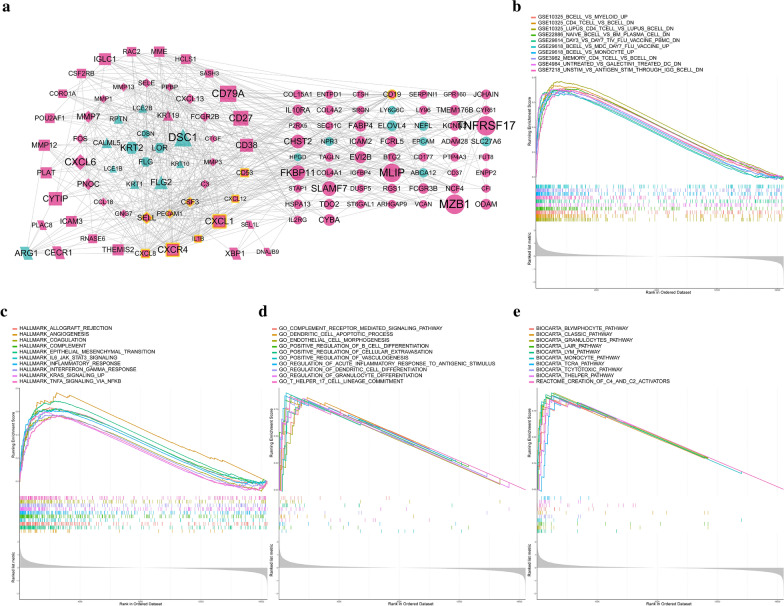
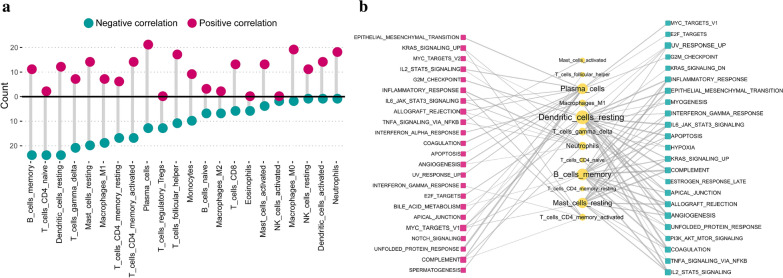
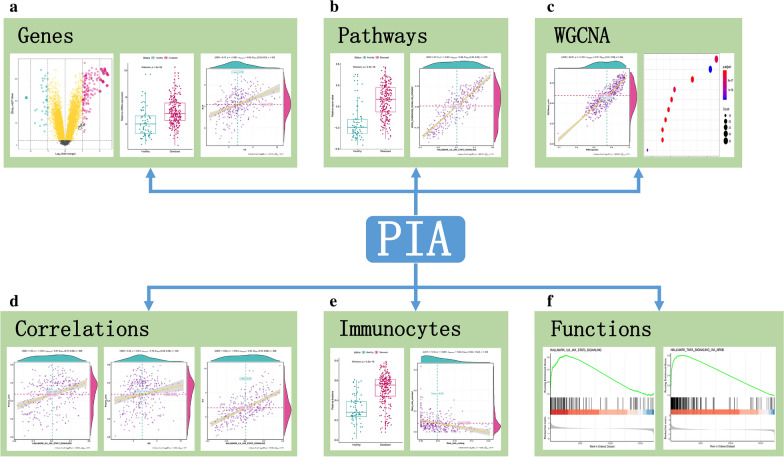
Results: Altered immunocytes in healthy versus periodontitis, aggressive versus chronic, male versus female and age were identified. Immunocytes enriched in periodontitis were calculated, and their correlation was also explored. Two distinct immune-related periodontitis subtypes were identified and one is characterized by B cell reactions and the other is IL-6 cytokine reactions. 463 statistically significant correlations between 22 immunocytes and pathways were revealed. Immunocytes and clinical phenotypes matched their gene modules, and their functions were annotated. Last, an easy-to-use and user-friendly interactive web-tool were developed for periodontitis related immune analysis and visualization ( https://118.24.100.193:3838/tool-PIA/ ).
Conclusions: This study systematically investigated periodontitis immune atlas and caught a glimpse of the underlying mechanism of periodontitis from gene-pathway-immunocyte networks, which can not only inspire researchers but also help them in periodontitis related immune researches.
Keywords: Bioinformatics; Gene; Immune; Immunocyte; Pathway; Periodontitis; Web-tool.
Conflict of interest statement
The authors declare that they have no competing interests.
Figures
Similar articles
-
Identification of immune-related lncRNAs in periodontitis reveals regulation network of gene-lncRNA-pathway-immunocyte.Int Immunopharmacol. 2020 Jul;84:106600. doi: 10.1016/j.intimp.2020.106600. Epub 2020 May 14. Int Immunopharmacol. 2020. PMID: 32417654
-
Retraction Note: Immune landscape of periodontitis unveils alterations of infiltrating immunocytes and molecular networks-aggregating into an interactive web-tool for periodontitis related immune analysis and visualization.J Transl Med. 2024 Nov 4;22(1):993. doi: 10.1186/s12967-024-05812-5. J Transl Med. 2024. PMID: 39497171 Free PMC article. No abstract available.
-
Integrated analyses revealed the potential role and immune link of mitochondrial dysfunction between periodontitis and type 2 diabetes mellitus.Int Immunopharmacol. 2024 Mar 30;130:111796. doi: 10.1016/j.intimp.2024.111796. Epub 2024 Mar 7. Int Immunopharmacol. 2024. PMID: 38452412
-
Identification and validation of a classifier based on hub aging-related genes and aging subtypes correlation with immune microenvironment for periodontitis.Front Immunol. 2022 Nov 1;13:1042484. doi: 10.3389/fimmu.2022.1042484. eCollection 2022. Front Immunol. 2022. PMID: 36389665 Free PMC article.
-
Development of a classification model and an immune-related network based on ferroptosis in periodontitis.J Periodontal Res. 2023 Apr;58(2):403-413. doi: 10.1111/jre.13100. Epub 2023 Jan 18. J Periodontal Res. 2023. PMID: 36653725
Cited by
-
MicroRNAs: Harbingers and shapers of periodontal inflammation.Semin Cell Dev Biol. 2022 Apr;124:85-98. doi: 10.1016/j.semcdb.2021.05.030. Epub 2021 Jun 10. Semin Cell Dev Biol. 2022. PMID: 34120836 Free PMC article. Review.
-
Sema3A Drives Alternative Macrophage Activation in the Resolution of Periodontitis via PI3K/AKT/mTOR Signaling.Inflammation. 2023 Jun;46(3):876-891. doi: 10.1007/s10753-022-01777-z. Epub 2023 Jan 4. Inflammation. 2023. PMID: 36598593
-
Exploring the Potential of Micro-Immunotherapy in the Treatment of Periodontitis.Life (Basel). 2024 Apr 25;14(5):552. doi: 10.3390/life14050552. Life (Basel). 2024. PMID: 38792574 Free PMC article. Review.
-
m6A regulator-mediated RNA methylation modification patterns are involved in immune microenvironment regulation of periodontitis.J Cell Mol Med. 2021 Apr;25(7):3634-3645. doi: 10.1111/jcmm.16469. Epub 2021 Mar 16. J Cell Mol Med. 2021. PMID: 33724691 Free PMC article.
-
Identification of Endoplasmic Reticulum Stress-Related Biomarkers of Periodontitis Based on Machine Learning: A Bioinformatics Analysis.Dis Markers. 2022 Aug 29;2022:8611755. doi: 10.1155/2022/8611755. eCollection 2022. Dis Markers. 2022. PMID: 36072904 Free PMC article. Clinical Trial.
References
Publication types
MeSH terms
LinkOut - more resources
Full Text Sources
