

Occurrence, mortality and cost of brain disorders in Denmark: a population-based cohort study
- PMID: 33208323
- PMCID: PMC7674107
- DOI: 10.1136/bmjopen-2020-037564
Occurrence, mortality and cost of brain disorders in Denmark: a population-based cohort study
Abstract
Objectives: To examine the occurrence of brain disorders (ie, neurological and mental disorders) in Denmark and mortality and cost of illness among affected persons.
Design: Matched cohort study.
Setting: We obtained routinely collected registry data on all Danish residents during 1995-2015.
Participants: We identified all persons alive on 1 January 2015 with a diagnosis of 25 specific brain disorders (prevalent cohort) and all persons with an incident diagnosis during 2011-2015 (incident cohort). Each person was matched on age and sex with 10 persons from the general population without the brain disorder of interest.
Primary and secondary outcome measures: Prevalence and incidence of hospital-diagnosed brain disorders, 1-year absolute and relative mortality, and attributable direct and indirect costs of illness compared with the corresponding matched cohorts.
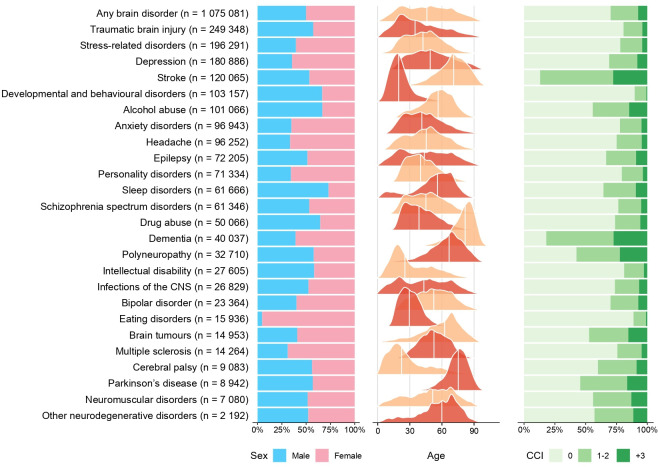
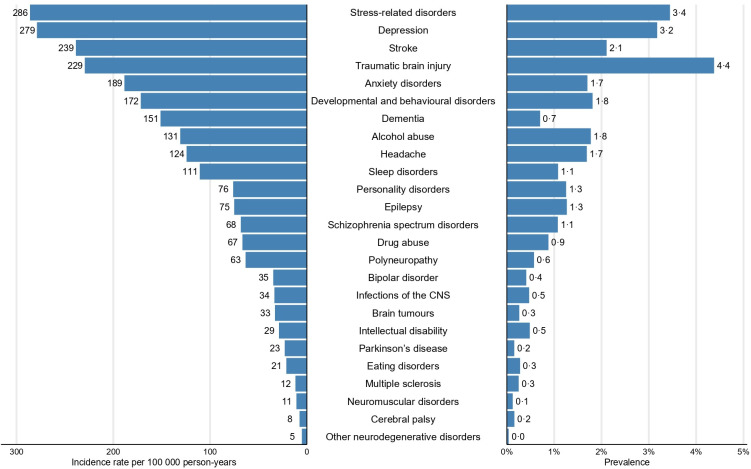
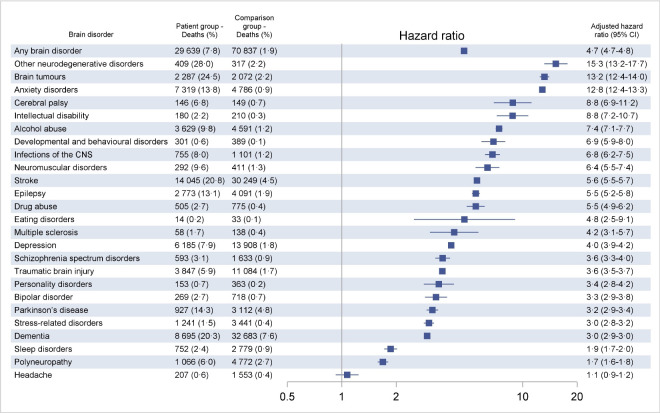
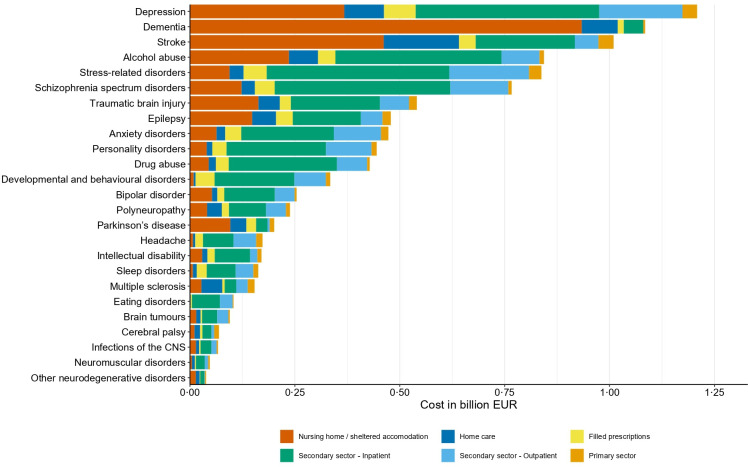
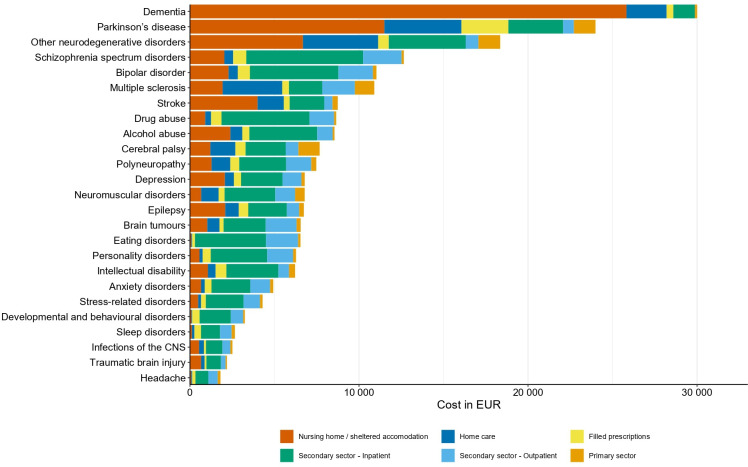
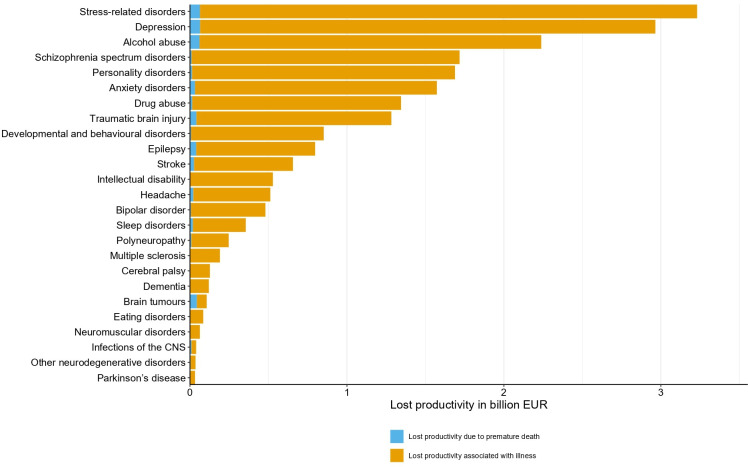
Results: We identified 1 075 081 persons with at least one prevalent brain disorder (any brain disorder) on 1 January 2015, corresponding to 18.9% of the Danish population. The incidence rate of any brain disorder during 2011-2015 was 1349 per 100 000 person-years (95% CI 1345 to 1353). One-year mortality after diagnosis was increased in persons with any brain disorder (HR 4.7, 95% CI 4.7 to 4.8) and in persons in every group of specific brain disorders compared with the matched cohort from the general population. The total attributable direct costs of brain disorders in 2015 were €5.2 billion and total attributable indirect costs were €11.2 billion. Traumatic brain injury, stress-related disorders, depression and stroke were the most common brain disorders. Attributable costs were highest for depression, dementia, stress-related disorders and stroke.
Conclusions: One in five Danish residents alive on 1 January 2015 had been diagnosed with at least one brain disorder, and mortality was five times higher in persons with any diagnosed brain disorder than in the general population. We found high attributable direct and indirect costs of brain disorders.
Keywords: epidemiology; health economics; neurology; psychiatry.
© Author(s) (or their employer(s)) 2020. Re-use permitted under CC BY-NC. No commercial re-use. See rights and permissions. Published by BMJ.
Conflict of interest statement
Competing interests: None declared.
Figures
References
-
- OECD EU Health at a glance: Europe 2018: state of health in the EU cycle. Paris/European Union, Brussels, 2018. Available: 10.1787/health_glance_eur-2018-en 10.1787/health_glance_eur-2018-en - DOI
Publication types
MeSH terms
LinkOut - more resources
Full Text Sources
Medical