. 2021 Feb 15;27(4):1139-1149.
doi: 10.1158/1078-0432.CCR-20-3139. Epub 2020 Nov 18.

Cobomarsen, an Oligonucleotide Inhibitor of miR-155, Slows DLBCL Tumor Cell Growth In Vitro and In Vivo

Affiliations

Cobomarsen, an Oligonucleotide Inhibitor of miR-155, Slows DLBCL Tumor Cell Growth In Vitro and In Vivo

Eleni Anastasiadou et al. Clin Cancer Res. .

Abstract

Purpose: miRNA-155 is an oncogenic miRNA highly expressed in B-cell malignancies, particularly in the non-germinal center B-cell or activated B-cell subtype of diffuse large B-cell lymphoma (ABC-DLBCL), where it is considered a potential diagnostic and prognostic biomarker. Thus, miR-155 inhibition represents an important therapeutic strategy for B-cell lymphomas. In this study, we tested the efficacy and pharmacodynamic activity of an oligonucleotide inhibitor of miR-155, cobomarsen, in ABC-DLBCL cell lines and in corresponding xenograft mouse models. In addition, we assessed the therapeutic efficacy and safety of cobomarsen in a patient diagnosed with aggressive ABC-DLBCL.

Experimental design: Preclinical studies included the delivery of cobomarsen to highly miR-155-expressing ABC-DLBCL cell lines to assess any phenotypic changes, as well as intravenous injections of cobomarsen in NSG mice carrying ABC-DLBCL xenografts, to study tumor growth and pharmacodynamics of the compound over time. To begin to test its safety and therapeutic efficacy, a patient was recruited who underwent five cycles of cobomarsen treatment.

Results: Cobomarsen decreased cell proliferation and induced apoptosis in ABC-DLBCL cell lines. Intravenous administration of cobomarsen in a xenograft NSG mouse model of ABC-DLBCL reduced tumor volume, triggered apoptosis, and derepressed direct miR-155 target genes. Finally, the compound reduced and stabilized tumor growth without any toxic effects for the patient.

Conclusions: Our findings support the potential therapeutic application of cobomarsen in ABC-DLBCL and other types of lymphoma with elevated miR-155 expression.


Figures

Figure 1.:
Figure 1.:
High expression of miR-155 in DLBCL cell lines and correlation with target gene expression. A, The fold change of miR-155 expression in three ABC-type DLBCL cell lines was assessed by qRT-PCR. MiR-155 fold change was compared with CD19 B+ isolated from healthy donors and normalized to RNU6 housekeeping gene. Statistical analysis was performed with unpaired, two-tailed t test: ****, P < 0.0001. Fold change represents the average (±SD) of three independent experiments, each performed in technical triplicates. B, The fold change of miR-155 target genes, HIVEP2, TP53INP1, and MAFB expression was assessed by qRT-PCR: The fold change expression of each target gene in each cell line was compared with the one of CD19 B+ cells and was normalized to GAPDH. Unpaired, two-tailed t test was applied: ****, P < 0.0001. Fold change represents the average (±SD) of three independent experiments, each performed in technical triplicates.
Figure 2.:
Figure 2.:
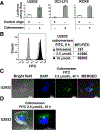
Unassisted delivery of cobomarsen in ABC-DLBCL cell lines. A, Reduction in endogenous miR-155 activity by cobomarsen: Luciferase activity was measured 24 hours after treatment with cobomarsen or control oligonucleotide. Each treatment was performed in triplicates, and the experiment was repeated three times. Relative luminescence units (RLU) indicate the ratio of Renilla luciferase (hRluc) expression normalized against firefly luciferase (fluc), (hRluc/fluc), of the miR-155 biosensor. The control oligo– and cobomarsen-treated cell lines were compared. Unpaired, two-tailed t test was applied as a mean value for each experiment repeated three times and in triplicates. The calculated P values between control oligo–treated versus cobomarsen-treated cell line are: U2932: **, P < 0.01; OCI-LY3: ****, P < 0.0001; RCK8: ***, P < 0.001. B, Cobomarsen uptake in recipient lymphoma cells: Two different concentrations (2.5 μmol/L, 10 μmol/L) of FITC-conjugated cobomarsen were directly added in the culture of U2932 cell line. Histograms show the MFI at both concentrations compared with the cobomarsen untreated cells, at 6 hours postdelivery. MFI was measured by flow cytometer, and the data were analyzed by Kaluza for Gallios Software. C and D, Subcellular localization of cobomarsen: C, Confocal microscopy images of 2.5 μmol/L FITCH-conjugated cobomarsen in U2932 cell line at 48 hours postdelivery. D, A higher magnification (20×) demonstrates cobomarsen as green fluorescent dot next to the nucleus, blue colored, with 4′,6-diamidino-2-phenylindole (DAPI). Confocal images were acquired using 20× and 10× objectives with the Zeiss LSM 880 confocal microscope.
Figure 3.:
Figure 3.:
Proliferation and apoptosis in DLBCL cell lines upon cobomarsen treatment. A, The proliferation graphs indicate luminescence (RLU) measurements as a ratio of cobomarsen/control oligonucleotide RLU at 48, 72, and 96 hours postdelivery of 10 μmol/L cobomarsen or 10 μmol/L control oligonucleotide. The experiment was performed three times and in triplicates. Unpaired, two-tailed t test was applied to calculate the statistical significance of the difference between the average of RLU ratio measurements at 72 and 96 hours compared with corresponding average of RLU at 48 hours. *, P < 0.05; **, P < 0.01. B, Annexin V/PI measurement of late apoptotic cells (double stained for Annexin V and PI) 96 hours following treatment with 10 μmol/L cobomarsen. For each cell line, the % of late apoptotic cells upon treatment was compared with the % of untreated cells, by setting the same threshold. One out of three representative experiments is shown. The histograms for each cell line, at the right side of the figure, show the mean values from three independent apoptosis assays, comparing the % of untreated, control oligonucleotide– and cobomarsen-treated cells. U2932: *, P < 0.05; **, P < 0.01; ****, P < 0.0001. OCY-LY3: *, P < 0.05; **, P < 0.01; ***, P < 0.001. RCK8: **, P < 0.01; ***, P < 0.001. Statistical analysis was performed with unpaired, two-tailed t test. Kaluza for Gallios Software was used for analysis.
Figure 4.:
Figure 4.:
Effect of cobomarsen on tumor growth in vivo. A, Timeline of in vivo inoculations of cobomarsen and control oligonucleotide: The tumors began to grow 9–12 days after injection. Mice were enrolled in the study when the tumor volume reached a range of 150–200 mm3. Subsequently, 12 mice were injected intravenously with 100 μL PBS and 12mice with 1 mg/kg cobomarsen. In parallel, 3mice were injected with 100 μL PBS and 3 mice with 1 mg/kg of a control oligonucleotide on days 0, 2, 4, and 7 after enrollment. Seventy-two hours after the last dose, mice were euthanized. All tumor volume measurements were taken before the injections. B, Tumor growth: The mean value of the calculated volumes (mm3) of the xenografts at the indicated time points, in 12 mice treated with 1 mg/kg cobomarsen in comparison with the mean of the calculated volumes in 12 mice treated with 100 μL PBS, show a significant reduction in time, at the 7th day and at the 10th day, of 12 mice. **, P < 0.01; ****, P < 0.0001. C, Tumor growth: The mean value of the calculated volumes (mm3) of the xenografts and in the indicated time points shows no difference between the groups of 3mice treated with 100 μL PBS compared with the group of 3mice treated with 1 mg/mL control oligo. The statistical significance of the mean value of the tumor volumes in different time points between the groups of mice was performed using two-way ANOVA with Sidak multiple comparisons test.
Figure 5.:
Figure 5.:
Cobomarsen derepresses miR-155 target gene expression in vivo and in vitro. A, Timeline of cobomarsen-treated xenografts used to assess pharmacodynamic effects: Mice were randomly enrolled into groups when tumors reached a volume of 150–200mm3 (N = 8 for each of three groups; PBS, control oligonucleotide, and cobomarsen). Mice were injected intravenously with either PBS, 1 mg/kg control oligonucleotide, or 1 mg/kg cobomarsen at 0 and 48 hours after enrollment. Twenty-four hours after the last dose, mice were sacrificed and tumor tissue was harvested. B, Cobomarsen induces tumor apoptosis: Detection of apoptotic cells in mice tumor tissues 24 hours following the final dose of PBS, control oligonucleotide, or cobomarsen. Three representative photos of mouse tumor tissue cryosections processed with the TUNEL chromogenic apoptotic assay. Chromogen 3,3′-diaminobenzidine staining reveals the brown spots that indicate apoptotic cells. The analysis was performed for a total of 4–10 fields per tumor. The results are reported as arbitrary unit (AU) and represent an average value from 3 mice per treatment (PBS, 1 mg/kg-control oligonucleotide, 1 mg/kg cobomarsen). Statistical analysis was performed with unpaired, two-tailed t test. **, P < 0.01 for cobomarsen versus PBS, and for cobomarsen versus control oligo. C, Drug distribution in tumor tissue: Quantification of cobomarsen in the tumors from treated mice (n = 8), represented by black dots, using S1 nuclease protection assay. D, qRT-PCR analysis ofmiR-155 target gene expression in cobomarsen-treated xenografts: Mice were euthanized, and tumors were harvested 24 hours after the last injection with either PBS, control oligonucleotide, or cobomarsen. RNA was extracted from tumors, and the expression of direct miR-155 target genes was evaluated by qRT-PCR. Two-way ANOVA, Tukey multiple comparison test, between the mean values of miR-155 target gene expression per treatment from group of mice treated with PBS versus oligonucleotide control treated, ****, P < 0.0001 and between the group of mice treated with oligonucleotide versus cobomarsen treated ***, P < 0.001. N = 8 mice per group. E, miR-155 target genes are derepressed in cobomarsen-treated DLBCL cell lines: qRT-PCR analysis of miR-155 target genes CUX1 and WEE1 upon treatment with 10 μmol/L cobomarsen, at 96 hours in U2932, OCI-LY3, and RCK8 DLBCLs. For U2932 CUX1: ****, P < 0.0001 andWEE1 ***, P < 0.001; **, P < 0.01. For OCI-LY3 CUX1: ***, P < 0.001 and WEE1: **, P < 0.01. For RCK8 CUX1, n.s.: P = 0.1851 and WEE1: *, P < 0.05. P values were calculated with unpaired, two-tailed t test. The experiment was performed in triplicates and repeated at least two times.
Figure 6.:
Figure 6.:
Patient’s lymph node (LN) measurements over time, during the cobomarsen treatment. The longest axis of right (R) cervical LN, R inguinal LN, and left (L) inguinal LN was measured with a ruler after palpable medical examinations of the tumor mass. The size of the tumor mass in centimeters was assessed at the indicated days for each of the five cycles. Cobomarsen i.v. injections (600 mg/injection) were performed at the same day as the physical exams and measurements (1st cycle: 6 injections; 2nd, 3rd, and 4th cycle: 4 injections/cycle; and 5th cycle: 3 injections). LN, measurements were performed during physical examination, at the days indicated in the graph: for R cervical LN, the measurements were started at cycle 1, day 1, while for R inguinal LN, measurements were started at cycle 1, day 3. L inguinal LN was noted during cycle 3 on the 22nd day.

References

    1. Alizadeh AA, Eisen MB, Davis RE, Ma C, Lossos IS, Rosenwald A, et al. Distinct types of diffuse large B-cell lymphoma identified by gene expression profiling. Nature 2000;403:503–11. - PubMed
    1. Li S, Young KH, Medeiros LJ. Diffuse large B-cell lymphoma. Pathology 2018;50: 74–87. - PubMed
    1. Sehn LH, Berry B, Chhanabhai M, Fitzgerald C, Gill K, Hoskins P, et al. The revised International Prognostic Index (R-IPI) is a better predictor of outcome than the standard IPI for patients with diffuse large B-cell lymphoma treated with R-CHOP. Blood 2007;109:1857–61. - PubMed
    1. Nowakowski GS, Czuczman MS. ABC, GCB, and double-hit diffuse large B-cell lymphoma: does subtype make a difference in therapy selection? Am Soc Clin Oncol Educ Book 2015:e449–57. - PubMed
    1. Chapuy B, Stewart C, Dunford AJ, Kim J, Kamburov A, Redd RA, et al. Molecular subtypes of diffuse large B cell lymphoma are associated with distinct pathogenic mechanisms and outcomes. Nat Med 2018;24:679–90. - PMC - PubMed

Publication types

MeSH terms