. 2020 Nov 18;6(47):eabc6457.
doi: 10.1126/sciadv.abc6457. Print 2020 Nov.

Network-based atrophy modeling in the common epilepsies: A worldwide ENIGMA study

Sara Larivière  1 Raúl Rodríguez-Cruces  1 Jessica Royer  1 Maria Eugenia Caligiuri  2 Antonio Gambardella  2   3 Luis Concha  4 Simon S Keller  5   6 Fernando Cendes  7 Clarissa Yasuda  7 Leonardo Bonilha  8 Ezequiel Gleichgerrcht  8 Niels K Focke  9 Martin Domin  10 Felix von Podewills  11 Soenke Langner  12 Christian Rummel  13 Roland Wiest  13 Pascal Martin  14 Raviteja Kotikalapudi  14 Terence J O'Brien  15   16 Benjamin Sinclair  15   16 Lucy Vivash  15   16 Patricia M Desmond  16 Saud Alhusaini  17   18 Colin P Doherty  19   20 Gianpiero L Cavalleri  17   20 Norman Delanty  17   20 Reetta Kälviäinen  21   22 Graeme D Jackson  23 Magdalena Kowalczyk  23 Mario Mascalchi  24 Mira Semmelroch  23 Rhys H Thomas  25 Hamid Soltanian-Zadeh  26   27 Esmaeil Davoodi-Bojd  28 Junsong Zhang  29 Matteo Lenge  30   31 Renzo Guerrini  30 Emanuele Bartolini  32 Khalid Hamandi  33   34 Sonya Foley  34 Bernd Weber  35 Chantal Depondt  36 Julie Absil  37 Sarah J A Carr  38 Eugenio Abela  38 Mark P Richardson  38 Orrin Devinsky  39 Mariasavina Severino  40 Pasquale Striano  40 Domenico Tortora  40 Sean N Hatton  41 Sjoerd B Vos  42   43   44 John S Duncan  42   43 Christopher D Whelan  17 Paul M Thompson  45 Sanjay M Sisodiya  42   43 Andrea Bernasconi  46 Angelo Labate  2   3 Carrie R McDonald  47 Neda Bernasconi  46 Boris C Bernhardt  48
Affiliations

Network-based atrophy modeling in the common epilepsies: A worldwide ENIGMA study

Sara Larivière et al. Sci Adv. .

Abstract

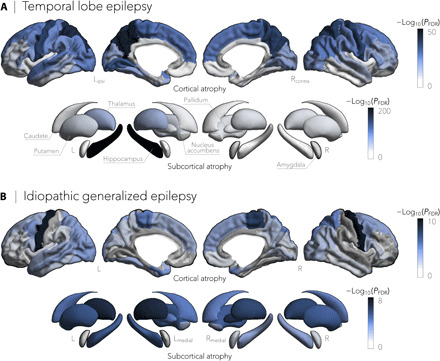
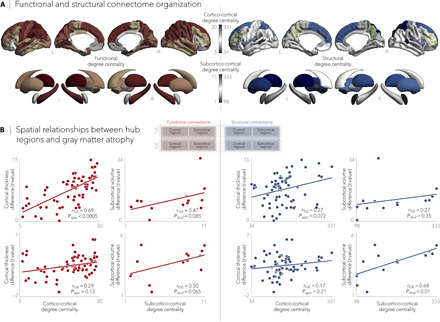
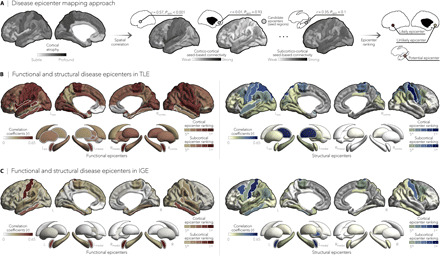
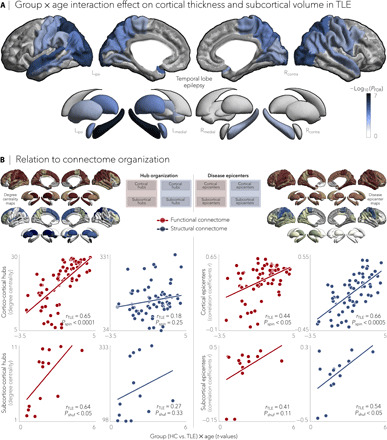
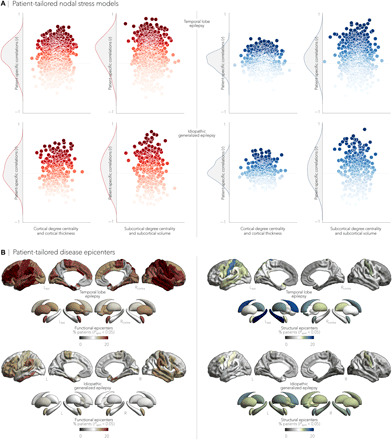
Epilepsy is increasingly conceptualized as a network disorder. In this cross-sectional mega-analysis, we integrated neuroimaging and connectome analysis to identify network associations with atrophy patterns in 1021 adults with epilepsy compared to 1564 healthy controls from 19 international sites. In temporal lobe epilepsy, areas of atrophy colocalized with highly interconnected cortical hub regions, whereas idiopathic generalized epilepsy showed preferential subcortical hub involvement. These morphological abnormalities were anchored to the connectivity profiles of distinct disease epicenters, pointing to temporo-limbic cortices in temporal lobe epilepsy and fronto-central cortices in idiopathic generalized epilepsy. Negative effects of age on atrophy further revealed a strong influence of connectome architecture in temporal lobe, but not idiopathic generalized, epilepsy. Our findings were reproduced across individual sites and single patients and were robust across different analytical methods. Through worldwide collaboration in ENIGMA-Epilepsy, we provided deeper insights into the macroscale features that shape the pathophysiology of common epilepsies.


Figures

Fig. 1
Fig. 1. Cortical thickness and subcortical volume in TLE and IGE.
(A) Cortical thickness and subcortical volume reductions in TLE (n = 732), compared to healthy controls (n = 1418), spanned bilateral precuneus (PFDR < 4 × 10−36), precentral (PFDR < 8 × 10−36), paracentral (PFDR < 6 × 10⁻²⁹), and superior temporal (PFDR < 3 × 10⁻¹⁴) cortices and ipsilateral hippocampus (PFDR < 2 × 10−199) and thalamus (PFDR < 5 × 10−64). (B) In contrast, gray matter cortical and subcortical atrophy in IGE (n = 289), relative to controls (n = 1075), was more subtle and affected predominantly bilateral precentral cortical regions (PFDR < 9 × 10⁻¹⁰) and the thalamus (PFDR < 3 × 10⁻⁶). Negative log10-transformed FDR-corrected P values are shown.
Fig. 2
Fig. 2. Epilepsy-related atrophy correlates with hub organization.
(A) Normative functional and structural network organization, derived from the HCP dataset, was used to identify hubs (i.e., regions with greater degree centrality). (B) Schematic of the figure layout is pictured in the middle. Gray matter atrophy related to node-level functional (left) and structural (right) maps of degree centrality, with greater atrophy in hub compared to nonhub regions. Stratifying findings across TLE and IGE, we observed stronger associations between cortico-cortical functional hubs and cortical atrophy patterns in TLE (Pspin < 0.0001) and between subcortical volume loss and subcortico-cortical structural hubs in IGE (Pshuf < 0.01).
Fig. 3
Fig. 3. Syndrome-specific disease epicenters.
(A) Disease epicenter mapping schema. Spatial correlations between cortical atrophy patterns and seed-based cortico- and subcortico-cortical connectivity were used to identify disease epicenters in TLE and IGE. Epicenters are regions whose connectivity profiles significantly correlated with the syndrome-specific atrophy map; statistical significance was assessed using spin permutation tests. This procedure was repeated systematically to assess the epicenter value of every cortical and subcortical region, as well as in both functional and structural connectivity matrices. (B and C) Correlation coefficients indexing spatial similarity between TLE- and IGE-specific atrophy and seed-based functional (left) and structural (right) connectivity measures for every cortical and subcortical region. Regions with significant associations were ranked in descending order based on their correlation coefficients, with the first five regions identified as disease epicenters (white outline). In TLE, ipsilateral temporo-limbic cortices (functional: Pspin < 0.05, structural: Pspin < 0.1) and subcortical areas—including ipsilateral amygdala (functional: Pspin < 0.05), thalamus (functional: Pspin < 0.05, structural: Pspin < 0.01), pallidum (functional: Pspin < 0.05), putamen (functional: Pspin < 0.05), and hippocampus (functional: Pspin < 0.1)—emerged as disease epicenters. In IGE, the highest ranked disease epicenters were located in bilateral fronto-central cortices, including postcentral gyri (functional: Pspin < 0.05, structural: Pspin < 0.05), left (functional: Pspin < 0.005, structural: Pspin < 0.1) and right amygdala (functional: Pspin < 0.005), and left pallidum (structural: Pspin < 0.1). *Pspin < 0.1, n.s., nonsignificant.
Fig. 4
Fig. 4. Negative effects of age on cortical thickness and subcortical volume in TLE.
(A) Significant age-related differences on gray matter atrophy between individuals with TLE and healthy controls for all cortical and subcortical regions. Patients with TLE showed a negative effect of age on cortical thickness in bilateral temporo-parietal (PFDR < 0.005) and sensorimotor (PFDR < 0.01) cortices and on subcortical volume in ipsilateral hippocampus (PFDR < 5 × 10⁻⁷) and bilateral thalamus (PFDR < 0.05). Negative log10-transformed FDR-corrected P values are shown. (B) Schematic of the figure layout is provided in the middle. Scatterplots depict relationships between the age-related effects and functional (red) and structural (blue) maps of degree centrality (left) and disease epicenter (right). Significant associations were observed between age-related effects and every hub and epicenter measures, with the exception of structural subcortical degree centrality, suggesting a role of connectome organization on age-related effects in TLE.
Fig. 5
Fig. 5. Patient-tailored atrophy modeling.
(A) Patient-specific associations between degree centrality (denoting hub distribution) and individualized atrophy maps showed high stability between functional cortico-cortical hubs and cortical atrophy in TLE (Pspin < 0.05 in 22.4% of patients) and high stability between structural cortico-cortical hubs and cortical atrophy in IGE (Pspin < 0.05 in 15.2% of patients). (B) We identified patient-specific structural and functional disease epicenters by keeping brain regions whose connectivity profiles significantly correlated with the patient’s atrophy map (Pspin < 0.05). In TLE, ipsilateral temporo-limbic regions and subcortical areas (including the hippocampus) were most often identified as epicenters of gray matter atrophy, whereas in IGE, bilateral fronto-central (including sensorimotor cortices) and subcortical areas most often emerged as disease epicenters. Disease epicenters in individual patients strongly resembled those seen across the group as a whole.

References

    1. Avena-Koenigsberger A., Misic B., Sporns O., Communication dynamics in complex brain networks. Nat. Rev. Neurosci. 19, 17–33 (2017). - PubMed
    1. Fornito A., Zalesky A., Breakspear M., The connectomics of brain disorders. Nat. Rev. Neurosci. 16, 159–172 (2015). - PubMed
    1. Engel J. Jr., Thompson P. M., Stern J. M., Staba R. J., Bragin A., Mody I., Connectomics and epilepsy. Curr. Opin. Neurol. 26, 186–194 (2013). - PMC - PubMed
    1. Richardson M. P., Large scale brain models of epilepsy: Dynamics meets connectomics. J. Neurol. Neurosurg. Psychiatry 83, 1238–1248 (2012). - PubMed
    1. Bernhardt B. C., Bernasconi A., Liu M., Hong S.-J., Caldairou B., Goubran M., Guiot M. C., Hall J., Bernasconi N., The spectrum of structural and functional imaging abnormalities in temporal lobe epilepsy. Ann. Neurol. 80, 142–153 (2016). - PubMed

Publication types