. 2020 Nov 18;6(47):eabc9920.
doi: 10.1126/sciadv.abc9920. Print 2020 Nov.

Dendritic and parallel processing of visual threats in the retina control defensive responses

Affiliations

Dendritic and parallel processing of visual threats in the retina control defensive responses

T Kim et al. Sci Adv. .

Abstract

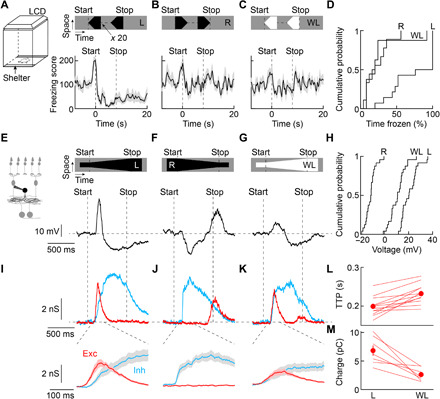
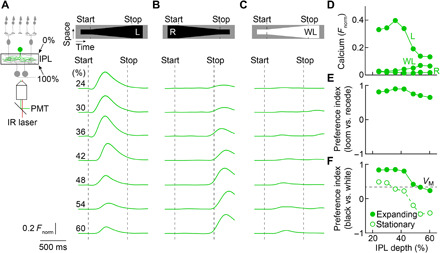
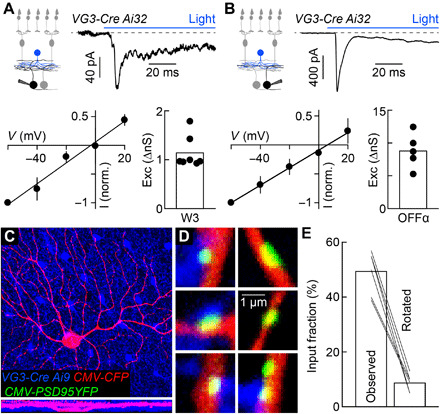
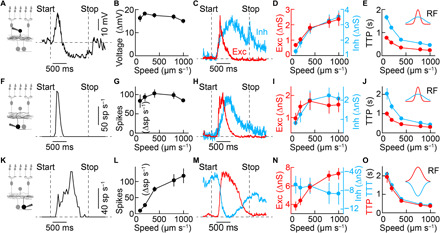
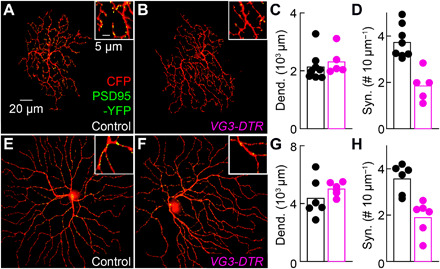
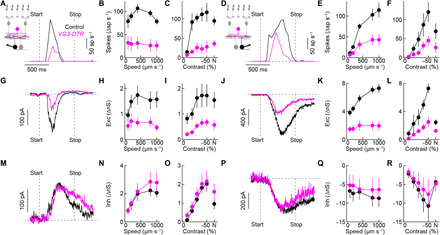
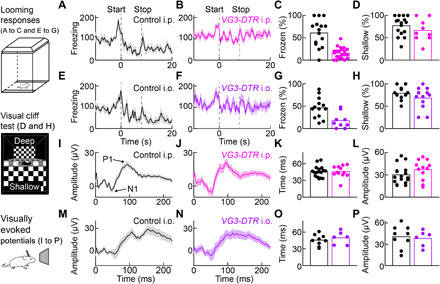
Approaching predators cast expanding shadows (i.e., looming) that elicit innate defensive responses in most animals. Where looming is first detected and how critical parameters of predatory approaches are extracted are unclear. In mice, we identify a retinal interneuron (the VG3 amacrine cell) that responds robustly to looming, but not to related forms of motion. Looming-sensitive calcium transients are restricted to a specific layer of the VG3 dendrite arbor, which provides glutamatergic input to two ganglion cells (W3 and OFFα). These projection neurons combine shared excitation with dissimilar inhibition to signal approach onset and speed, respectively. Removal of VG3 amacrine cells reduces the excitation of W3 and OFFα ganglion cells and diminishes defensive responses of mice to looming without affecting other visual behaviors. Thus, the dendrites of a retinal interneuron detect visual threats, divergent circuits downstream extract critical threat parameters, and these retinal computations initiate an innate survival behavior.


Figures

Fig. 1
Fig. 1. Behavioral and neuronal looming responses.
(A to C) Visual stimuli were shown to mice in a behavioral arena with virtual shelters (i.e., areas in which the monitor remained dark) on two sides. Freezing score responses of wild-type mice to looming (A; n = 14 mice), receding (B; n = 9 mice), and white looming (C; n = 8 mice). Lines (shaded areas) indicate mean (± SEM). LCD, liquid-crystal display. (D) Cumulative distributions of the time mice spent frozen from stimulus onset to 20 s later (stimulus duration: 8 s) for looming (L), receding (R), and white looming (WL). L versus R: P = 0.0033; L versus WL: P = 0.0028; R versus WL: P = 0.99; Kruskal-Wallis test. (E to G) Representative voltage traces of VG3-ACs (VG3-Cre Ai9 mice) during looming (E), receding (F), and white looming (G). Throughout this figure, the stimulus speed was 800 μm s−1. (H) Cumulative distributions of VG3 voltage responses to looming (L), receding (R), and white looming (WL). For all stimuli, n = 24 cells. L versus R: P = 9.7 × 10⁻¹⁰; L versus WL: P = 0.0015; R versus WL: P = 0.0015; Friedman’s test with Tukey-Kramer post hoc analysis. (I to K) Bottom traces show representative excitatory and inhibitory inputs to looming (I), receding (J), and white looming (K). Top traces (shaded areas) depict the mean (± SEM) responses starting 100 ms after the onset of motion. (L and M), Summary data comparing the time to peak (TTP) of excitation (L; n = 12 cells, P = 4.8 × 10⁻⁴, Wilcoxon signed-rank test) and the charge transferred during the window while excitation exceeds inhibition (M; n = 7 cells, P = 0.016, Wilcoxon signed-rank test).
Fig. 2
Fig. 2. Dendritic processing of visual stimuli in VG3 amacrine cells.
(A to C) Two-photon imaging of calcium transients in VG3 dendrites (VG3-Cre Ai148 mice) during looming (A), receding (B), and white looming (C). IR, infrared; PMT, photomultiplier tube. Green traces indicate the mean (shaded areas, almost indistinguishable from the green lines, indicate ± SEM) responses of dendritic regions of interest (ROIs) at different depths of the inner plexiform layer (IPL; 24%: n = 68 ROIs; 30%: n = 138 ROIs; 36%: n = 137 ROIs; 42%: n = 153 ROIs; 48%: 163 ROIs; 54%: n = 162 ROIs; 60%: n = 329 ROIs). (D) Average (± SEM) response amplitudes plotted as a function of IPL depth. Error bars indicating SEM are not visible because they are smaller than the circles. For IPL depths, 24 to 36% R and WL responses were not significantly different (P > 0.11); all other responses at all IPL depths were significantly different (P < 3.3 × 10⁻⁹, Friedman’s test with Tukey-Kramer post hoc analysis). (E and F) Summary data (means ± SEM) of preference indices for looming versus receding (E) and black versus white stimuli (F; expanding: filled circles; stationary: empty circles) across IPL depths. Error bars indicating SEM are not visible because they are smaller than the circles. For the preference index for looming versus receding (E), P = 1.3 × 10⁻²¹ for the main effect of IPL depth, Kruskal-Wallis test. By Tukey-Kramer post hoc analysis, pairwise comparisons showed statistically significant differences (P < 0.02) for 24 versus 54% and versus 60%, for 30 versus 48 to 60%, for 36 versus 48 to 60%, and for 42 versus 48 to 60%. For the preference index for looming versus white looming (F), P = 0 for the main effect of IPL depth, Kruskal-Wallis test. By Tukey-Kramer post hoc analysis, all pairwise comparisons revealed statistically significant differences (P < 0.02) except for 24 versus 30 to 42%, for 30 versus 36% and versus 42%, for 36 versus 42%, and for 54 versus 60%. For the preference index for black versus white stationary (F), P = 0 for the main effect of IPL depth, Kruskal-Wallis test. By Tukey-Kramer post hoc analysis, all pairwise comparisons revealed statistically significant differences (P < 0.02) except for 24 versus 30% and versus 36%, for 30 versus 36%, for 36 versus 42%, and for 54 versus 60%. At all depths, the preference index for black versus white looming was greater than that for stationary stimuli (P = 0 for a comparison across all depths and P < 10−9 for comparisons at each depth, Wilcoxon signed-rank test). In (F), the preference index for looming versus white looming for voltage responses (VM) is shown by a dashed line.
Fig. 3
Fig. 3. VG3 amacrine cells provide excitatory synaptic input to W3 and OFFα ganglion cells.
(A and B) Optogenetic stimulation of VG3 amacrine cells (VG3-Cre Ai32 mice) elicits postsynaptic currents in W3 (A; n = 7 cells) and OFFα (B; n = 5 cells) ganglion cells. Reversal near 0 mV identifies these as excitatory postsynaptic currents (EPSCs). (C and D) Overview projections (C) and single-plane excerpts (D) of a confocal image stack of an OFFα cell biolistically labeled with cyan fluorescent protein (CFP; C and D) and PSD95-YFP (D) in a retina, in which VG3 amacrine cells express tdTomato (VG3-Cre Ai9 mice). (E) Summary data of the fraction of PSD95-YFP puncta apposed by VG3 boutons in the obtained image stacks (observed) or the tdTomato channel was rotated by 90° (rotated, n = 6 cells; observed versus rotated: P = 0.03 by Wilcoxon signed-rank test). Exc, excitation; I, current; V, voltage.
Fig. 4
Fig. 4. Parallel parameter estimation in divergent circuits.
(A and B) Representative trace (A) and summary data (B) of VG3 amacrine cell voltage responses to looming with varying speeds of expansion. The speed for all representative traces in this figure is 400 μm s−1. VG3 amacrine cells responses varied slightly with speed (n = 8 cells; P = 0.038, Friedman’s test). (C to E) Representative traces (C) of excitatory and inhibitory inputs to VG3 amacrine cells and summary data of the amplitude (D) and latency (E; time to peak) of excitatory (n = 11 cells) and inhibitory (n = 12 cells) conductances at varying speeds of expansion. Excitation and inhibition increased in amplitude (excitation: P = 9.3 × 10⁻⁷; inhibition: P = 5 × 10⁻⁹; Friedman’s test) and decreased in latency (excitation: P = 1.3 × 10⁻⁸; inhibition: P = 2.8 × 10⁻⁹; Friedman’s test) with increasing stimulus speeds. Across speeds, inhibition was slower than excitation (P = 1.5 × 10⁻⁵, bootstrapping). (F and G) Representative trace (F) and summary data (G) for W3 spike responses, which did not vary significantly as a function of stimulus speed (n = 5 cells; P = 0.31, Friedman’s test). (H to J) Representative traces (H) of excitatory and inhibitory inputs to W3 ganglion cells and summary data of the amplitude (I) and latency (J) of excitatory and inhibitory conductances at varying speeds of expansion (n = 5 cells). Inhibition, but not excitation, increased significantly in amplitude (excitation: P = 0.14; inhibition: P = 0.032; Friedman’s test), and both decreased in latency (excitation: P = 5 × 10⁻⁴; inhibition: P = 5 × 10⁻⁴; Friedman’s test) with increasing stimulus speed. Across speeds, inhibition was slower than excitation (P = 0.01, bootstrapping). (K and L) Representative trace (K) and summary data (L) for OFFα spike responses, increasing with stimulus speed (n = 4 cells; P = 0.0086, Friedman’s test). (M to O) Representative traces (M) of excitatory and inhibitory inputs to OFFα ganglion cells and summary data of the amplitude (N) and latency (O) of excitatory and inhibitory conductances. Excitation increased and inhibition decreased in amplitude with increasing stimulus speed (excitation: n = 4 cells, P = 0.0016; inhibition: n = 5 cells, P = 0.0037; Friedman’s test). The latency of excitation was not significantly different from that of inhibition (P = 0.45, bootstrapping), and both decreased with stimulus speed (excitation: P = 0.003; inhibition: P = 5 × 10⁻⁴; Friedman’s test). Inset schematics in (E), (J), and (O) illustrate excitatory and inhibitory spatial receptive fields mapped with stationary dark spots (fig. S3). TTT, time to trough; TTP, time to peak; Exc, excitation; Inh, inhibition.
Fig. 5
Fig. 5. VG3 removal reduces the density of excitatory synapses on W3 and OFFα ganglion cells.
(A and B) Overview projections and excerpts (insets) of W3 dendrites biolistically labeled with CFP and PSD95-YFP in VG3-DTR mice (B) and littermate controls (A). (C and D) Summary data show that W3 dendrite length was unchanged (C; control: n = 8 cells; VG3-DTR: n = 5 cells, P = 0.35, Mann-Whitney U test), but excitatory synapse density was reduced (D; P = 0.0016, by Wilcoxon rank-sum test) by VG3 amacrine cell removal. (E and F) Overview projections and excerpts of OFFα dendrites biolistically labeled as in (A). (G and H) Summary data indicate that OFFα dendrite length was unchanged (G; control: n = 6 cells; VG3-DTR: n = 6 cells, P = 0.24, Mann-Whitney U test), but excitatory synapse density was reduced (H; P = 0.0022, Mann-Whitney U test) by VG3 amacrine cell removal.
Fig. 6
Fig. 6. Looming responses of W3 and OFFα ganglion cells depend on VG3 amacrine cells.
(A to F) Representative traces and summary data of W3 (A to C) and OFFα (D to F) ganglion cell spike responses to looming. The speed for all representative traces in this figure is 800 μm s−1. Across stimulus speeds and contrasts (including luminance-neutral approach motion; N), spike responses of W3 (control: n = 6 cells; VG3-DTR: n = 6 cells; speed: P = 4 × 10⁻⁵; contrast: P = 0.0017, bootstrapping) and OFFα (control: n = 4 to 5 cells; VG3-DTR: n = 6 to 8 cells; speed: P = 0.048; contrast: P = 0.047, bootstrapping) ganglion cells were attenuated by VG3 amacrine cell removal. (G to L) Synaptic excitation was reduced by VG3 amacrine cell removal in W3 (G to I; control: n = 5 cells; VG3-DTR: n = 7 to 8 cells; speed: P = 0.0024; contrast: P = 0.0021, bootstrapping) and OFFα (J to L; control: n = 4 cells; VG3-DTR: n = 4 cells; speed: P = 3 × 10⁻⁵; contrast: P = 0.0013, bootstrapping) ganglion cells. (M to R) Looming-evoked synaptic inhibition was unaffected by VG3 amacrine cell removal in W3 (M to O; control: n = 5 cells; VG3-DTR: n = 6 to 7 cells; speed: P = 0.77; contrast: P = 0.82, bootstrapping) and OFFα (P to R; control: n = 5 cells; VG3-DTR: n = 4 cells; speed: P = 0.91; contrast: P = 0.83, bootstrapping) ganglion cells. The control data for different looming speeds in this figure are the same as those in Fig. 4. Exc, excitation; Inh, inhibition.
Fig. 7
Fig. 7. Innate defensive responses to looming selectively depend on VG3 amacrine cells.
(A and B) Lines (shaded areas) indicate the mean (±SEM) freezing score traces in response to looming for VG3-DTR mice (B; n = 22 mice) and control littermates (A; n = 15 mice) injected intraperitoneally with DT. (C) Summary data comparing the fraction of time frozen between these groups of mice (VG3-DTR intraperitoneal and Ctrl intraperitoneal) from stimulus onset to 20 s later (stimulus duration: 8 s). P = 3.5 × 10⁻⁵, Mann-Whitney U test. (D) Summary data of the performance of VG3-DTR intraperitoneal (n = 9 mice) and Ctrl intraperitoneal mice (n = 15 mice) in a visual cliff test. For each mouse, the percentage of shallow-side choices in 10 trials was measured. P = 0.34, Mann-Whitney U test. (E to H) Analogous to (A to D), comparing VG3-DTR mice and control littermates injected intraocular with DT. For looming responses (E to G), VG3-DTR intraocular: n = 9 mice; Ctrl intraocular: n = 13 mice, P = 0.0066, Mann-Whitney U test. For the visual cliff test (H), VG3-DTR intraocular: n = 12 mice; Ctrl intraocular: n = 11 mice, P = 0.35, Mann-Whitney U test. (I and J) Lines (shaded areas) indicate the mean (±SEM) of visually evoked potentials recorded on skull electrodes above primary visual cortex in control (I; n = 17 mice) and VG3-DTR mice (J; n = 12 mice) 2 weeks after intraperitoneal injection of DT. (K and L) Summary data comparing implicit times (i.e., time to N1, P = 0.89, Mann-Whitney U test) and response amplitudes (i.e., P1-N1, P = 0.16, Mann-Whitney U test). (M to P) Analogous to (I) to (L) for control (n = 9 mice) and VG3-DTR mice (n = 6 mice) injected 2 weeks after bilateral intraocular injections of DT (implicit time: P = 0.52; amplitude: P = 0.78, Mann-Whitney U test). i.p., intraperitoneal; i.o., intraocular.

References

    1. Fotowat H., Gabbiani F., Collision detection as a model for sensory-motor integration. Annu. Rev. Neurosci. 34, 1–19 (2011). - PubMed
    1. Peek M. Y., Card G. M., Comparative approaches to escape. Curr. Opin. Neurobiol. 41, 167–173 (2016). - PubMed
    1. Yilmaz M., Meister M., Rapid innate defensive responses of mice to looming visual stimuli. Curr. Biol. 23, 2011–2015 (2013). - PMC - PubMed
    1. De Franceschi G., Vivattanasarn T., Saleem A. B., Solomon S. G., Vision guides selection of freeze or flight defense strategies in mice. Curr. Biol. 26, 2150–2154 (2016). - PubMed
    1. Shang C., Liu Z., Chen Z., Shi Y., Wang Q., Liu S., Li D., Cao P., A parvalbumin-positive excitatory visual pathway to trigger fear responses in mice. Science 348, 1472–1477 (2015). - PubMed

Publication types

LinkOut - more resources