

Evaluation of Serological SARS-CoV-2 Lateral Flow Assays for Rapid Point-of-Care Testing
- PMID: 33208477
- PMCID: PMC8111122
- DOI: 10.1128/JCM.02020-20
Evaluation of Serological SARS-CoV-2 Lateral Flow Assays for Rapid Point-of-Care Testing
Abstract
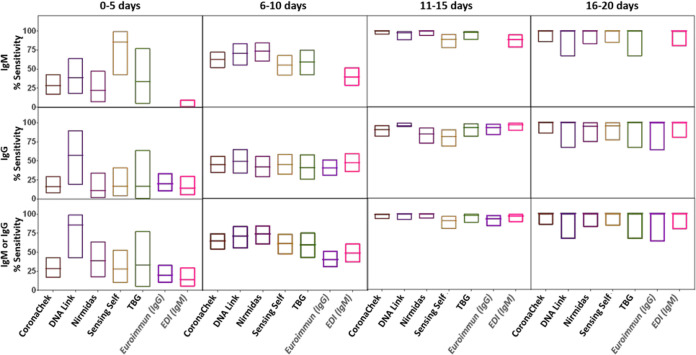
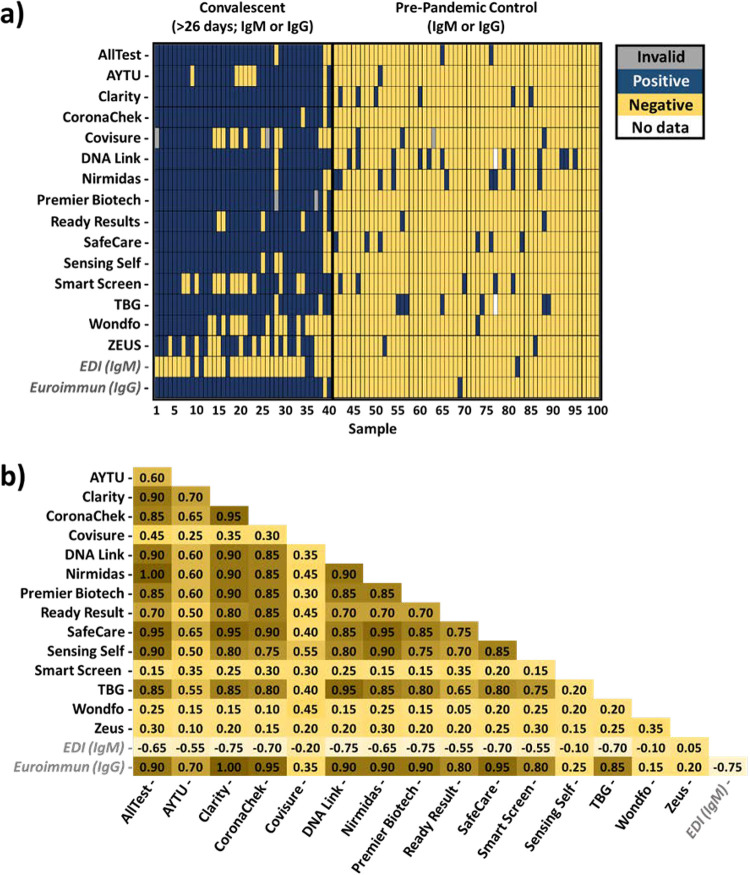
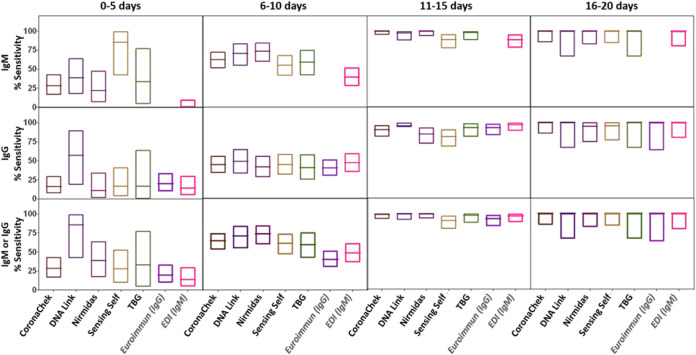
Rapid point-of-care tests (POCTs) for detection of severe acute respiratory syndrome coronavirus 2 (SARS-CoV-2)-specific antibodies vary in performance. A critical need exists to perform head-to-head comparisons of these assays. The performances of 15 different lateral flow POCTs for the detection of SARS-CoV-2-specific antibodies were compared on a well-characterized set of 100 samples. Of these, 40 samples from known SARS-CoV-2-infected, convalescent individuals (collected an average of 45 days after symptom onset) were used to assess sensitivity. Sixty samples from the prepandemic era (negative control) that were known to represent infections with other respiratory viruses (rhinoviruses A, B, and C and/or coronavirus 229E, HKU1, and NL63 OC43) were used to assess specificity. The timing of seroconversion was assessed using five lateral flow assays (LFAs) and a panel of 272 longitudinal samples from 47 patients for whom the time since symptom onset was known. Among the assays that were evaluated, the sensitivity and specificity for any reactive band ranged from 55% to 97% and from 78% to 100%, respectively. Assessing the performance of the IgM and the IgG bands alone, sensitivity and specificity ranged from 0% to 88% and 80% to 100% for IgM and from 25% to 95% and 90% to 100% for IgG, respectively. Longitudinal testing revealed that the median times after symptom onset to a positive result were 7 days (interquartile range [IQR], 5.4 to 9.8) for IgM and 8.2 days (IQR, 6.3 to 11.3) for IgG. The testing performances differed widely among LFAs, with greatest amount of variation related to the sensitivity of the assays. The IgM band was the band most likely to misclassify prepandemic samples. The appearances of IgM and IgG bands occurred almost simultaneously.
Keywords: SARS-CoV-2 serology; cross-reactivity; performance; point-of-care test.
Copyright © 2021 American Society for Microbiology.
Figures
Update of
-
Evaluation of Serological SARS-CoV-2 Lateral Flow Assays for Rapid Point of Care Testing.medRxiv [Preprint]. 2020 Aug 4:2020.07.31.20166041. doi: 10.1101/2020.07.31.20166041. medRxiv. 2020. Update in: J Clin Microbiol. 2021 Jan 21;59(2):e02020-20. doi: 10.1128/JCM.02020-20. PMID: 32793916 Free PMC article. Updated. Preprint.
References
-
- Zhu N, Zhang D, Wang W, Li X, Yang B, Song J, Zhao X, Huang B, Shi W, Lu R, Niu P, Zhan F, Ma X, Wang D, Xu W, Wu G, Gao GF, Tan W, China Novel Coronavirus Investigating and Research Team. 2020. A novel coronavirus from patients with pneumonia in China, 2019. N Engl J Med 382:727–733. doi: 10.1056/NEJMoa2001017. - DOI - PMC - PubMed
-
- Gronvall G, Connel N, Kobokovich A, West R, Warmbrod K, Shearer M, Mullen L, Inglesby T. 2020. Developing a national strategy for serology (antibody testing) in the United States. Johns Hopkins Bloomberg School of Public Health, Baltimore, MD.
-
- Clarke W, Sokoll LJ, Rai AJ. 2020. Immunoassays, p 201–214. In Clarke W, Marzinke MA (ed), Contemporary practice in clinical chemistry, 4th ed. Academic Press, New York, NY.
-
- Joseph A, Branswell H. 24 April 2020. The results of coronavirus ‘serosurveys’ are starting to be released. Here’s how to kick their tires. Stat. https://www.statnews.com/2020/04/24/the-results-of-coronavirus-serosurve....
Publication types
MeSH terms
Substances
Grants and funding
LinkOut - more resources
Full Text Sources
Other Literature Sources
Medical
Miscellaneous
