. 2020 Nov 18;12(570):eaaz5327.
doi: 10.1126/scitranslmed.aaz5327.

Persistently activated, proliferative memory autoreactive B cells promote inflammation in rheumatoid arthritis

Affiliations

Persistently activated, proliferative memory autoreactive B cells promote inflammation in rheumatoid arthritis

Hendy Kristyanto et al. Sci Transl Med. .

Abstract

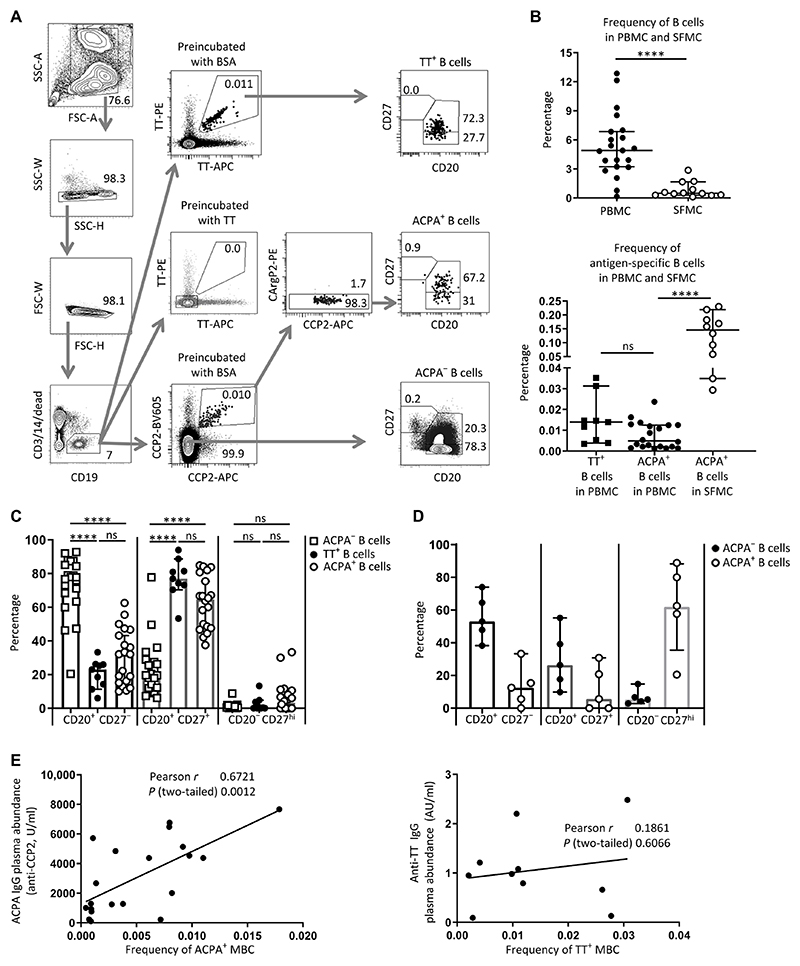
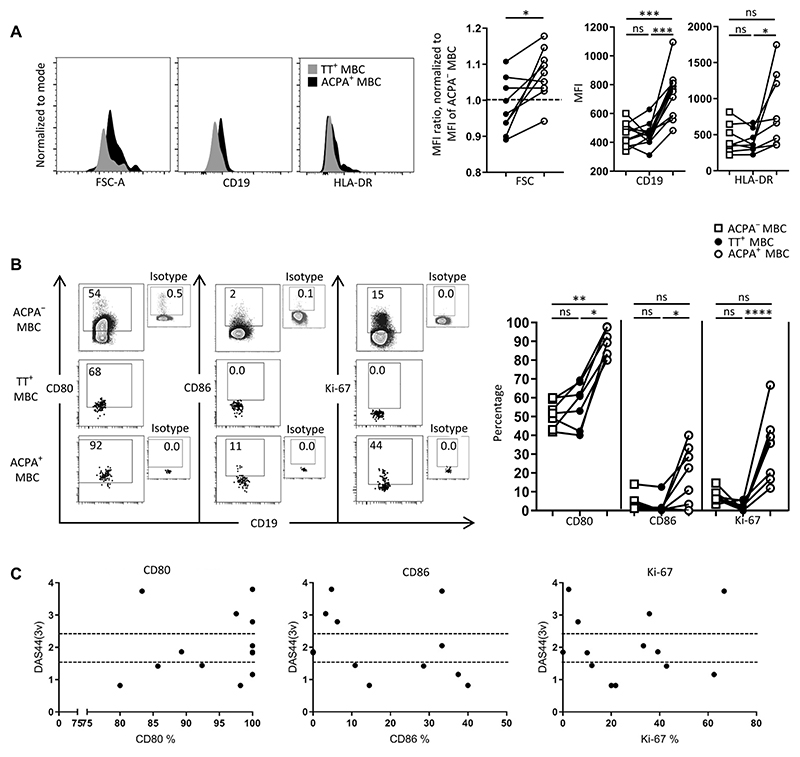
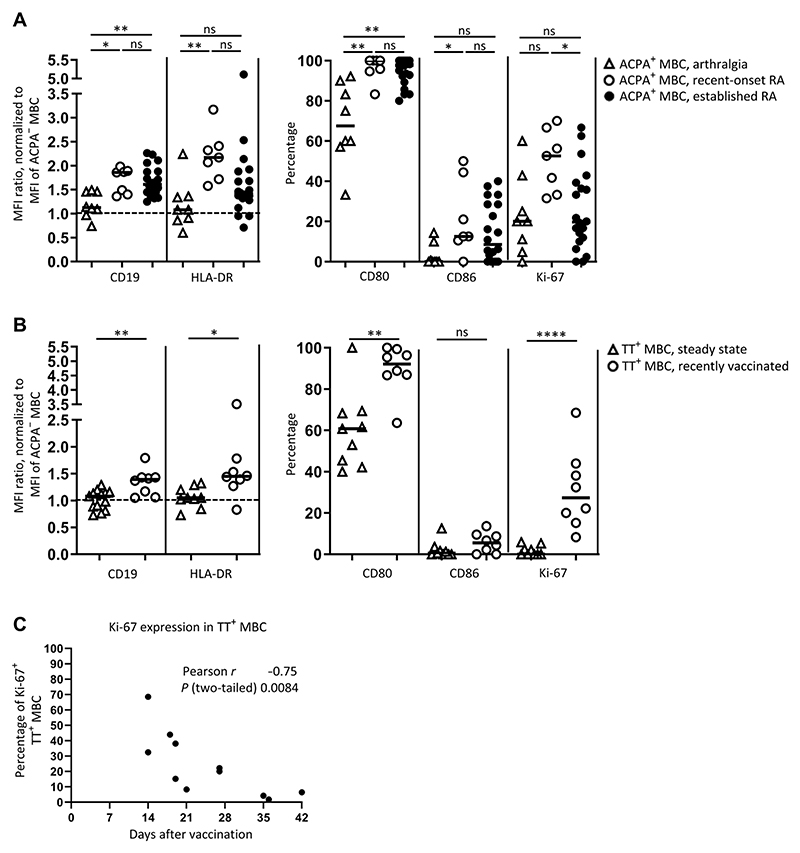
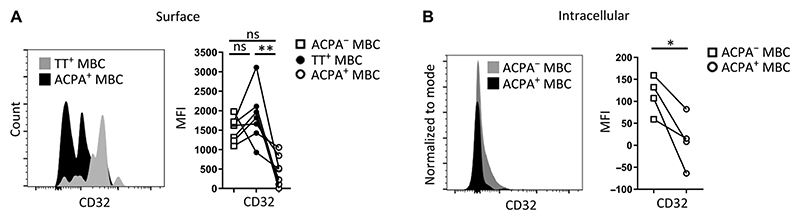
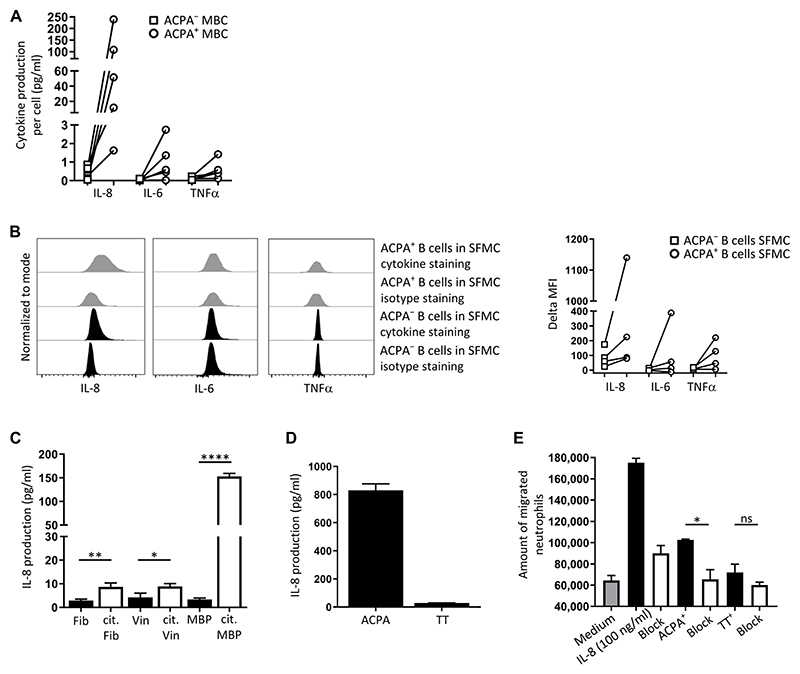
Autoreactive B cells mediate autoimmune pathology, but exactly how remains unknown. A hallmark of rheumatoid arthritis (RA), a common autoimmune disease, is the presence of disease-specific anticitrullinated protein antibodies (ACPAs). Here, we showed that ACPA-positive B cells in patients with RA strongly expressed T cell-stimulating ligands, produced abundant proinflammatory cytokines, and were proliferative while escaping inhibitory signals. This activated state was found at different degrees in different stages of disease: highest in patients with recent-onset RA, moderate in patients with established RA, and far less pronounced in ACPA-positive individuals "at risk" for developing disease. The activated autoreactive B cell response persisted in patients who achieved clinical remission with conventional treatment. ACPA-positive B cells in blood and synovial fluid secreted increased amounts of the chemoattractant interleukin-8, which attracted neutrophils, the most abundant immune cell in arthritic joints. Tetanus toxoid-specific B cells from the same patients exhibited properties of memory B cells without the activation and proliferation phenotype, but these cells transiently acquired a similar proliferative phenotype upon booster vaccination. Together, these data indicated that continuous antigenic triggering of autoreactive B cells occurs in human autoimmune disease and support the emerging concept of immunological activity that persists under treatment even in clinical remission, which may revise our current concept of treatment targets for future therapeutic interventions. In addition, our data pointed to a pathogenic role of ACPA-positive B cells in the inflammatory disease process underlying RA and favor approaches that aim at their antigen-specific inactivation or depletion.


Conflict of interest statement

Competing interests: D.L.B. is currently an employee of UCB Pharma. H.S. is shareholder of AIMM Therapeutics, has received consulting fees from GSK and UniQure, and holds a patent on the immortalization of B cells (patent title: Means and methods for influencing the stability of antibody producing cells; patent no. US10273454B2). The other authors declare that they have no competing interests.

Figures

Fig. 1
Fig. 1. Identification and subset characterization of ACPA-positive and tetanus toxoid–specific B cells in RA.
(A) Gating strategy. Peripheral blood mononuclear cells (PBMCs) from single donors (patients with RA, n = 21) were divided into three fractions and stained with either CCP2 and CArgP2 streptavidin tetramers to identify ACPA+ B cells or with directly labeled tetanus toxoid (TT) to identify TT+ B cells. Preincubation with unlabeled TT or bovine serum albumin (BSA) was used to demonstrate specificity of the TT staining. Subsets of B cells were delineated by the presence of CD20 and CD27. SSC, side scatter; FSC, forward scatter. (B) Top: Frequency of CD19+ B cells in PBMC and synovial fluid mononuclear cells (SFMCs). Bottom: Frequency of TT+ B cells and ACPA+ B cells in PBMCs versus ACPA+ B cells in SFMCs. (C) Subset distribution of ACPA-negative (ACPA), TT+, and ACPA+ B cells in PBMCs based on CD20 and CD27 abundance (n = 21). ns, not significant. (D) Subset distribution of ACPA+ and ACPA B cells in SFMCs (n = 5). (E) Correlation between the frequency of ACPA+ memory B cells (MBCs) (defined as CD20+CD27+) in PBMC and plasma ACPA IgG concentrations (left, n = 20) and correlation between the frequency of TT+CD20+CD27+ B cells and plasma anti-TT IgG antibodies (right, n = 10). The correlation between ACPA+ MBCs and plasma ACPA IgG remains upon removal of the data point with the highest ACPA plasma concentration (r = 0.57; P = 0.01). In (B) to (E), each dot represents one patient sample. ****P ≤ 0.0001. Two-tailed Mann-Whitney test in upper panel of (B), one-way ANOVA with Dunn’s multiple comparison test in lower panel of (B) and in (C) and (D); Pearson correlation in (E). All data represent median ± 95% confidence interval; n = number of donors. AU, arbitrary units.
Fig. 2
Fig. 2. Phenotypic characteristics of memory (CD20+CD27+) ACPA, TT+, and ACPA+ B cells in RA patient–derived PBMCs.
(A and B) Forward scatter and proportion of MBCs positive for activation markers (CD19, HLA-DR, CD80, CD86, and Ki-67) in the respective cell populations in PBMCs of individual donors in which both ACPA-positive (ACPA+) and TT-specific (TT+) B cells were assessed in parallel (n = 19). Median fluorescence intensity (MFI) was analyzed for markers present in the entire cell population (FSC, CD19, and HLA-DR). Subsets of cells were positive for CD80, CD86, and Ki-67. These data are depicted as percentage positive cells within the respective cell population (CD80, CD86, HLA-DR, and Ki-67 were assessed in n = 8 of 19 donors). FSC data were compiled from samples that had not undergone permeabilization to avoid influencing cell size (n = 9 of 19). Connected dots depict data from individual patients. (C) Correlation between clinical disease activity parameters and the characteristics of ACPA+ B cells [n = 20; see fig. S4 for data on erythrocyte sedimentation rate (ESR)]. Data are presented as percentage of ACPA+ MBCs positive for the respective marker in relation to the disease activity score (DAS). The DAS was calculated on the basis of three variables {3v: ESR and an evaluation of 44 joints for signs of pain (tender joint count) and swelling (swollen joint count) [DAS44(3v)]}. The dashed lines represent the category of disease activity, with a score >2.4 being high disease activity, >1.6 and <2.4 being moderate disease activity, and <1.6 low disease activity or remission. *P ≤ 0.05, **P ≤ 0.01, ***P ≤ 0.001, and ****P ≤ 0.0001. Two-tailed Wilcoxon signed-rank test in (A) for the FSC graph, one-way ANOVA with Dunn’s multiple comparisons test in (A) for the CD19 and HLA-DR graphs and (B). n = number of donors.
Fig. 3
Fig. 3. Comparison of the characteristics of ACPA-positive MBCs in different phases of disease.
ACPA-positive MBCs were analyzed from patients with arthralgia (n = 8), recent-onset, untreated RA (n = 7), and established, treated RA (n = 20) and compared to TT-specific B cells in the steady state (assessed in n = 13 patients with established, treated RA) and in recently vaccinated patients with RA (n = 11). (A) The abundance and percentage of cells positive for CD19, HLA-DR, CD80, CD86, or Ki-67 within the ACPA+ MBCs from the indicated RA disease stages. (B) The abundance and percentage of cells positive for CD19, HLA-DR, CD80, CD86, or Ki-67 within the TT-specific (TT+) MBCs from patients with RA in the steady state (n = 13) and in patients upon recent vaccination (assessed within 30 days after booster immunization, n = 8 of 11). (C) Correlation of percent of Ki-67-positive, TT-specific (TT+) MBCs with time after vaccination with TT in untreated patients with RA (includes three patients assessed >30 days after booster immunization, n = 11). Every dot represents an individual patient; lines represent median values. *P ≤ 0.05, **P ≤ 0.01, and ****P ≤ 0.0001. One-way ANOVA with Dunn’s multiple comparisons test in (A); two-tailed Mann-Whitney test in (B); Pearson correlation in (C). n = number of donors.
Fig. 4
Fig. 4. Presence of the inhibitory receptor CD32 on ACPA+ MBCs and TT-specific MBCs from patients with established RA.
(A) Abundance of CD32 on the surface of ACPA+ or TT-specific MBCs (n = 7). (B) Abundance of intracellular CD32 in ACPA+ or ACPA MBCs (n = 4). Connected dots depict data from individual patient samples. *P ≤ 0.05, **P ≤ 0.01. One-way ANOVA with Dunn’s multiple comparisons test in (A), two-tailed Wilcoxon signed-rank test in (B). n = number of donors.
Fig. 5
Fig. 5. Functional properties of ACPA+B cells.
(A) Cumulative secretion of IL-8, IL-6, or TNFα by PBMC-derived ACPA+ or ACPA MBCs upon BCR and CD40 stimulation for 7 days (n = 5) (see fig. S8 for additional cytokine measurements). Equal numbers of ACPA+ and ACPA B cells were cultured per donor. Results are shown as cytokine secretion per sorted cell. (B) Production of IL-8, IL-6, or TNFα by ACPA+ B cells from RA synovial fluid in the absence of ex vivo stimulation (n = 4). SFMCs were cultured overnight in medium in the presence of brefeldin A (2 μg/ml) to block release of the cytokines into the medium. Representative flow cytometry data (left) and collated results (right) are shown. To compare production, the difference between median fluorescence intensities of isotype staining and those of cytokine staining for the ACPA and ACPA+ B cells was plotted. (C) IL-8 secretion by an immortalized ACPA+ B cell clone upon stimulation with the indicated citrullinated proteins and irradiated CD40L-positive cells. Immortalized ACPA B cells were cultured with citrullinated (cit) fibrinogen (Fib), vinculin (Vin), or myelin basic protein (MBP) (white bars) or their mock-citrullinated counterparts (black bars) in the presence of irradiated CD40L-positive cells for 3 days (one of three representative experiments is shown; n = 3). Supernatants were collected and tested for the presence of IL-8 by ELISA. (D) IL-8 secretion by the ACPA+ B cell clone and a TT-specific B cell clone upon stimulation with CCP2-avidin and soluble CD40L oligomers (n = 3, N = 3). Results from one representative experiment are shown. (E) Neutrophil migration induced by supernatants from CCP2-stimulated ACPA+ B cells. Healthy donor neutrophils were incubated for 90 min with supernatants from ACPA+ B cells stimulated with CCP2 tetramer for 3 days (n = 3, N = 3). Results from one representative experiment are shown. *P ≤ 0.05, **P ≤ 0.01, and ****P ≤ 0.0001. Two-tailed, unpaired Student’s t test in (C); two-tailed paired t test in (E). In (A) and (B), n = number of donors. In (C) to (E), data represent means ± SD from one representative experiment of three experiments (N = 3) with three technical replicates (n = 3).

References

    1. Scherer HU, Huizinga TWJ, Krönke G, Schett G, Toes REM. The B cell response to citrullinated antigens in the development of rheumatoid arthritis. Nat Rev Rheumatol. 2018;14:157–169. - PubMed
    1. Willemze A, Trouw LA, Toes RE, Huizinga TW. The influence of ACPA status and characteristics on the course of RA. Nat Rev Rheumatol. 2012;8:144–152. - PubMed
    1. Burgers LE, van Steenbergen HW, Ten Brinck RM, Huizinga TW, van der Helm-van Mil AH. Differences in the symptomatic phase preceding ACPA-positive and ACPA-negative RA: A longitudinal study in arthralgia during progression to clinical arthritis. Ann Rheum Dis. 2017;76:1751–1754. - PubMed
    1. van der Woude D, Rantapää-Dahlqvist S, Ioan-Facsinay A, Onnekink C, Schwarte CM, Verpoort KN, Drijfhout JW, Huizinga TW, Toes RE, Pruijn GJ. Epitope spreading of the anti-citrullinated protein antibody response occurs before disease onset and is associated with the disease course of early arthritis. Ann Rheum Dis. 2010;69:1554–1561. - PubMed
    1. Suwannalai P, van de Stadt LA, Radner H, Steiner G, El-Gabalawy HS, Zijde CM, van Tol MJ, van Schaardenburg D, Huizinga TW, Toes RE, Trouw LA. Avidity maturation of anti-citrullinated protein antibodies in rheumatoid arthritis. Arthritis Rheum. 2012;64:1323–1328. - PubMed

Publication types