. 2020 Nov 18;12(570):eabb7028.
doi: 10.1126/scitranslmed.abb7028.

Long-term skin-resident memory T cells proliferate in situ and are involved in human graft-versus-host disease

Affiliations

Long-term skin-resident memory T cells proliferate in situ and are involved in human graft-versus-host disease

Johanna Strobl et al. Sci Transl Med. .

Abstract

The skin contains a population of tissue-resident memory T cells (Trm) that is thought to contribute to local tissue homeostasis and protection against environmental injuries. Although information about the regulation, survival program, and pathophysiological roles of Trm has been obtained from murine studies, little is known about the biology of human cutaneous Trm Here, we showed that host-derived CD69+ αβ memory T cell clones in the epidermis and dermis remain stable and functionally competent for at least 10 years in patients with allogeneic hematopoietic stem cell transplantation. Single-cell RNA sequencing revealed low expression of genes encoding tissue egress molecules by long-term persisting Trm in the skin, whereas tissue retention molecules and stem cell markers were displayed by Trm The transcription factor RUNX3 and the surface molecule galectin-3 were preferentially expressed by host T cells at the RNA and protein levels, suggesting two new markers for human skin Trm Furthermore, skin lesions from patients developing graft-versus-host disease (GVHD) showed a large number of cytokine-producing host-derived Trm, suggesting a contribution of these cells to the pathogenesis of GVHD. Together, our studies highlighted the relationship between the local human skin environment and long-term persisting Trm, which differs from murine skin. Our results also indicated that local tissue inflammation occurs through host-derived Trm after allogeneic hematopoietic stem cell transplantation.


Figures

Figure 1
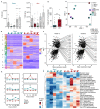
Figure 1. Distinct survival and transcriptional dynamics in T cells of peripheral blood and skin.
(A) T cell numbers in the course of allo-HSCT. Numbers of T cells (CD45+7AAD-CD3+) in peripheral blood and skin before and after allo-HSCT (n = 28) assessed by flow cytometry. B, baseline before radiochemotherapy; Tx, data of transplantation; 14, 100, 365, days after transplantation. (B) T cells surviving radiochemotherapy. Frequency of T cells in blood and skin samples taken on day of transplantation compared to frequency at baseline (n = 21). Data in A and B are shown as mean ± SEM. Each dot corresponds to one patient. Statistical difference to day of transplantation is indicated by asterisk: *, p<0.05; **, p<0.01; ***, p<0.001. Statistical analysis was performed by one-way ANOVA including Tukey’s pairwise comparison (A) and Student’s t-test (B). (C) t-SNE plot of the top 2000 highly upregulated genes (mean log2 expression) among all 11 patients and 5 time points from blood and skin (55 bulk T cell samples). (D) Different transcriptional program in T cells revealed by hierarchical clustering of all 1690 differentially expressed genes from blood versus skin at each time point. Differentially expressed genes were selected as those with an adjusted p < 0.01 and log2 fold change > 2. Coregulated genes grouped into 10 clusters. (E) Time-dependent differentiation score of clusters 2, 3, 5, 8, and 10. Data are shown as average expression of all genes in each cluster for all patients at each time point in blood (turquoise line) and skin (red line). (F) Scatter plots show log fold change (FC) versus log2 mean expression of genes from clusters 2 and 3. Labels indicate representative upregulated genes with FDR < 0.01 (black) or 0.05 (gray). (G) KEGG-pathway enrichment in blood and skin T cells of time-dependent, differentially expressed genes in cluster 2 and cluster 3 from blood versus skin. Data in panels C – G are from transcriptomic analysis of T cells isolated from the skin and blood of 11 patients at the indicated timepoints (100 CD3+ singlets per sample).
Figure 2
Figure 2. Gene expression-based markers identify radiochemotherapy-resistant T cells.
(A, B) RNA-based differentiation scores of marker genes for tissue-infiltrating (A) and tissue-resident (B) T cells. Data are shown as mean expression (log2) of genes of bulk T cells from blood and skin for each of 11 patients at 5 time points. One line represents one patient. (C) Relative numbers of CCR7 and CD62L-positive skin T cells as determined by immunostaining. The number of cells at baseline was set to 100%. Data are shown as mean ± SEM (n=28). (D) Representative immunostaining of CCR7 and CD62L, indicating tissue-patrolling skin T cells, at baseline. (E) Relative numbers of CD69 and CD103-positive skin T cells as determined by immunostaining. The number of cells at baseline was set to 100%. Data are shown as mean ± SEM (n=28). (F) Representative immunostaining of CD69 and CD103 at day of transplantation, indicating radiochemotherapy-resistant resident skin T cells. (G) Distribution of cells positive for Trm-surface markers on T cells of epidermis and dermis from immunostaining data. Data are shown as relative mean of all samples (n=28). (H) Distribution of CD4+ and CD8+ T cells within the epidermal and dermal CD69+ Trm population. Data are shown as mean ± SEM (n = 28). (I) CD4+ and CD8+ T cell distribution in skin and peripheral blood over time. Data are shown as mean relative of all samples (n=28). Statistical analysis was performed by one-way ANOVA and Tukey’s pairwise comparisons (C, E, I) and paired t-test (C, E, H). Statistically significant changes to baseline or control group are indicated by *, p<0.05; **, p<0.01; ***, p<0.001.
Figure 3
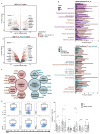
Figure 3. Unique survival program of Trm.
(A) Differentially expressed genes in skin T cells at baseline compared with those in skin T cells on the day of transplantation (upper) and on the day of transplantation compared with those on days 14 – 365 (lower). Volcano plots show differentially regulated genes in skin (n=11). (B) KEGG pathways enriched with upregulated and downregulated genes from the analysis in A. (C) Marker genes expressed by resident T cells (Tx) and tissue-infiltrating T cells (B, 14, 100, 365) as determined by transcriptome analysis in samples from A and B. (D) Cytokine production of resident T cells at Tx assessed by flow cytometry. (Left) Gating strategy and representative scatterplots of cytokine-positive skin T cells upon stimulation with phorbol ester and ionomycin from a patient on the day of transplantation. (Right) Frequencies of cytokine-positive T cells in the skin of patients on the day of transplantation (n=5) and healthy donors (n=9) as identified by intracellular cytokine staining. Data are shown as mean ± SEM. Statistical analysis was performed by one-way ANOVA and Tukey’s pairwise comparisons, * p < 0.05, n.s, not significant. B, baseline before radiochemotherapy; Tx, day of transplantation after radiochemotherapy
Figure 4
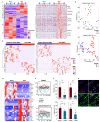
Figure 4. Donor and host Trm are transcriptionally distinct.
(A) Time-dependent transcriptional program in T cells shown by hierarchical clustering of differentially expressed genes from single blood T cells versus single skin T cells at baseline, day of transplantation, and 14 days after transplantation from 2 patients. Differentially expressed genes were selected at an adjusted p value < 0.01 and log2 fold change >2. Genes clustered according to co-regulation into 10 clusters (left). Enlarged view of the genes in cluster 2 with each column representing one cell (right). (B) Representative t-SNE plot of patients A and B of skin T cells at day 14. One dot represents one cell. (C) Allele frequency heatmap of host and donor specific SNPs in 22 T cells of donor A at day 14 (left, cluster 1 with 28 donor and cluster 2 with 18 host specific SNPs) and 44 T cells of donor B (right, cluster 1 with 69 donor and cluster 2 with 93 host specific SNPs). (D) Heatmap of selected 30 significantly differentially expressed protein-coding genes (p-value < 0.01 and log2 fold change >1) from donor versus host T cells comparison using the RNA sequencing data from donor and host T cells defined by the phenograph and SNP analysis. (E) RNA differentiation score of RUNX3 (upper) and LGALS3 (lower) over time. Data are shown as mean expression of bulk T cells from blood and skin in 11 patients at 5 time points. One line represents one patient. (F) Quantification of proportion of RUNX3-positive T cells (upper) and galectin-3-positive T cells (lower) by immunostaining skin tissue at the time of transplant (Tx) and on post-transplant day (14). Data are shown as mean percentage of RUNX3-positive or Gal-3-positive CD3+CD69+ and CD3+CD69- cells (n = 6). Error bars indicate the SEM. Statistical analysis was performed by paired t-test. *, p<0.05; **, p<0.01; ***, p<0.001; n.s., not significant. (G) Representative immunostaining of RUNX3, CD3, and CD69 in skin on the day of transplantation.
Figure 5
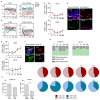
Figure 5. The TCR repertoire of skin T cells is partially conserved during allo-HSCT.
(A, C) Relative numbers of αβTCR+ (A) and γδTCR+ cells (B) among T cells in the course of allo-HSCT. Data are presented as mean ± SEM (n = 4). Statistical analysis was performed by one-way ANOVA and Turkey’s multiple comparisons (*, p < 0.05). (C) Representative immunostaining of αβTCR, CD3, and CD69 at the day of transplantation. (D) Productive T cell clonality of blood and skin calculated from TCRB sequences across all time points. Data are shown as mean ± SEM (n = 9). Statistical analysis was performed by unpaired student’s T-test (*, p < 0.05). (E) Numbers and frequencies of shared TCRB clones in blood and skin before (at baseline and the day of transplantation) and after allo-HSCT (14, 100, and 365 days) in two patients. (F) Productive frequency of top 10 clones at each time point for blood and skin T cells of patient 1 from panel E. (G) Productive frequency of skin-resident T cell clones (determined by presence at baseline and ≥1 time point after transplantation in patient 1 from E). (H) Example phenograph of single cell TCR clone tracking. Data points were manually colored to reflect clone origin. (I) Identical clone sequences in single cells from patients A and B at pre- (baseline and day of transplantation) and post-transplantation (day 14) time points. All clones were identified using TRUST tool.
Figure 6
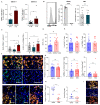
Figure 6. Long-term Trm are maintained for a decade after allo-HSCT.
(A) Representative image of FISH-labeled X (green) and Y (red) chromosomes, CD3 immunostaining (yellow) and DAPI counterstain in a patient 8 years after allo-HSCT. (B) Percentage of host T cells among peripheral blood (left) and skin T cells (right) after HSCT (weeks 2 – 4, n = 10; weeks 14 – 52, n = 11; years 2 – 5, n = 10; years 6 – 10, n = 13). Data shown as mean ± SEM. (C) Percentage of host T cells in skin from patients described in B who had a history of viral skin infection (herpes simplex virus, HSV or varicella zoster virus – VZV) between allo-HSCT and sampling time point (n = 5) and patients without viral skin infection after allo-HSCT (n = 11). Data shown as mean ± SEM, statistical analysis performed with unpaired student’s T-test (*, p < 0.05). (D) Proportion of donor and host skin T cells positive for the indicated tissue-residency markers at the indicated times before and after transplantation. Data are shown as mean of 5 patients. (E) Representative immunostaining (CD3, yellow) and FISH of the X and Y chromosomes (green and red, respectively) of dermal T cell infiltrate in acute GVHD patient 1 (aGVHD1). Red and green markings of the lower picture delineate automated imaging analysis by TissueFAXS software with red indicating T cells also positive for CD69 and green indicating CD3 single positive cells. (F) Percentage of host cells among T cells in acute (aGVHD patients 1 – 5, n = 5) and chronic GVHD (cGVHD patients 1 – 5, n = 5). Data are shown as mean of 2 experiments, >150 T cells/experiment. Error bars indicate the SEM. (G) Representative image of spatial relationship of host (XY, orange arrows) and donor (XX, white arrows) T cells in the papillary dermis and lower epidermis in inflamed skin that was previously stained for CD3. Image data were merged using StrataQuest software. All T cells (CD3+) are marked with arrows; unmarked cells are other cell types.
Figure 7
Figure 7. Proliferating Trm of host origin contribute to GVHD skin inflammation.
(A) Relative frequencies of CD69+ T cells at Tx compared to baseline CD69+ T cells in patients of cohort 1(left, n=14) and validation cohort 2(right, n=26). (B) Representative histogram and relative frequencies of proliferated (CSFElo) T cells upon TCR stimulation. Cells isolated from peripheral blood of healthy controls (n=5), peripheral blood of patients at Tx (n=5), skin of healthy controls (n=7) and skin of patients at Tx (n=4). (C) Ki-67+CD69+ T cells/mm skin (left panel) and relative frequencies (right panel) as determined by immunostaining at baseline (B, n=10), Tx (n=6) and in acute GVHD lesions (n=13). (D) Frequencies of Ki-67-expressing cells among CD3+ T cells and CD3+CD69+ T cells (n=13). (E) Percentage of donor vs. host-derived cells among proliferating (Ki-67+) T cells (left panel) and among CD69+ T cells (right panel) in GVHD as identified by X/Y-FISH and immunostaining. (F) Representative immunostaining of CD3 and lytic granules (perforin, granzyme B, top panels) and CD3 and cytokines (IFN-g, bottom panels) in a GVHD lesion. (G) Perforin, granzyme B and IFN-g positivity among donor and host T cells as detected by immunofluorescence and X/Y-FISH. (H) Donor/host chimerism of FoxP3+ T cells (left panel) and ratio of Tconv (FoxP3-) over Treg (FoxP3+) (right panel) among donor and host T cells in GVHD lesions (I) Representative immunostaining of CD3 and transcription factor FoxP3 in a GVHD lesion. All data shown as mean, error bars indicate the SEM. Each data point represents the mean of 2 independent measurements of one patient. Statistical analysis was performed by unpaired student’s t-test (A, B, D, E, G, H), one-way ANOVA and Turkey’s multiple comparisons (C), *, p<0.05; **, p<0.01; ***, p<0.001.

Similar articles

Cited by

References

    1. Teijaro JR, et al. Cutting edge: Tissue-retentive lung memory CD4 T cells mediate optimal protection to respiratory virus infection. J Immunol. 2011;187:5510–5514. doi: 10.4049/jimmunol.1102243. - DOI - PMC - PubMed
    1. Glennie ND, et al. Skin-resident memory CD4+ T cells enhance protection against Leishmania major infection. J Exp Med. 2015;212:1405–1414. doi: 10.1084/jem.20142101. - DOI - PMC - PubMed
    1. Stary G, et al. VACCINES. A mucosal vaccine against Chlamydia trachomatis generates two waves of protective memory T cells. Science. 2015;348:aaa8205. doi: 10.1126/science.aaa8205. - DOI - PMC - PubMed
    1. Jiang X, et al. Skin infection generates non-migratory memory CD8+ T(RM) cells providing global skin immunity. Nature. 2012;483:227–231. doi: 10.1038/nature10851. - DOI - PMC - PubMed
    1. Steinert EM, et al. Quantifying Memory CD8 T Cells Reveals Regionalization of Immunosurveillance. Cell. 2015;161:737–749. doi: 10.1016/j.cell.2015.03.031. - DOI - PMC - PubMed

Publication types