. 2020 Dec 1;117(48):30710-30721.
doi: 10.1073/pnas.2000942117. Epub 2020 Nov 18.

mGreenLantern: a bright monomeric fluorescent protein with rapid expression and cell filling properties for neuronal imaging

Affiliations

mGreenLantern: a bright monomeric fluorescent protein with rapid expression and cell filling properties for neuronal imaging

Benjamin C Campbell et al. Proc Natl Acad Sci U S A. .

Abstract

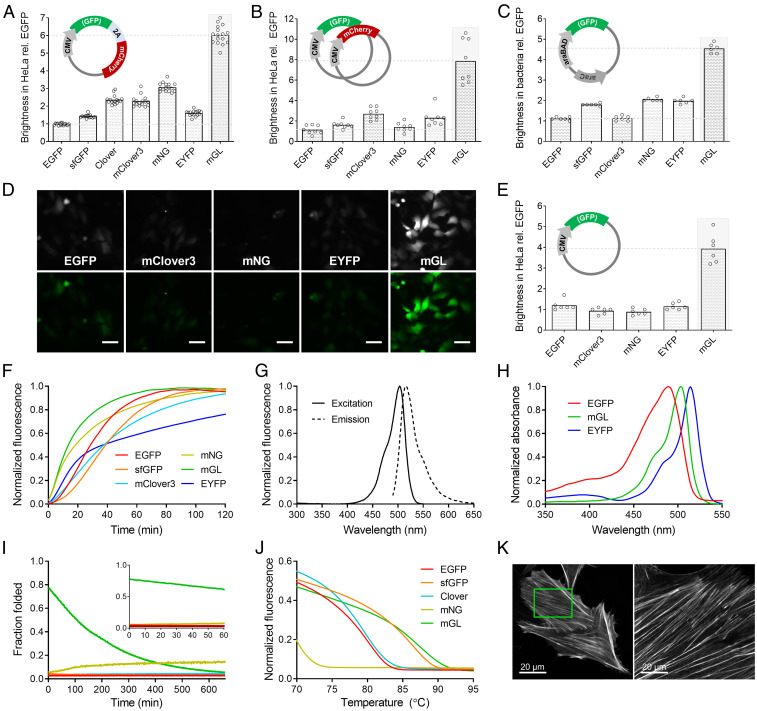
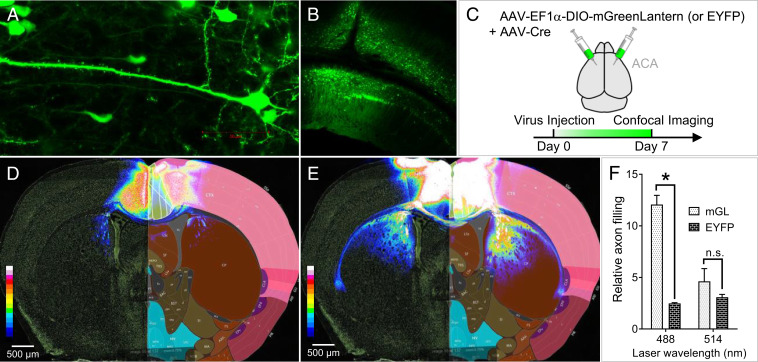
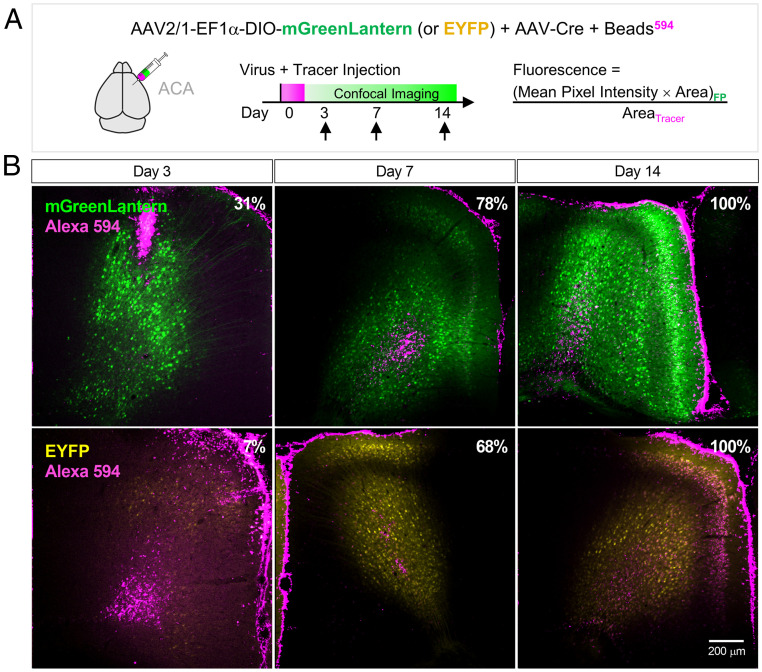
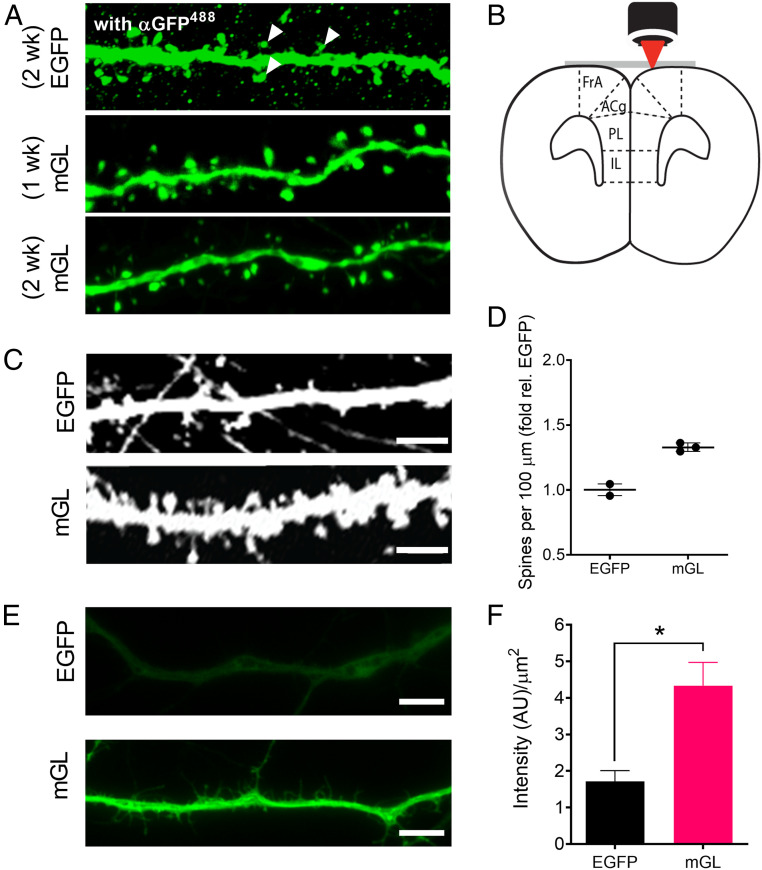
Although ubiquitous in biological studies, the enhanced green and yellow fluorescent proteins (EGFP and EYFP) were not specifically optimized for neuroscience, and their underwhelming brightness and slow expression in brain tissue limits the fidelity of dendritic spine analysis and other indispensable techniques for studying neurodevelopment and plasticity. We hypothesized that EGFP's low solubility in mammalian systems must limit the total fluorescence output of whole cells, and that improving folding efficiency could therefore translate into greater brightness of expressing neurons. By introducing rationally selected combinations of folding-enhancing mutations into GFP templates and screening for brightness and expression rate in human cells, we developed mGreenLantern, a fluorescent protein having up to sixfold greater brightness in cells than EGFP. mGreenLantern illuminates neurons in the mouse brain within 72 h, dramatically reducing lag time between viral transduction and imaging, while its high brightness improves detection of neuronal morphology using widefield, confocal, and two-photon microscopy. When virally expressed to projection neurons in vivo, mGreenLantern fluorescence developed four times faster than EYFP and highlighted long-range processes that were poorly detectable in EYFP-labeled cells. Additionally, mGreenLantern retains strong fluorescence after tissue clearing and expansion microscopy, thereby facilitating superresolution and whole-brain imaging without immunohistochemistry. mGreenLantern can directly replace EGFP/EYFP in diverse systems due to its compatibility with GFP filter sets, recognition by EGFP antibodies, and excellent performance in mouse, human, and bacterial cells. Our screening and rational engineering approach is broadly applicable and suggests that greater potential of fluorescent proteins, including biosensors, could be unlocked using a similar strategy.

Keywords: GFP; fluorescent protein; imaging; neurobiology; protein engineering.


Conflict of interest statement

The authors declare no competing interest.

Figures

Fig. 1.
Fig. 1.
Biochemical properties and brightness of FPs in cultured cells. (A) Brightness of FPs in HeLa cells 48 h after transfection with a single coexpression plasmid that produces an FP and mCherry in a 1:1 stoichiometric ratio. (B) Brightness of FPs in HeLa cells cotransfected with an FP and mCherry from separate plasmids. (C) Brightness of FPs in E. coli after overnight expression from the pBAD vector. (D) Cytosolic FPs in HeLa cells imaged 48 h after chemical transfection using plasmids from B, excluding mCherry. All FPs were imaged using identical settings on a widefield microscope. The same image is shown in grayscale and standard green pseudocolor. Magnification, 10×. (Scale bars, 50 µm.) (E) Average brightness of HeLa cells expressing the FPs in D, n = 6 replicates, ≥300 cells analyzed per transfection per FP. (F) Maturation of FP chromophores from lysed bacteria as described in Methods. (G) Excitation and emission spectra of mGreenLantern. (H) Unlike EGFP and EYFP, mGreenLantern (mGL) does not absorb 405-nm near-UV light. (I) Kinetic unfolding of purified FPs in a denaturing solution of guanidinium HCl, 6.3 M, pH 7.5 (GdnHCl). (J) Melting of purified FPs in a thermal cycler. (K) HeLa cells expressing an actin-mGreenLantern fusion protein. (Left) Live cells before the expansion microscopy (proExM) process. (Right) A different representative cell after proExM, imaged in the expanded state in ddH2O. Both images were collected at 63× magnification. (Scale bars for both images: 20 µm.) The green box indicates approximate size of postexpansion field of view based on resolution.
Fig. 2.
Fig. 2.
mGreenLantern expresses efficiently in the mouse brain and robustly illuminates long-range neuronal projections. (A) At 7 d post injection (d.p.i.), individual mGreenLantern-expressing neurons of the visual cortex were readily discernible using 63× magnification, (B) as well as the characteristic organization of visual cortex layer VI and hippocampus subfield CA1 at 10× magnification. (C) Injection strategy to label neurons using mGreenLantern and Cre virus mixture in a 10:1 particle ratio. (D) EYFP injected into the ACA as depicted in A did not effectively highlight neuronal projections from ACA to striatum at 14 d.p.i. Rather, fluorescence was primarily restricted to the ACA injection area. Grayscale confocal fluorescence microscopy images were converted to 16-color heat maps and overlaid with corresponding sections from the Allen Brain Atlas from an age-matched mouse for visual reference. (E) mGreenLantern fluorescence at 14 d.p.i. was clearly visible in neurons originating from ACA cell bodies with axonal projections radiating through striatum, corpus callosum, and claustrum. (F) Area of projections in corpus callosum and striatum relative to ACA expression is quantified; n = 3 mice, two-way ANOVA, *P < 0.05.
Fig. 3.
Fig. 3.
In vivo expression kinetics of virally transduced mGreenLantern and EYFP in mouse. (A) AAV2/1-EF1α-DIO-mGreenLantern-WPRE-pA or EYFP virus co-injected with AAV-Cre and Alexa 594-coated latex beads (tracer) into anterior cingulate area (ACA). (B) mGreenLantern and EYFP expression in ACA at the indicated time points. Gain was decreased equally for all samples at day 3 to avoid mGreenLantern oversaturation; settings were maintained for day 14. Percentages in Top Right represent the area filled relative to day 14 for each FP. Magnification, 10×. See SI Appendix, Fig. S8 for quantitation.
Fig. 4.
Fig. 4.
mGreenLantern (mGL) improves visualization of neuronal morphology in vivo and ex vivo. (A) Representative mGL-expressing neurons in ACA after 1- and 2-wk expression without antibody enhancement, compared to EGFP stained with α-GFP antibody at 2 wk. White wedges suggest the difficulty of distinguishing true neuronal substructures from background puncta after immunohistochemistry (IHC). Confocal microscopy, nonidentical gain settings. Magnification, 100×. (B) Schematic for two-photon (2P) imaging of the living mouse brain through a surgically implanted cranial window. (C) Representative images of neurons expressing EGFP and mGreenLantern in the cortex of live mice using 2P microscopy through a cranial window. Identical imaging settings. (Scale bar, 5 µm.) (D) Density of dendritic spines observed per 100 µm, normalized to EGFP. n = 95 and 101 neurons quantified from two and three mice for EGFP and mGreenLantern, respectively (mean ± SD). (E) Representative widefield images of neurons dissected from E17 mouse hippocampus and transduced with AAV2/1-CAG-EGFP or mGreenLantern virus after 10 d of culture. The neurons were fixed with PFA and imaged using identical excitation and acquisition settings with a standard EGFP filter set. Magnification, 63×. (Scale bar, 25 µm.) (F) Brightness of primary neurons from a minimum of three independent cultures, each with 20 random images quantified per condition. Mean ± SEM; Student’s t test, *P < 0.05.

References

    1. Harvey A. R., et al. , “Use of GFP to analyze morphology, connectivity, and function of cells in the central nervous system” in Viral Applications of Green Fluorescent Protein: Methods and Protocols, Hicks B. W., Ed. (Humana Press, 2009), pp. 63–95. - PubMed
    1. Porrero C., Rubio-Garrido P., Avendaño C., Clascá F., Mapping of fluorescent protein-expressing neurons and axon pathways in adult and developing Thy1-eYFP-H transgenic mice. Brain Res. 1345, 59–72 (2010). - PubMed
    1. Lulevich V., Shih Y. P., Lo S. H., Liu G. Y., Cell tracing dyes significantly change single cell mechanics. J. Phys. Chem. B 113, 6511–6519 (2009). - PMC - PubMed
    1. Lam A. J., et al. , Improving FRET dynamic range with bright green and red fluorescent proteins. Nat. Methods 9, 1005–1012 (2012). - PMC - PubMed
    1. Bajar B. T., et al. , Improving brightness and photostability of green and red fluorescent proteins for live cell imaging and FRET reporting. Sci. Rep. 6, 20889 (2016). - PMC - PubMed

Publication types

Substances