Clinical Trial
. 2020 Nov 19;5(22):e132852.
doi: 10.1172/jci.insight.132852.

Neoadjuvant pazopanib and molecular analysis of tissue response in renal cell carcinoma

Affiliations
Clinical Trial

Neoadjuvant pazopanib and molecular analysis of tissue response in renal cell carcinoma

Christopher G Wood et al. JCI Insight. .

Abstract

BACKGROUNDSurgery remains the frontline therapy for patients with localized clear cell renal cell carcinoma (ccRCC); however, 20%-40% recur. Angiogenesis inhibitors have improved survival in metastatic patients and may result in responses in the neoadjuvant setting. The impact of these agents on the tumor genetic heterogeneity or the immune milieu is largely unknown. This phase II study was designed to evaluate safety, response, and effect on tumor tissue of neoadjuvant pazopanib.METHODSccRCC patients with localized disease received pazopanib (800 mg daily; median 8 weeks), followed by nephrectomy. Five tumors were examined for mutations by whole exome sequencing from samples collected before therapy and at nephrectomy. These samples underwent RNA sequencing; 17 samples were available for posttreatment assessment.RESULTSTwenty-one patients were enrolled. The overall response rate was 8 of 21 (38%). No patients with progressive disease. At 1-year, response-free survival and overall survival was 83% and 89%, respectively. The most frequent grade 3 toxicity was hypertension (33%, 7 of 21). Sequencing revealed strong concordance between pre- and posttreatment samples within individual tumors, suggesting tumors harbor stable core profiles. However, a reduction in private mutations followed treatment, suggesting a selective process favoring enrichment of driver mutations.CONCLUSIONNeoadjuvant pazopanib is safe and active in ccRCC. Future genomic analyses may enable the segregation of driver and passenger mutations. Furthermore, tumor infiltrating immune cells persist during therapy, suggesting that pazopanib can be combined with immune checkpoint inhibitors without dampening the immune response.FUNDINGSupport was provided by Novartis and GlaxoSmithKline as part of an investigator-initiated study.

Keywords: Cancer; Clinical Trials; Expression profiling; Oncology; Urology.


Conflict of interest statement

Conflict of interest: JGW is an inventor on a patent licensed to Anasys Instruments. JAK is a consultant, advisory board member, or has received honoraria from EMD Serono, Pfizer, Novartis, and Roche/Genentech and has received institutional research funding from Roche/Genentech and Mirati. MIM has received institutional research funding from Merck, Roche/Genentech, Bristol-Myers Squibb, Seattle Genetics, Astellas Pharma, Clovis Oncology, Inovio Pharmaceuticals, AstraZeneca, Mirati Therapeutics, Constellation Pharmaceuticals, Syndax, MedImmune, and Incyte for unrelated studies and served as on advisory board for Asieris with honoraria to institutional research fund. WKR and TP received institutional research funding from Novartis in support of this research. WKR has received additional institutional research funding from Pfizer, Bristol-Myers Squibb, Incyte, Merck/Peloton, Roche/Genentech, and Calithera for unrelated studies.

Figures

Figure 1
Figure 1. Treatment and molecular biomarker analysis schema.
Patients enrolled in this study were identified in the urological oncology clinic with nonmetastatic stage II or greater disease. All patients underwent a percutaneous biopsy to confirm clear cell histology and donated whole blood for genomic DNA comparison. Patients were treated with at least 8 weeks of pazopanib and evaluated by repeat imaging before nephrectomy. DNA was prepared for whole exome sequencing from the whole blood buffy coat, the pretreatment biopsy, and the posttreatment nephrectomy specimens. RNA was prepared for transcript analysis from pretreatment biopsy and nephrectomy specimen.
Figure 2
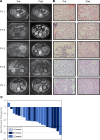
Figure 2. Neoadjuvant treatment with pazopanib resulted in encouraging clinical activity in patients with treatment-naive, locally advanced clear cell RCC.
(A) Representative examples of pre- and posttreatment CT images of a partial responder (left, patient [Pt.] 5) and a patient with stable disease (left, Pt. 6), respectively. RECIST v1.1 longest dimensions are shown in each panel. Changes in tumor density were not captured in response assessment. (B) Histology for each patient is shown. (C) Best percent change from baseline is shown for each patient, with the color scheme representing duration of neoadjuvant treatment. Dashed line is the RECIST v1.1–defined PR, showing 6 patients exhibited a PR on study. Additionally, the duration of neoadjuvant treatment has little effect on tumor regression.
Figure 3
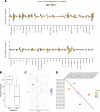
Figure 3. Results of the DNA allelic frequency analysis.
(A) Hierarchical cluster analysis of mutations from pre- to posttreatment samples reveals close clustering of corresponding pre- and posttreatment samples. Each tumor is annotated along x axis. MAF, mutant allele frequency. (B) Overall total mutations are decreased in posttreatment tumors. (C) The number of private mutations for each sample was divided by the overall number of mutations between the pairs to yield the fraction of private mutations: a reflection of increasing clonality in the post-treatment tumors. (D) Density plots comparing all mutations with shared mutations only (private mutations excluded) shows that differences between samples are due to private mutations.
Figure 4
Figure 4. Transcriptional changes with neoadjuvant pazopanib therapy.
(A) DESeq2 was used to perform differential gene expression analysis on unnormalized gene counts from patients before and after pazopanib treatment. Heatmap shows z scores of genes significantly different after Benjamini-Hochberg FDR correction (P ≤ 0.2) ordered by fold change. (B) Volcano plot shows all DESeq2 gene results, graphing P value over change. Color indicates FDR corrected P value of gene. The 20 most significant genes are labeled. (C) Single-sample gene set enrichment analysis (ssGSEA) was performed on upper-quartile normalized gene expression data from patients in A. The primary gene sets used were MSigDB’s chemical and genetic perturbations, KEGG, and oncogenetic signatures. As in A, z scores of gene sets significantly different (FDR-corrected P ≤ 0.2) are shown. (D) All ssGSEA gene sets from analysis in C are shown with the highest 20 genes sets labeled.
Figure 5
Figure 5. Immune features pre and post neoadjuvant pazopanib therapy.
(A) Immune gene signatures were made from log2 normalized gene counts. Two-tailed t test comparisons were made between matched patient pre- and posttreatment samples. No signatures were significant after Benjamini-Hochberg FDR correction. (B) Shannon entropy was calculated on TRB CDR3 counts. Points are colored by patient. Pre- and posttreatment results were not significantly different (paired t test, P = 0.18). (C) Public IgH CDR3 are represented on the y axis. Heatmap colors indicate the fraction of total counts a CDR3 represents out of the total IgH CDR3 counts for each a sample. (D) Morisita-Horn index was calculated on the fractional expression of all IgH CDR3 for each sample combination.
Figure 6
Figure 6. Transcriptional changes with neoadjuvant pazopanib therapy.
DESeq2 was used to perform differential gene expression analysis on unnormalized gene counts between pretreatment samples of patients (n = 15) showing stable disease and patients (n = 6) showing partial response to pazopanib treatment. Volcano plot shows all DESeq2 (R package v1.14.1; ref. 38) gene results, graphing P value over fold change. Color indicates FDR-corrected P value of gene. The 20 most significant genes are labeled. (A and B) Typical non-hERV encoding genes (A) and hERV genes (B).

References

    1. Siegel RL, Miller KD, Jemal A. Cancer statistics, 2018. CA Cancer J Clin. 2018;68(1):7–30. doi: 10.3322/caac.21442. - DOI - PubMed
    1. Janzen NK, Kim HL, Figlin RA, Belldegrun AS. Surveillance after radical or partial nephrectomy for localized renal cell carcinoma and management of recurrent disease. Urol Clin North Am. 2003;30(4):843–852. doi: 10.1016/S0094-0143(03)00056-9. - DOI - PubMed
    1. Ravaud A, et al. Adjuvant Sunitinib in High-Risk Renal-Cell Carcinoma after Nephrectomy. N Engl J Med. 2016;375(23):2246–2254. doi: 10.1056/NEJMoa1611406. - DOI - PubMed
    1. Bindayi A, et al. Neoadjuvant therapy for localized and locally advanced renal cell carcinoma. Urol Oncol. 2018;36(1):31–37. doi: 10.1016/j.urolonc.2017.07.015. - DOI - PubMed
    1. Sternberg CN, et al. Pazopanib in locally advanced or metastatic renal cell carcinoma: results of a randomized phase III trial. J Clin Oncol. 2010;28(6):1061–1068. doi: 10.1200/JCO.2009.23.9764. - DOI - PubMed

Publication types

MeSH terms